Visualize a decision tree in 4 ways with scikit learn and python mljar (1)
Bạn đang xem bản rút gọn của tài liệu. Xem và tải ngay bản đầy đủ của tài liệu tại đây (3.93 MB, 13 trang )
Visualize a Decision Tree in 4 Ways with Scikit-Learn and Python | MLJAR
1 of 13
mljar
Mercury
/>
AutoML
Blog
GitHub
Visualize a Decision Tree in 4
Ways with Scikit-Learn and
Python
June 22, 2020 by Piotr Płoński
Decision tree
A Decision Tree is a supervised algorithm used in machine learning. It is using a binary
tree graph (each node has two children) to assign for each data sample a target value.
The target values are presented in the tree leaves. To reach to the leaf, the sample is
propagated through nodes, starting at the root node. In each node a decision is made,
to which descendant node it should go. A decision is made based on the selected
sample’s feature. Decision Tree learning is a process of finding the optimal rules in
each internal tree node according to the selected metric.
The
can If
beyou
divided,
withbrowsing
respect to
the
target you
values,
into:these cookies.
Thisdecision
site usestrees
cookies.
continue
our
website,
accept
• Classification trees used to
classify
assign to a limited set of values More
info samples,
Accept
16/05/2023, 15:05
Visualize a Decision Tree in 4 Ways with Scikit-Learn and Python | MLJAR
2 of 13
/>
classes. In scikit-learn it is DecisionTreeClassifier .
• Regression trees used to assign samples into numerical values within the range.
In scikit-learn it is DecisionTreeRegressor .
Decision trees are a popular tool in decision analysis. They can support decisions
thanks to the visual representation of each decision.
Below I show 4 ways to visualize Decision Tree in Python:
• print text representation of the tree with sklearn.tree.export_text
method
• plot with sklearn.tree.plot_tree method (matplotlib needed)
• plot with sklearn.tree.export_graphviz method (graphviz needed)
• plot with dtreeviz package (dtreeviz and graphviz needed)
I will show how to visualize trees on classification and regression tasks.
Train Decision Tree on Classification Task
I will train a DecisionTreeClassifier on iris dataset. I will use default hyperparameters for the classifier.
from
from
from
from
matplotlib import pyplot as plt
sklearn import datasets
sklearn.tree import DecisionTreeClassifier
sklearn import tree
# Prepare the data data
iris = datasets.load_iris()
X = iris.data
y = iris.target
# Fit the classifier with default hyper-parameters
clf = DecisionTreeClassifier(random_state=1234)
model = clf.fit(X, y)
Print Text Representation
Exporting Decision Tree to the text representation can be useful when working on
This site uses cookies. If you continue browsing our website, you accept these cookies.
applications whitout user interface or when we want to log information about the
More
info details
Accept
model into the text file. You can
check
about export_text in the sklearn
16/05/2023, 15:05
Visualize a Decision Tree in 4 Ways with Scikit-Learn and Python | MLJAR
3 of 13
/>
docs.
text_representation = tree.export_text(clf)
print(text_representation)
|--- feature_2 <= 2.45
|
|--- class: 0
|--- feature_2 > 2.45
|
|--- feature_3 <= 1.75
|
|
|--- feature_2 <= 4.95
|
|
|
|--- feature_3 <= 1.65
|
|
|
|
|--- class: 1
|
|
|
|--- feature_3 > 1.65
|
|
|
|
|--- class: 2
|
|
|--- feature_2 > 4.95
|
|
|
|--- feature_3 <= 1.55
|
|
|
|
|--- class: 2
|
|
|
|--- feature_3 > 1.55
|
|
|
|
|--- feature_0 <= 6.95
|
|
|
|
|
|--- class: 1
|
|
|
|
|--- feature_0 > 6.95
|
|
|
|
|
|--- class: 2
|
|--- feature_3 > 1.75
|
|
|--- feature_2 <= 4.85
|
|
|
|--- feature_1 <= 3.10
|
|
|
|
|--- class: 2
|
|
|
|--- feature_1 > 3.10
|
|
|
|
|--- class: 1
|
|
|--- feature_2 > 4.85
|
|
|
|--- class: 2
If you want to save it to the file, it can be done with following code:
with open("decistion_tree.log", "w") as fout:
fout.write(text_representation)
Plot Tree with plot_tree
The plot_tree method was added to sklearn in version 0.21 . It requires
matplotlib to be installed. It allows us to easily produce figure of the tree (without
intermediate exporting to graphviz) The more information about plot_tree
arguments are in the docs.
This site uses cookies. If you continue browsing our website, you accept these cookies.
fig = plt.figure(figsize=(25,20))
_ = tree.plot_tree(clf,
More info
Accept
feature_names=iris.feature_names,
16/05/2023, 15:05
Visualize a Decision Tree in 4 Ways with Scikit-Learn and Python | MLJAR
4 of 13
/>
class_names=iris.target_names,
filled=True)
(The plot_tree returns annotations for the plot, to not show them in the notebook I
assigned returned value to _ .)
To save the figure to the .png file:
fig.savefig("decistion_tree.png")
Please notice that I’m using filled=True in the plot_tree . When this parameter is
set to True the method uses color to indicate the majority of the class. (It will be nice
if there will be some legend with class and color matching.)
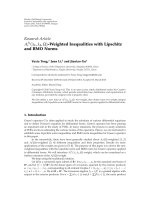
Visualize Decision Tree with graphviz
Please
make
thatIfyou
graphviz
installed
( pip you
install
). To
This site
usessure
cookies.
youhave
continue
browsing
our website,
acceptgraphviz
these cookies.
plot the tree first we need to export it to DOT format with export_graphviz
More
info
Accept
method (link to docs). Then we can
plot
it in the
notebook or save to the file.
16/05/2023, 15:05
Visualize a Decision Tree in 4 Ways with Scikit-Learn and Python | MLJAR
5 of 13
/>
import graphviz
# DOT data
dot_data = tree.export_graphviz(clf, out_file=None,
feature_names=iris.feature_names,
class_names=iris.target_names,
filled=True)
# Draw graph
graph = graphviz.Source(dot_data, format="png")
graph
petal length (cm) <= 2.45
gini = 0.667
samples = 150
value = [50, 50, 50]
class = setosa
False
True
gini = 0.0
samples = 50
value = [50, 0, 0]
class = setosa
petal width (cm) <= 1.65
gini = 0.041
samples = 48
value = [0, 47, 1]
class = versicolor
gini = 0.0
samples = 47
value = [0, 47, 0]
class = versicolor
gini = 0.0
samples = 1
value = [0, 0, 1]
class = virginica
petal width (cm) <= 1.75
gini = 0.5
samples = 100
value = [0, 50, 50]
class = versicolor
petal length (cm) <= 4.95
gini = 0.168
samples = 54
value = [0, 49, 5]
class = versicolor
petal length (cm) <= 4.85
gini = 0.043
samples = 46
value = [0, 1, 45]
class = virginica
petal width (cm) <= 1.55
gini = 0.444
samples = 6
value = [0, 2, 4]
class = virginica
sepal width (cm) <= 3.1
gini = 0.444
samples = 3
value = [0, 1, 2]
class = virginica
gini = 0.0
samples = 3
value = [0, 0, 3]
class = virginica
sepal length (cm) <= 6.95
gini = 0.444
samples = 3
value = [0, 2, 1]
class = versicolor
gini = 0.0
samples = 2
value = [0, 2, 0]
class = versicolor
gini = 0.0
samples = 2
value = [0, 0, 2]
class = virginica
gini = 0.0
samples = 43
value = [0, 0, 43]
class = virginica
gini = 0.0
samples = 1
value = [0, 1, 0]
class = versicolor
gini = 0.0
samples = 1
value = [0, 0, 1]
class = virginica
graph.render("decision_tree_graphivz")
'decision_tree_graphivz.png'
Plot
with browsing
dtreeviz
Package
This siteDecision
uses cookies. Tree
If you continue
our website,
you accept these cookies.
The dtreeviz package is available in github. It can be installed with pip install
More info
Accept
dtreeviz . It requires graphviz to be installed (but you dont need to manually
16/05/2023, 15:05
Visualize a Decision Tree in 4 Ways with Scikit-Learn and Python | MLJAR
6 of 13
/>
convert between DOT files and images). To plot the tree just run:
from dtreeviz.trees import dtreeviz # remember to load the package
viz = dtreeviz(clf, X, y,
target_name="target",
feature_names=iris.feature_names,
class_names=list(iris.target_names))
viz
<
≥
Save visualization to the file:
viz.save("decision_tree.svg")
This
site uses cookies. If you continue browsing our website, you accept these cookies.
More info
Accept
16/05/2023, 15:05
Visualize a Decision Tree in 4 Ways with Scikit-Learn and Python | MLJAR
7 of 13
/>
Visualizing the Decision Tree in Regression
Task
Below, I present all 4 methods for DecisionTreeRegressor from scikit-learn
package (in python of course).
from sklearn import datasets
from sklearn.tree import DecisionTreeRegressor
from sklearn import tree
# Prepare the data data
boston = datasets.load_boston()
X = boston.data
y = boston.target
To keep the size of the tree small, I set max_depth = 3 .
# Fit the regressor, set max_depth = 3
regr = DecisionTreeRegressor(max_depth=3, random_state=1234)
model = regr.fit(X, y)
text_representation = tree.export_text(regr)
print(text_representation)
|--- feature_5 <= 6.94
|
|--- feature_12 <= 14.40
|
|
|--- feature_7 <= 1.38
|
|
|
|--- value: [45.58]
|
|
|--- feature_7 > 1.38
|
|
|
|--- value: [22.91]
|
|--- feature_12 > 14.40
|
|
|--- feature_0 <= 6.99
|
|
|
|--- value: [17.14]
|
|
|--- feature_0 > 6.99
|
|
|
|--- value: [11.98]
|--- feature_5 > 6.94
|
|--- feature_5 <= 7.44
|
|
|--- feature_4 <= 0.66
|
|
|
|--- value: [33.35]
|
|
|--- feature_4 > 0.66
|
|
|
|--- value: [14.40]
|
|--- feature_5 > 7.44
|
|
|--- feature_10 <= 19.65
|
|
| cookies.
|--- If
value:
[45.90]
This site uses
you continue
browsing our website, you accept these cookies.
|
|
|--- feature_10 > 19.65
|
|
|
|--- value: More
[21.90]
info
Accept
16/05/2023, 15:05
Visualize a Decision Tree in 4 Ways with Scikit-Learn and Python | MLJAR
8 of 13
/>
fig = plt.figure(figsize=(25,20))
_ = tree.plot_tree(regr, feature_names=boston.feature_names, filled
Please notice, that the color of the leaf is coresponding to the predicted value.
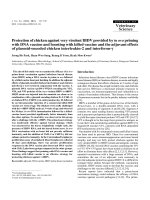
dot_data = tree.export_graphviz(regr, out_file=None,
feature_names=boston.feature_names
filled=True)
graphviz.Source(dot_data, format="png")
This site uses cookies. If you continue browsing our website, you accept these cookies.
More info
Accept
16/05/2023, 15:05
Visualize a Decision Tree in 4 Ways with Scikit-Learn and Python | MLJAR
9 of 13
/>
RM <= 6.941
mse = 84.42
samples = 506
value = 22.533
True
DIS <= 1.385
mse = 26.009
samples = 255
value = 23.35
mse = 78.146
samples = 5
value = 45.58
mse = 14.885
samples = 250
value = 22.905
mse = 11.391
samples = 101
value = 17.138
False
LSTAT <= 14.4
mse = 40.273
samples = 430
value = 19.934
RM <= 7.437
mse = 79.729
samples = 76
value = 37.238
CRIM <= 6.992
mse = 19.276
samples = 175
value = 14.956
NOX <= 0.659
mse = 41.296
samples = 46
value = 32.113
mse = 14.674
samples = 74
value = 11.978
mse = 20.111
samples = 43
value = 33.349
PTRATIO <= 19.65
mse = 36.628
samples = 30
value = 45.097
mse = 9.307
samples = 3
value = 14.4
mse = 18.697
samples = 29
value = 45.897
mse = -0.0
samples = 1
value = 21.9
from dtreeviz.trees import dtreeviz # remember to load the package
viz = dtreeviz(regr, X, y,
target_name="target",
feature_names=boston.feature_names)
viz
<
≥
From above methods my favourite is visualizing with dtreeviz package. I like it
becuause:
• site
it shows
the distribution
of decision
feature
the eachyou
node
(nice!)
This
uses cookies.
If you continue
browsing
ourinwebsite,
accept
these cookies.
• it shows the class-color matching legend
More info
Accept
• it shows the distribution of the class in the leaf in case of classification tasks,
16/05/2023, 15:05
Visualize a Decision Tree in 4 Ways with Scikit-Learn and Python | MLJAR
10 of 13
/>
and mean of the leaf’s reponse in the case of regression tasks
It would be great to have dtreeviz visualization in the interactive mode, so the user
can dynamically change the depth of the tree. I’m using dtreeviz package in my
Automated Machine Learning (autoML) Python package mljar-supervised . You can
check the details of the implementation in the github repository. One important thing
is, that in my AutoML package I’m not using decision trees with max_depth greater
than 4 . I add this limit to not have too large trees, which in my opinion loose the
ability of clear understanding what’s going on in the model. Below is the example of
the markdown report for Decision Tree generated by mljar-supervised .
« Compare MLJAR with Google AutoML Tables
How to reduce memory used by Random Forest
from Scikit-Learn in Python? »
This site uses cookies. If you continue browsing our website, you accept these cookies.
More info
Accept
16/05/2023, 15:05
Visualize a Decision Tree in 4 Ways with Scikit-Learn and Python | MLJAR
11 of 13
/>
Convert Python Notebooks to Web Apps
We are working on open-source framework Mercury for converting
Jupyter Notebooks to interactive Web Applications.
Read more
This site uses cookies. If you continue browsing our website, you accept these cookies.
More info
Accept
16/05/2023, 15:05
Visualize a Decision Tree in 4 Ways with Scikit-Learn and Python | MLJAR
12 of 13
/>
Articles you might find interesing
1. 8 surprising ways how to use Jupyter Notebook
2. Create a dashboard in Python with Jupyter Notebook
3. Build Computer Vision Web App with Python
4. Develop NLP Web App from Python Notebook
5. Build dashboard in Python with updates and email notifications
6. Share Jupyter Notebook with non-technical users
Join our newsletter
Subscribe to our newsletter to receive product updates
Subscribe
This site uses cookies. If you continue browsing our website, you accept these cookies.
More info
Accept
16/05/2023, 15:05
Visualize a Decision Tree in 4 Ways with Scikit-Learn and Python | MLJAR
13 of 13
mljar
Outstanding Data
Science Tools
/>
Blog
Mercury
About
AutoML
Brand Assets
Pricing
GitHub
Compare Algorithms
AutoML Comparison
Decision Tree vs Random Forest
What is AutoML?
Random Forest vs Xgboost
Golden Features
Xgboost vs LightGBM
K-Means Features
CatBoost vs Xgboost
Feature Selection
© 2023 MLJAR, Sp. z o.o. • Terms of service • Privacy policy • EULA • Contact •
This site uses cookies. If you continue browsing our website, you accept these cookies.
More info
Accept
16/05/2023, 15:05