Cs224W 2018 31
Bạn đang xem bản rút gọn của tài liệu. Xem và tải ngay bản đầy đủ của tài liệu tại đây (3.05 MB, 8 trang )
CS224W Project Report
Analyzing the flow of currency and price
movements in the Bitcoin network
David Golub and Liam Kelly
December
9, 2018
Abstract
Blockchains offer an open financial network where one user can send
money to another user without the need of a trusted third-party. One of
the key use cases of this technology is speculative investing: users buy an
asset with the hope that it will go up in price later. However, in contrast to
conventional financial systems, the transaction graph is open and available
for anyone to analyze. In this work, we study the relationship the flow of
assets to and from influential nodes in this open graph (i.e., exchanges)
and the price of Bitcoin, the largest currency by market capitalization.
GitHub Repository: https: //github.com/ljkelly/cs224w
1
Introduction
Blockchains such as Ethereum and Bitcoin offer a distributed, trustless ledger as
a service. One of the primary use cases is financial transactions, where money
is sent from one address to another in a peer-to-peer fashion. In traditional
financial systems such as banks, data is opaque and difficult to access. However,
once a transaction is been finalized on Bitcoin or Ethereum, it is immutable and
publicly available for any user to inspect. Moreover, the prices of financial assets
on these blockchains fluctuate significantly and consequently offer opportunities
for quantitative trading. From this standpoint, we intend to correlate the flow
of assets on these blockchains with their price movements. Through network
analysis on the open ledgers, we analyze markets in a novel way. In addition,
we aim to fuse deanonymization technology with well known alpha generating
signals in traditional markets to improve results.
To begin, we will look at prior work that has been done in Section 2 before
we discuss how we collected the data that we are using, the algorithms, and the
models in Section 3. After that, we will go through the results and findings in
Section 4 before concluding in Section 5.
2
Review
of relevant prior work
In the following sections, we provide a review of prior work that has been done
researching blockchains and analyzing their ledges as it pertains to our work.
2.1
Automatic Bitcoin Address Clustering [1]
In this paper, Ermilov, Panov, and Yanovich explored constructing cluster models by considering off-chain information combined with the blockchain in order
to reduce the error from purely transaction based analysis.
They used 97 sources of off-chain information such as Twitter to tag their
data and infer some structure with the data. They did some things such as
tagging the category that the address belongs to, and then figuring out which
tags were clean and dirty.
From these tags, they ran a clustering analysis over roughly 95 million addresses and found 14 million clusters, with the largest cluster containing around
26 million addresses. This paper shows that there are clusters that can be built
from off-chain information, creating more structure that can be inferred from
the graph.
However, they do not correlate these clustering methods further with currency prices and publicly known exchange addresses, which we do in our work.
2.2
Deanonymisation
ods for Bitcoin [2]
in Ethereum
Using Existing Meth-
In this paper, Klusman and Dijkhuizen researched the potential for deanonymizing transactions and users in Ethereum by using techniques that have been successful in deanonymizing the Bitcoin network, with the motivation of assisting
law enforcement agencies. Bitcoin and Ethereum have two different architectures, however. The authors determined that there was no way to apply the
currently available attacks against Bitcoin against Ethereum. In our case, we
aren’t interested in deanonymizing all addresses; instead, given a source node
such as an exchange, we intend to approximate the set of controlled addresses
of exchanges. Additionally, we are only interested in high-net worth addresses
that have significant movement in volume.
2.3.
Evolutionary dynamics of cryptocurrency transaction
networks:
An empirical study [3]
Liang et. al explore the flow of various cryptocurrencies over time; in particular,
they look at Bitcoin, Ethereum, and Namecoin. They investigate several phenomena: whether there is a temporal change in money ownership, volume, and
location/asset of interest over time. The three particular network properties
that they analyze are the node, edge, and average degree count over time; the
clustering coefficient; and the largest connected component.
With the node, edge, and degree counts, they investigate how the networks
have grown in different ways. They saw that the degree distribution followed a
power law after the adoption of users reaches some amount, dependent on the
cryptocurrency. They also found that Bitcoin and Ethereum were disassortive,
while Namecoin
was non-assortive.
Being disassortive means
that, in our case,
Ethereum tends to have low degree nodes with high degree neighbors.
The authors investigated how clustering coefficients compared to the clustering coefficients of a random network with the same degree sequence. They
also investigated the largest connected component (LCC). Within the Ethereum
network, the authors saw that the LCC contained roughly 40% of the nodes in
the network, with a diameter that seems to continue increasing slowly.
Since the authors kept their analysis to exploring the growth of network
properties with respect to these three cryptocurrencies, we believe there is room
to focus on Bitcoin and watch how the network changes with respect to the price
on exchanges.
2.4
The
Hubs
Powered
&
Authorities
by SANSA
in
Transaction
and Graph
Analysis
Network
[4]
-
This article, written by Alethio, involves using Graph techniques to analyze the
Ethereum network. They looked at the Connected Components and PageRank in order to determine the ”authorities” and ”hubs” within a subset of the
network, containing 10,000 blocks and 38 million triples.
Running the Connected Components algorithm on the graph, they found
roughly 185,000 accounts and 250,000 transaction relations between them. They
focused on the top 50 accounts and looked at their PageRank scores. The behaviors of those nodes were then analyzed to see frequent payouts and receiving
funds from users and miners. They also found proxy accounts that would immediately pay out funds to a set of specified recipients.
From this paper, we see that it is very possible to analyze the Bitcoin transaction network using existing tools.
3
3.1
Data Collection,
Model,
and Algorithm
Background
The blockchain data structure for the Bitcoin Network is a linked list where each
block references the hash of its parent block in the header. Each block contains a
series of transactions, stored in a Merkle tree. Transactions are defined through
the Bitcoin scripting language, where each script consumes transactions from
a list of source addresses, and stores the “unspent” outputs in the script. One
then references the outputs in a new block, and specifies destination addresses
that the coins should be sent to. Hence, one can trace the flow of currency to
addresses by tracing these input and output scripts. ' Our method allows us
to draw a connection between addresses that are owned by the same entity.
3.2
Bitcoin
Price
Data
We have collected the daily price data for Bitcoin for almost the past two years,
from 1 January 2017 to 26 November 2018. This data was collected using an
open API through CoinDesk [5] and allows us to compute the statistics shown
in Section 4. With these two years of price data we will be able to perform
correlation analysis to understand the sales of Bitcoin as it relates to the price.
1See https: //citp.github.io/BlockSci/reference/heuristics/change.html and https:
//citp.github.io/BlockSci/reference/heuristics/other_heuristics.html.
We do not
process addresses that have hundreds of millions of clustered addresses, as our single machine cannot scale to such capacity.
3.3
Top Address
Selection
We extract the top addresses exchange and non-exchange addresses from https:
//www.wal1etexplorer. com.
3.4
Address
Clustering
We use the BlockSci [6] library [7] to perform address clustering.
First, we
process the raw Bitcoin blockchain data structure to get a chain that connects
source addresses to target addresses that have received transactions. We then
exploit the unique properties of the Blockchain to cluster addresses together.
We identify change of address events, addresses that have the same signature
type, peeling chain events, optimal change events. From here, we can utilize
clustering algorithms to find the addresses with high asset counts and high
information flow within the network.
3.5
Model
We use the block header to correlate exchange funds with the timestamp.
We
assume a direct (linear) correlation between exchange funds and the price of
the underlying asset. Hence, we treat both as linear time series, and use the
Pearson correlation coefficient to measure the predictability of one to the other.
4
Results and findings
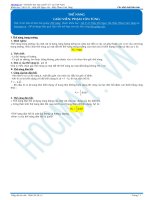
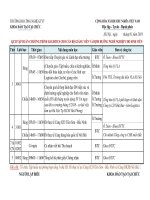
For the past two years, we have plotted the Bitcoin Prices in USD in Figure 1.
The statistics on this data are provided in Table 1. From these, we can see
the high volatility of the Bitcoin price, particularly during the Bitcoin boom in
late 2017/early 2018. Seeing how these price fluctuations occur, we think there
is significant research that can be done in watching how the major exchanges
react to the market price as it goes through its various boom cycles.
Mean
5518.07
Median
6192.31
Standard Deviation |
Max
Price
Min Price
3931.00
19343.04
702.50
Table 1: Bitcoin Summary Statistics from 11/2016 to 11/2018
From clustering we were able to find the addresses of the five most active
exchanges, as well as the addresses for three of the largest exchanges (Huobi,
Bittrex, and Poloniex). The addresses for the five most active exchanges are
shown in Table 2.
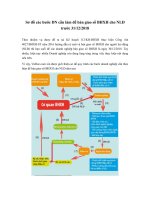
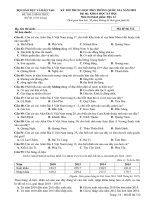
From here, we were able to look at how the amount of Bitcoin assets held by
each address as compared with the price. Looking at Figure 2, we can see the
amount of assets each address holds over time, overlayed with the price (dashed
line).
From here, we looked at the Pearson correlation on these raw asset numbers with the price to see how linear the relationship is between them. These
Bitcoin Price from 11/2016 to 11/2018
20000
17500 +
Price in USD
15000 +
12500 +
10000 +
7500 +
5000 +
2500 +
0+—
oo
\
4
wo
on™
1
r
soo
XỦ
r
om
©
r
ae
©
r
s05
©
r
soo
©
r
Date
Figure 1: Bitcoin Price Data
| Rank
|
Address
1
3D20etdNuZUqQHP JmcMDDHYoqkyNVsFk9r
Ou BY] C5|
9
16ftSEQ4ctQFDtVZiUBusQUjRrGhM3JYwe
16rCmCmbuWDhP j WirpQGaU3EPdZF7MTdUk
3Cbq7aT1tY8kMxWLbitaG7yT6bPbKChq64
3Nxwenay9Z8Lc9 JBiywExpnEFiLp6Af p8v
Table 2: Top addresses in the Bitcoin blockchain
correlations are all contained in Table 3 where the “Top Address X” numbers
are the addresses from Table 2 and the other three are the addresses associated
with those exchanges (Poloniex has one, Huobi has 18, and Bittrex has 7).
|
Exchange
Top
Top
Top
Top
Top
Address
Address
Address
Address
Address
Bittrex
Huobi
Poloniex
| Correlation with Price
1
2
3
4
5
|
0.5930
0.4718
0.8623
0.5042
-0.6788
0.3684
0.0710
0.2012
Table 3: Correlations between raw asset numbers and prices
As seen, some addresses, like Top Address 3, are very highly correlated.
Other exchanges are lowly correlated, indicating behavior that is mostly independent of the price. Meanwhile, Top Address 5 is negatively correlated,
indicating behavior that is the opposite of the price (i.e. more assets with a
Bitcoin assets over time from 2017-01-01 to 2018-11-26
— joloniex
—
—
<= gaz f 20000
top_address_4
luobi
\
200000 +-| —Tr tp_address_1
ip address2
F 17500
— tp address3
— wp address5
=——
Ø
Oo
F 15000
bittrex
150000 +
F 12500
a
o
5
5
+ 10000
100000 +
Eš
L 7500
50000 +
Ay 5000
F 2500
0
Jan
2017
Figure 2: Amount
T
T
Apr
T
Jul
T
Oct
T
Jan
2018
T
Apr
T
Jul
r0
Oct
of assets held by each exchange and the price versus time
lower price and vice-versa).
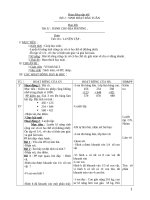
To understand this more, we took a look at the difference over periods of
time. In particular, we looked at asset differences and the price differences over
specific periods to understand how the amounts of assets moved matches how
the price has moved in that same recent of a time period. For this, we looked at
time periods of 1 day, 1 week, 2 weeks, 1 month (30 days), 1 quarter (120 days),
half a year, (180 days), and one year (365 days).
Plots of what this difference
data looks like for 1 day and 30 days periods are presented in Figure 3.
Bitcoin assets difference over period 1 days
Bitcoin assets difference over period 30 days
40000 + — 8
20000
100000
=
2000
50000
of
1000
~20000
~40000
no
-1000
ase
~100000.
i] rk
HAE
NY
Maly}D
~50000
N
~60000.
Wine
10000
|
I
1
'
l3
ị 1Ỉ
— 100000
\
~2009 ~1soooo
Apr
Jul
Oct
Jan
2018
Asta
Apr
Jul
Oct
|
Apr
Jul
Oct
~5000.
~10000
Ja n
2018
nata
(a) Price and Asset differences over 1 day (b) Price and Asset differences over 1 day
Figure 3: Price and Asset differences plotted on the same figure, right axis for
price difference left axis for asset difference
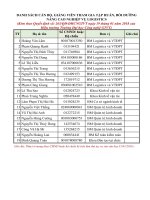
Although the data itself can look noisy, we again look at the Pearson correlations in Table 4 and we visualize this data in Figure 4.
We see that three of the correlation values increase with an increase in the difference period, indicating that the owners of those addresses generally acquired
Exchange
Difference period
i
|
7
[
14
|
30
|
Top Address 1 | -0.0090 | -0.1084 | -0.0981 | -0.0964 |
Top Address 2 | 0.0092 | 0.0429 | 0.0408 | 0.0035 |
Top Address 3 | 0.0135 | 0.1874 | 0.1417 | 0.1320 |
Top
Address 4 |
-0.0051 |
0.1502
0.1304
0.1490 |
(days)
120
[
180
|
365
0.0355 | 0.2138 | 0.7759
0.0244 | -0.1406 | -0.2977
0.6993 | 0.8167 | 0.9235
-0.0269 |
0.0224 |
-0.6824
Top Address 5 | -0.0250 | -0.1168 | -0.1323 | -0.1639 | -0.4177 | -0.6140 | -0.7616
Bittrex
-0.0683 | -0.1287 | -0.2326 | -0.1689 | 0.0650
0.2830
0.6733
Huobi
-0.0026 | 0.0589
0.1020
0.0119 | -0.1682 | -0.3657 | -0.5970
Poloniex
-0.0107 | 0.0510 | -0.0132 | -0.0646 | -0.1704 | -0.2070 | -0.2705
Table 4: Pearson Correlation for each exchange over different difference periods
Pearson Correlation versus period
1.00
—
—
—
bittrex
huobi
poloniex
Pearson Correlation value
0.75 4 — tp address1
— tp
— to
— trp
0.50 47 — tp
address2
address3
address4
address5
0.25 31
0.00
0.25
3
—0.50 +
0.75
3
1
7
14
30
Period (days)
120
180
365
Figure 4: Plot of the Pearson Correlation of the difference in assets and difference in prices for each of the periods
more assets over a period in which the price increased. The other four owners,
however, reduced the amount they had in assets when the price increased. From
here, especially at longer periods, we see the vision of two entirely different betting strategies. We see one strategy of selling when the price goes up, making
money off the change in price. However, we also see a strategy of buying more
as the price goes up, with the hopes of having greater returns in the future.
5
Conclusion/Discussion
In this work, we presented a model that correlates Bitcoin currency flow with
price fluctuations. We presented clustering algorithms and used them to group
addresses related to the top addresses ordered by currency amount. Our experimental results demonstrate that over a large time horizon, Bitcoin currency
flow across addresses, particularly address #3, is strongly correlated with Bitcoin price. For future work, we hope to design and back test a trading strategy
on exchange flow.
6
Contributions
Liam: Plots, Writeups, Data Pruning, Data Correlations and Analysis, Poster
David: Managing Infrastructure for Bitcoin Full Node, Processing and Cluster
Analysis of Transactions, Writeups, Poster
References
(1)
D. Ermilov, M. Panov, and Y. Yanovich,
tering,” Bitfury, Jan. 2018.
2
R. Klusman and T. Dijkhuizen, “Deanonymisation in ethereum using existing methods for bitcoin,” Feb. 2018.
“Automatic bitcoin address clus-
J. Liang, L. Lil, and D. Zeng, “Evolutionary dynamics of cryptocurrency
transaction networks: An empirical study,” PLoS ONE, vol. 13, Aug. 2018.
Alethio, “The hubs & authorities in transaction network — powered by sansa
and graph analysis,” Consensys, July 2018.
CoinDesk,
“Coindesk bitcoin price index api,” 2018.
A. C. M. M. A. N. Harry Kalodner, Steven Goldfeder, “Blocksci:
and applications of a blockchain analysis platform,” Sept. 2017.
Design
P. U. CITP, “Blocksci,” 2017.
A. Day and E. Medvedev, “Ethereum in bigquery:
contract analytics,” Aug. 2018.
a public dataset for smart