planning and installing solar thermal systems
Bạn đang xem bản rút gọn của tài liệu. Xem và tải ngay bản đầy đủ của tài liệu tại đây (17.9 MB, 369 trang )
Planning & Installing
Solar Thermal Systems
A guide for installers, architects and engineers
Fully revised & updated second edition
NEW EDITION OF THE BESTSELLING
INSTALLATION GUIDE
Solar thermal systems available today offer efficiency and reliability. They can be applied in different
conditions to meet space- and water-heating requirements in the residential, commercial and industrial
building sectors.
This fully updated edition of 2004’s bestselling guide offers clear guidance on planning and installing a
solar thermal system, crucial to the successful uptake of this technology. All major topics for successful
project implementation are included. Beginning with resource assessment and an outline of core
components, it details the latest best practice in solar thermal system design, installation, operation and
maintenance for single households, large systems, swimming pool heaters, solar air and solar cooling
applications. Details on how to market solar thermal technologies, a review of relevant simulation tools
and data on selected regional, national and international renewable energy programmes are also
provided.
This is the definitive source of guidance for professionals who wish to install solar thermal technology
and is a highly valued resource for architects, engineers, roofers and anyone undertaking vocational
training or with a specialized and practical interest in this field.
About the Authors:
German Solar Energy Society (DG
S) is the German section of the International Solar Energy Society.
Energy/Engineering
www.earthscan.co.uk
9 781844 077601
ISBN 978-1-84407-760-1
Deutsche Gesellschaft für Sonnenenergie e.V.
International Solar Energy Society, German Section
DGS
222x297mm spine 18mm
Planning & Installing Solar Thermal Systems
second edition
Planning and Installing
Solar Thermal Systems
A guide for installers, architects and engineers
Second edition
A01_PAI_Solar Thermal Systems_Prelims:therimpr.qxd 31/03/2010 16:46 Page i
A01_PAI_Solar Thermal Systems_Prelims:therimpr.qxd 31/03/2010 16:46 Page ii
Planning and Installing
Solar Thermal Systems
A guide for installers, architects and engineers
Second edition
London • Washington, DC
A01_PAI_Solar Thermal Systems_Prelims:therimpr.qxd 31/03/2010 16:46 Page iii
First published in 2010 by Earthscan
Copyright © Deutsche Gesellshaft für Sonnenenergie, 2010
First edition published by James & James (Science Publishers) Ltd in the UK and USA in
2005
All rights reserved. No part of this publication may be reproduced, stored in a retrieval
system, or transmitted, in any form or by any means, electronic, mechanical, photocopying,
recording or otherwise, except as expressly permitted by law, without the prior, written
permission of the publisher.
While the author and publishers believe that the information and guidance given in this work
are correct, all parties must rely upon their own skill and judgement when making use of
them – it is not meant to be a replacement for manufacturer’s instructions and legal technical
codes. Neither the author nor the publisher assumes any liability for any loss or damage
caused by any error or omission in the work. Any and all such liability is disclaimed.
This book was written using principally metric units. However, for ease of reference by
readers more familiar with imperial units, the publisher has inserted these in the text in
brackets after their metric equivalents. Please note that some conversions may have been
rounded up or down for the purposes of clarity.
Earthscan Ltd
Dunstan House, 14a St Cross Street
London EC1N 8XA, UK
Earthscan LLC
1616 P Street, NW,
Washington, DC 20036, USA
Earthscan publishes in association with the
International Institute for Environment and Development
For more information on Earthscan publications, see www.earthscan.co.uk or write to
ISBN: 978-1-84407-760-1
Typeset by Saxon Graphics Ltd
Cover design by Yvonne Booth
A catalogue record for this book is available from the British Library
Library of Congress Cataloging-in-Publication Data has been applied for.
At Earthscan we strive to minimize our environmental impacts and carbon footprint through
reducing waste, recycling and offsetting our CO2 emissions, including those created through
publication of this book. For more details of our environmental policy, see
www.earthscan.co.uk.
This book is printed in the UK by Scotprint, an
ISO 14001 accredited company. The paper used
is FSC certified and the inks are vegetable based.
A01_PAI_Solar Thermal Systems_Prelims:therimpr.qxd 31/03/2010 16:46 Page iv
Contents
Foreword xi
CHAPTER 1: Solar radiation and arguments for its use 1
1.1 Solar radiation 1
1.1.1 Solar energy 1
1.1.2 Astronomical and meteorological bases 1
1.1.3 Influence of orientation and tilt angle 8
1.1.4 Collection of dust and need for cleaning 10
1.2 The finiteness of energy resources 11
1.3 Climate change and its consequences 13
1.4 Good arguments for solar systems 16
CHAPTER 2: Components of solar thermal systems 17
2.1 How does a solar thermal system work? 17
2.2 Collectors 18
2.2.1 Unglazed collectors 21
2.2.2 Glazed flat-plate collectors 21
2.2.3 Vacuum collectors 30
2.2.4 Collector accessories 34
2.2.5 Collector characteristic curves and applications 35
2.2.6 Stagnation temperature 35
2.3 Heat stores 36
2.3.1 Storage materials 36
2.3.2 Domestic hot water stores 37
2.3.3 Buffer store 40
2.3.4 Combination stores 40
2.3.5 The thermostatic mixing valve 46
2.3.6 Connection of washing machines and dishwashers 46
2.3.7 Legionella contamination 46
2.4 Solar circuit 47
2.4.1 Pipelines 47
2.4.2 Solar liquid 48
2.4.3 Solar pumps 50
2.4.4 Solar heat exchanger (heat transfer unit) 51
2.4.5 Return-flow prevention 52
2.4.6 Rapid air bleeders 52
2.4.7 Flowmeters 54
2.4.8 Safety devices in the solar circuit 54
2.4.9 Solar station 55
2.5 Controller 55
2.5.1 Control principles for temperature difference control 59
2.5.2 Digital controller with special functions 59
2.5.3 Temperature sensors 62
2.5.4 Overheating protection 65
CHAPTER 3: Systems for single-family houses 67
3.1 Introduction 67
3.2 Systems for charging/discharging the store 68
3.2.1 Charging by means of solar energy 68
v
A01_PAI_Solar Thermal Systems_Prelims:therimpr.qxd 31/03/2010 16:46 Page v
3.2.2 Charging by means of auxiliary heating 69
3.2.3 Store discharge 70
3.3 Systems for heating domestic water 70
3.3.1 Standard system 70
3.3.2 Water heating using the flow-through principle 71
3.3.3 Water heating by means of tank-in-tank store 71
3.3.4 Water heating over external heat exchanger 71
3.3.5 Drain back system 72
3.4 Systems for heating domestic water and space heating 72
3.4.1 Combined store system (store-in-store system) 73
3.4.2 System with buffer store, internal heat exchanger for heat removal
and downpipe 73
3.4.3 Stratified store with hot water heating in once-through flow and
heating support 73
3.4.4 Twin store system 73
3.5 Planning and dimensioning 74
3.5.1 Important features for preparing the quotation 74
3.5.2 The dimensioning of systems for domestic water heating 77
3.5.3 Dimensioning of systems for heating domestic water and heating
support (central European conditions) 89
3.6 Costs and yields 90
3.6.1 Prices and performance 90
3.6.2 Normalised solar heat costs 94
CHAPTER 4: Installation, commissioning, maintenance
and servicing 97
4.1 A brief study of roofing and materials 97
4.1.1 The purpose of the roof 97
4.1.2 Types of roof 97
4.1.3 The components of the roof 98
4.1.4 Pitched roofs 103
4.1.5 Roof installations and mountings 103
4.1.6 Flat roofs 103
4.1.7 Materials 103
4.2 Installation methods and safety 107
4.2.1 UK safety regulations 107
4.2.2 UK personal access and working at heights 108
4.2.3 Working equipment 109
4.2.4 Transport techniques 110
4.2.5 Installation techniques 110
4.3 Installation 111
4.3.1 Delivery of material 111
4.3.2 Setting up the site, preparatory work 111
4.3.3 Collector installation 111
4.3.4 Installation of the solar circuit 126
4.3.5 Store installation 128
4.3.6 Installation of fittings 133
4.3.7 Installation of sensors and controllers 136
4.4 Starting up, maintenance and servicing 136
4.4.1 Flushing out the solar circuit 136
4.4.2 Leak testing 137
4.4.3 Filling with solar liquid 137
4.4.4 Setting the pump and controller 138
4.4.5 Maintenance 138
4.4.6 Detecting and rectifying faults 139
vi PLANNING AND INSTALLING SOLAR THERMAL SYSTEMS A guide for installers, architects and engineers
A01_PAI_Solar Thermal Systems_Prelims:therimpr.qxd 31/03/2010 16:46 Page vi
4.5 Information sources for specific countries 146
4.5.1 USA 146
4.5.2 Australia 146
4.5.3 Canada 147
CHAPTER 5: Large-scale systems 149
5.1 The fundamentals of designing the system size 149
5.1.1 Possible application areas 149
5.1.2 Initial data required for planning the solar system 149
5.1.3 System planning and design 150
5.2 Systems 153
5.2.1 Systems with domestic water store(s) 153
5.2.2 Systems with thermal buffer stores 154
5.2.3 Integration of circulation systems 156
5.3 Control of the systems 156
5.3.1 Collector circuit/storage charging circuit 156
5.3.2 Buffer tank circuit discharging 161
5.4 Heat exchangers 162
5.4.1 Design types 162
5.4.2 Collector circuit heat exchangers 164
5.4.3 Buffer tank discharge circuit heat exchangers 165
5.5 Safety technology 168
5.5.1 Collector field 168
5.5.2 Collector circuit 169
5.5.3 Buffer store circuit 170
5.5.4 Expansion vessels 171
5.5.5 Fittings on the domestic water line 171
5.6 Economic considerations 172
5.6.1 Annuity method 172
5.6.2 Types of costs for solar energy systems 173
5.7 Solar contracting 174
5.8 Solar district heating 177
5.8.1 Solar energy systems with short-term heat storage 178
5.8.2 Solar systems with long-term heat storage 178
5.8.3 Guide values for the design of solar district heating systems 179
5.8.4 Components of solar district heating systems 179
5.8.5 Practical experience 181
CHAPTER 6: Solar concentrating systems 183
6.1 Concentration of solar radiation 183
6.2 Concentrating systems providing process heat 184
6.3 Concentrating solar thermal systems for electricity generation 189
6.3.1 Parabolic trough plants 189
6.3.2 Solar tower plants 193
6.3.3 Dish/Stirling systems 195
6.3.4 Economics and outlook 196
CHAPTER 7: Solar heating of open-air swimming pools 197
7.1 Introduction 197
7.2 Components 197
7.2.1 Absorbers 197
7.2.2 Piping and header pipes 201
7.2.3 Materials 202
CONTENTS vii
A01_PAI_Solar Thermal Systems_Prelims:therimpr.qxd 31/03/2010 16:46 Page vii
7.2.4 Pumps, heat exchangers and other components 202
7.2.5 Controllers 204
7.2.6 Covering of the swimming pool 206
7.3 Systems 206
7.3.1 Solar private open-air pool heating 206
7.3.2 Solar heating of public open-air swimming pools 208
7.3.3 Combined solar domestic water heating, open-air pool heating
and room heating support 210
7.4 Planning and dimensioning 211
7.4.1 Fundamental considerations 211
7.4.2 Approximation formulae for establishing absorber surface area,
volumetric flow and pressure loss 211
7.4.3 Computer-aided system dimensioning 214
7.5 Installation 214
7.5.1 Absorbers 214
7.5.2 Pipeline installation 217
7.6 Operation and maintenance 219
7.7 Costs and yields 219
7.8 Examples 220
7.8.1 Solar heating of a private swimming pool 220
7.8.2 Solar heating of a municipal open-air pool complex 220
CHAPTER 8: Solar air systems 223
8.1 Introduction 223
8.2 Components 224
8.2.1 Collector types 224
8.2.2 Fans, blowers 229
8.2.3 Piping 230
8.2.4 Heat exchangers and heat recovery units (air/water), recovery-
solar-box 230
8.2.5 Control 232
8.3 Systems 234
8.3.1 Central systems, decentralized systems and hybrid systems 234
8.3.2 Further terms of ventilation technology 234
8.3.3 Air collector systems in housing construction 235
8.3.4 Solar drying 239
8.3.5 Factories, halls and office buildings 240
8.4 Planning and dimensioning 242
8.4.1 Fundamental considerations 242
8.4.2 Calculation of required flow rate, required collector surface
area and connections of collectors 243
8.4.3 Calculation of fan power 244
8.4.4 Dimensioning of an air-to-water heat exchanger 244
8.4.5 Computer-assisted system sizing 245
8.5 Installation 246
8.5.1 Collector installation 246
8.5.2 Installation of pipelines 248
8.5.3 Positioning of the fan 248
8.6 Costs and yields 248
8.7 Examples 249
8.7.1 Domestic building, Potsdam, Germany 249
8.7.2 Solarwall on General Motors building in Ontario 250
viii PLANNING AND INSTALLING SOLAR THERMAL SYSTEMS A guide for installers, architects and engineers
A01_PAI_Solar Thermal Systems_Prelims:therimpr.qxd 31/03/2010 16:46 Page viii
CHAPTER 9: Solar cooling 253
9.1 Introduction 253
9.2 Theoretical bases 255
9.2.1 Overview of thermally driven cooling processes 255
9.2.2 Absorption cooling 255
9.2.3 Adsorption cooling 256
9.2.4 Desiccant cooling system 257
9.3 Integrated planning of solar cooling/air-conditioning systems 259
9.4 System technology 262
9.4.1 Autonomous solar-powered systems versus solar-assisted systems 262
9.4.2 Which collector technology for which cooling technology? 263
9.4.3 Circuit variants 264
9.5 System design 268
9.5.1 General procedure when designing systems 269
9.5.2 System design using empirical values 270
9.5.3 System design according to the peak load 270
9.5.4 Design of autonomous solar-powered systems 271
9.5.5 System design according to primary energy saving 271
9.6 More information 273
CHAPTER 10: Electronic media and software within the area
of solar thermal energy 275
10.1 Simulation programs for solar thermal systems 275
10.1.1 Utilization and possibilities of simulation programs 275
10.1.2 Market overview, organization and selection of simulation programs 276
10.1.3 Brief description of simulation programs 277
10.1.4 Evaluation of simulation results 289
10.1.5 Supplementary programs and data sources 289
10.1.6 Tools and utility programs 292
10.2 Materials from manufacturers 294
10.2.1 CD-ROMs, documentation, product catalogues 294
10.2.2 Simulation programs from manufacturers 294
10.3 Internet 294
10.3.1 Internet portals on the topic of solar energy 294
10.3.2 Manufacturer websites 294
10.3.3 Internet-based simulation 294
CHAPTER 11: Marketing and promotion 295
11.1 The fundamentals of solar marketing 295
11.1.1 Customer orientation: the central theme 295
11.1.2 The iceberg principle 295
11.1.3 The ‘pull’ concept 296
11.2 More success through systematic marketing 296
11.2.1 In the beginning is the benefit 296
11.2.2 The four pillars of the marketing concept 297
11.2.3 The range of marketing options 301
11.2.4 To the goal in six steps 311
11.3 The Soltherm Europe Initiative: European network of solar
thermal marketing campaigns 315
11.3.1 Publications 315
11.3.2 Partnership 316
11.3.3 Campaigns and market activities 316
11.3.4 Co-operation 317
CONTENTS ix
A01_PAI_Solar Thermal Systems_Prelims:therimpr.qxd 31/03/2010 16:46 Page ix
11.4 A good sales discussion can be enjoyable 317
11.4.1 What does ‘successful selling’ mean? 317
11.4.2 Build a bridge 318
11.4.3 Establish need 320
11.4.4 Offer a solution 321
11.4.5 Achieve a result 322
11.5 Subsidies 324
11.5.1 General information on financial support 324
11.5.2 Sources of information in the UK 325
11.5.3 Sources of information in the USA 326
11.5.4 Sources of information in Canada 327
11.5.5 EU sources 328
APPENDIX A: Glossary 329
APPENDIX B: Relevant UK solar regulations and technical
standards 335
B.1 General construction regulations 335
B.2 General construction standards 335
B.3 Solar standards 335
B.4 Roof standards 335
B.4.1 Acronyms for roof standards 336
B.5 Working on site, height and lifting regulations 336
APPENDIX C: Nomenclature 337
C.1 Radiation 337
C.2 Heat 337
C.3 Thermal losses 337
C.4 Temperature 337
C.5 Efficiency 337
C.6 Pressure 338
C.7 Material-specific variables 338
C.8 Volume, volumetric flow rate and flow speed 338
C.9 Angles 338
C.10 Surfaces and lengths 338
C.11 System variables 339
C.12 Financing 339
C.13 Constants 339
References and further information 341
Index 343
x PLANNING AND INSTALLING SOLAR THERMAL SYSTEMS A guide for installers, architects and engineers
A01_PAI_Solar Thermal Systems_Prelims:therimpr.qxd 31/03/2010 16:46 Page x
Foreword
The market for solar thermal systems is growing rapidly. Building owners, planning
engineers, architects, fitters and roofers are increasingly being confronted with solar
thermal technologies. Large amounts of additional new know-how are being asked for,
in particular about the state-of-the-art technology and the actual market situation, and
this requires services in consultancy, planning and design, economics and marketing.
This guidebook will complement the services described above and support the
decision-making process in offering up-to-date information on the latest technical
developments based on best-practice experience. Finally, this guide should work as an
aid for high-quality planning and careful system installation.
Highlights of the guide include the following:
■ Detailed installation instructions for the large variety of on-site situations.
■ Coverage of large solar thermal systems, including solar district heating networks.
■ An overview of simulation software.
■ Coverage of subjects such as solar swimming pool heating, solar air heating and
solar cooling.
■ A discussion of practical approaches for successful solar marketing.
■ Results of market research giving an overview of the suppliers of solar thermal
systems.
xi
A01_PAI_Solar Thermal Systems_Prelims:therimpr.qxd 31/03/2010 16:46 Page xi
A01_PAI_Solar Thermal Systems_Prelims:therimpr.qxd 31/03/2010 16:46 Page xii
1.1 Solar radiation
1.1.1 Solar energy
The most important supplier of energy for the earth is the sun. The whole of life
depends on the sun’s energy. It is the starting point for the chemical and biological
processes on our planet. At the same time it is the most environmentally friendly form
of all energies, it can be used in many ways, and it is suitable for all social systems.
In the core of the sun a fusion process takes place in which pairs of hydrogen
nuclei are fused into helium nuclei. The energy thus released is radiated into space in
the form of electromagnetic radiation. As the sun is 148 million km from the earth, it
radiates only a tiny fraction of its energy to the earth. In spite of this, the sun offers
more energy in four hours than the human race uses in a whole year.
The age of the sun is estimated by astrophysicists to be about 5 billion years. With a
total life expectation of 10 billion years the sun will be available as an energy source for
another 5 billion years. Hence from our human perspective the sun offers an unlimited
life.
1.1.2 Astronomical and meteorological bases
On the outer edge of the earth’s atmosphere the irradiated power of the sun is
virtually constant. This irradiated power or radiation intensity falling on an area of
one square metre is described as the solar constant. This constant is subject to small
variations influenced both by changes in the sun’s activity (sunspots) and by
differences in the distance between the earth and the sun. These irregularities are
mostly found in the ultraviolet range; they are less than 5%, and hence not significant
in application of the solar constant for solar technology. The average value of the solar
constant is given as I
0
= 1.367 W/m
2
(watts per square metre).
Even based on the astronomical facts alone, the amount of solar energy available
on the earth is very variable. It depends not only on the geographical latitude, but also
on the time of day and year at a given location. Because of the inclination of the
1
Solar radiation and arguments
for its use
1
Figure 1.1.
The sun: basis of all life on earth
M01_PAI_Solar Thermal Systems_Ch01:ther01.qxd 31/03/2010 12:04 Page 1
earth’s axis, the days in summer are longer than those in winter, and the sun reaches
higher solar altitudes in the summer than in the winter period (Figure 1.2).
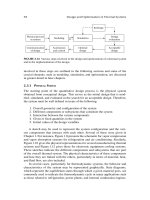
Figure 1.3 shows the sequence over a day of the irradiation in London on a
horizontal receiving surface of 1 m
2
(10.76 ft
2
) for four selected cloudless days over
the year. It is clear from the graph that the supply of solar radiation, even without the
influence of the weather or clouds, varies by a factor of about ten between summer
and winter in London. At lower latitudes this effect decreases in strength, but at
higher latitudes it can be even more pronounced. In the southern hemisphere the
winter has the highest irradiations, as shown in Figure 1.4, which shows the sequence
over a day of the irradiation in Sydney on a horizontal receiving surface of 1 m
2
on
three average days over the year.
Even when the sky is clear and cloudless part of the sun’s radiation comes from
other directions and not just directly from the sun. This proportion of the radiation,
which reaches the eye of the observer through the scattering of air molecules and dust
particles, is known as diffuse radiation, G
dif
. Part of this is also due to radiation
reflected at the earth’s surface. The radiation from the sun that meets the earth
without any change in direction is called direct radiation, G
dir
. The sum of direct and
diffuse radiation is known as global solar irradiance, G
G
(Figure 1.5).
G
G
= G
dir
+ G
dif
Unless nothing else is given, this always refers to the irradiation onto a horizontal
receiving surface.
1
2 PLANNING AND INSTALLING SOLAR THERMAL SYSTEMS A guide for installers, architects and engineers
IRRADIATED POWER, IRRADIANCE, HEAT QUANTITY
When we say that the sun has an irradiance,
G
, of for example 1000 W/m
2
, what is meant here is the
capability of radiating a given irradiated power, φ (1000 W), onto a receiving surface of 1 m
2
(10.76 ft
2
).
The watt is the unit in which power can be measured. If this power is referred, as in this case, to a unit
area, then it is called the
irradiance
.
1 kW (kilowatt) = 10
3
W (1000 watts)
1 MW (megawatt) = 10
6
W (1 million watts) = 10
3
kW
1 GW (gigawatt) = 10
9
W (1 thousand million watts) = 10
6
kW
1 TW (terawatt) = 10
12
W (1 million million watts) = 10
9
kW
When the sun shines with this power of 1000 W for 1 hour it has performed 1 kilowatt-hour of work (1
kWh) (Work = Power × Time).
If this energy were converted completely into heat, a heat quantity of 1 kWh would be produced.
Irradiated power, φ (W)
Irradiance,
G
(W/m
2
)
Heat quantity,
Q
(Wh, kWh)
Figure 1.2.
The sun’s path at different times of the
year at central European latitude
(London, Berlin)
M01_PAI_Solar Thermal Systems_Ch01:ther01.qxd 31/03/2010 12:04 Page 2
SOLAR RADIATION AND ARGUMENTS FOR ITS USE 3
Figure 1.4.
Irradiation on three different days in
Sydney, Australia
Figure 1.5.
Global solar irradiance and its
components
Figure 1.3.
Daily courses and daily totals for
irradiation in London
M01_PAI_Solar Thermal Systems_Ch01:ther01.qxd 31/03/2010 12:04 Page 3
When the sun is vertically above a location the sunlight takes the shortest path
through the atmosphere. However, if the sun is at a lower angle then the path through
the atmosphere is longer. This causes increased absorption and scattering of the solar
radiation and hence a lower radiation intensity. The air mass factor (AM) is a measure
of the length of the path of the sunlight through the earth’s atmosphere in terms of
one atmosphere thickness. Using this definition, with the sun in the vertical position
(elevation angle, γ
S
= 90°), AM = 1 (AM = 1/sin γ
S
).
Figure 1.6 shows the respective highest levels of the sun on certain selected days in
London and Berlin. The maximum elevation angle of the sun was achieved on 21 June
with γ
S
= 60.8°, and corresponded to an air mass of 1.15. On 22 December the
maximum elevation angle of the sun was γ
S
= 14.1°, corresponding to an air mass of 4.
At lower latitudes, all elevation angles will increase: for example, at a latitude of 32°
(north or south), the highest elevation angle will be 80.8° and the lowest angle will be
34.1°.
The sun’s radiation in space, without the influence of the earth’s atmosphere, is
described as spectrum AM 0. As it passes through the earth’s atmosphere, the
radiation intensity is reduced by:
■ reflection caused by the atmosphere
■ absorption by molecules in the atmosphere (O
3
, H
2
O, O
2
, CO
2
)
■ Rayleigh scattering (scattering by the air molecules)
■ Mie scattering (scattering by dust particles and contamination in the air).
See Figure 1.7.
Table 1.1 shows the dependence of the irradiation on the elevation angle, γ
S.
Absorption and scattering increase when the sun’s elevation is lower. Scattering by
dust particles in the air (Mie scattering) is heavily dependent on the location. It is at
its greatest in industrial areas.
γ
S
AM
Absorption (%) Rayleigh scattering (%) Mie scattering (%) Total attenuation (%)
90° 1.00 8.7 9.4 0–25.6 17.3–38.5
60° 1.15 9.2 10.5 0.7–25.6 19.4–42.8
30° 2.00 11.2 16.3 4.1–4.9 28.8–59.1
10° 5.76 16.2 31.9 15.4–74.3 51.8–85.4
5° 11.5 19.5 42.5 24.6–86.5 65.1–93.8
After the general astronomical conditions, the cloud cover or state of the sky is the
second decisive factor that has an effect on the supply of solar radiation: both the
irradiated power and the proportions of direct and diffuse radiation vary greatly
according to the amount of cloud (Figure 1.8).
4 PLANNING AND INSTALLING SOLAR THERMAL SYSTEMS A guide for installers, architects and engineers
Figure 1.6.
Sun’s level at midday within the course
of a year in London and Berlin (latitude:
52°N)
Table 1.1.
Effect of elevation angle on attenuation of
irradiation
M01_PAI_Solar Thermal Systems_Ch01:ther01.qxd 31/03/2010 12:04 Page 4
Over many years the average proportion of diffuse to global solar irradiance in central
Europe has been found to be between 50% and 60%. In sunnier climates the fraction
of diffuse radiation is lower; in the winter months this proportion is higher. See
Figures 1.9a–c.
2
The average annual global solar irradiance is an important value for designing a solar
plant. It is significantly higher at lower than at higher latitudes, but for climatological
reasons severe regional differences can arise. The maps in Figure 1.10 give an
indication of the solar irradiation in different regions. Table 1.2 gives an overview of
the monthly solar irradiation in a number of cities around the world (measured in
kWh/m
2
per day on a horizontal surface). Over the course of a year global solar
irradiance is subject to significant daily variations, especially in climates where
cloudiness occurs regularly.
In addition to global solar irradiance, the sunshine duration is sometimes given:
that is, the number of hours each year for which the sun shines. In the United
Kingdom this value varies between 1300 and 1900 hours per year. However, the
radiation is a far more reliable figure to use when designing or installing solar energy
systems.
SOLAR RADIATION AND ARGUMENTS FOR ITS USE 5
Figure 1.7.
Sun spectrum
AM
0 in space and
AM
1.5
on the earth with a sun elevation of 41.8°
Figure 1.8.
Global solar irradiance and its
components with different sky conditions
M01_PAI_Solar Thermal Systems_Ch01:ther01.qxd 31/03/2010 12:04 Page 5
6 PLANNING AND INSTALLING SOLAR THERMAL SYSTEMS A guide for installers, architects and engineers
Figure 1.9b.
Sydney, Australia
Figure 1.9a.
Berlin, Germany
Figure 1.9c.
Miami, USA
Table 1.2.
Solar irradiation (kWh/m
2
per day)
around the world
City Jan Feb Mar Apr May Jun Jul Aug Sep Oct Nov Dec
Birmingham, UK 0.65 1.18 2.00 3.47 4.35 4.53 4.42 3.87 2.67 1.48 0.83 0.45
Brisbane, AUS 6.35 5.71 4.81 3.70 2.90 2.43 2.90 3.61 4.93 5.45 6.33 6.32
Chicago, USA 1.84 2.64 3.52 4.57 5.71 6.33 6.13 5.42 4.23 3.03 1.83 1.45
Dublin, IRL 0.65 1.18 2.26 3.60 4.65 4.77 4.77 3.68 2.77 1.58 0.77 0.45
Glasgow, UK 0.45 1.04 1.94 3.40 4.48 4.70 4.35 3.48 2.33 1.26 0.60 0.32
Houston, USA 2.65 3.43 4.23 5.03 5.61 6.03 5.94 5.61 4.87 4.19 3.07 2.48
Johannesburg, SA 6.94 6.61 5.90 4.80 4.35 3.97 4.26 5.10 6.13 6.45 6.57 7.03
London, UK 0.65 1.21 2.26 3.43 4.45 4.87 4.58 4.00 2.93 1.68 0.87 0.48
Los Angeles, USA 2.84 3.64 4.77 6.07 6.45 6.67 7.29 6.71 5.37 4.16 3.13 2.61
Melbourne, AUS 7.13 6.54 4.94 3.20 2.13 1.93 2.00 2.71 3.87 5.26 6.10 6.68
New York, USA 1.87 2.71 3.74 4.73 5.68 6.00 5.84 5.39 4.33 3.19 1.87 1.48
Philadelphia, USA 1.94 2.75 3.81 4.80 5.55 6.10 5.94 5.42 4.37 3.23 2.13 1.68
Phoenix, USA 3.29 4.36 5.61 7.23 8.00 8.17 7.39 6.87 5.97 4.84 3.57 2.97
Sydney, AUS 6.03 5.54 4.23 3.07 2.61 2.33 2.55 3.55 4.63 5.87 6.50 6.13
Toronto, CAN 1.58 2.54 3.55 4.63 5.77 6.30 6.29 5.45 4.03 2.68 1.37 1.16
Vancouver, CAN 0.84 1.75 3.00 4.27 6.03 6.50 6.52 5.42 3.80 2.06 1.03 0.65
Figure 1.9. Monthly sum of global solar
irradiance (diffuse and direct)
M01_PAI_Solar Thermal Systems_Ch01:ther01.qxd 31/03/2010 12:04 Page 6
SOLAR RADIATION AND ARGUMENTS FOR ITS USE 7
Figure 1.10.
Total annual global radiation (on
horizontal surface)
Figure 1.10a.
Europe
Figure 1.10b.
USA
Figure 1.10c.
The world
M01_PAI_Solar Thermal Systems_Ch01:ther01.qxd 31/03/2010 12:04 Page 7
MEASURING SOLAR RADIATION
Devices that measure the global solar irradiance on a horizontal surface are called
pyranometers
(Figure
1.11). If these devices are screened from the sun’s direct rays by a fixed ring that covers the whole path
of the sun in the sky, then the device measures only the diffused radiation. The radiation receiver is
seated beneath a spherical glass cover and consists of a star-shaped arrangement of black and white
thermo-elements. These elements generate thermo-electromotive forces, depending on their
temperature, which can be measured. Pyranometers are relative measuring instruments that have to be
calibrated. Other global solar irradiance measuring devices that are available on the market and are
cheaper than pyranometers possess a
solar cell
as a receiver, as in the MacSolar (Figure 1.12), for
example.
The simplest and most commonly used device for measuring the sunshine duration is the
Campbell–Stokes sunshine recorder (Figure 1.13). This consists of a solid glass sphere, which generates
a focal point on the side that is turned away from the sun and which is always at the same distance. A
correspondingly curved flameproof paper strip is placed around the sphere. A track is burned on the
paper strip. When clouds cover the sun, the burnt track is interrupted.
1.1.3 Influence of orientation and tilt angle
The variables or figures that have been given so far referred to a horizontal receiving
surface, such as a flat roof. Because the angle of incidence of the sun varies over the
course of the year, the maximum radiation yield can be obtained only if the receiving
surface is inclined at an angle to the horizontal. The optimum angle of inclination is
larger in the low-radiation months than in the summer because of the low elevation of
the sun.
8 PLANNING AND INSTALLING SOLAR THERMAL SYSTEMS A guide for installers, architects and engineers
Figure 1.11.
Pyranometer made by Kipp & Zonen
Figure 1.12 (left).
MacSolar
Figure 1.13 (right).
Campbell–Stokes sunshine recorder
M01_PAI_Solar Thermal Systems_Ch01:ther01.qxd 31/03/2010 12:04 Page 8
In solar technology the angle descriptions listed in Table 1.3, and shown in Figure
1.14, are normally used. However, note that sometimes in architecture and building
the following values are used as angle descriptions for the solar azimuth: North = 0°,
East = 90°, South = 180°, West = 270°.
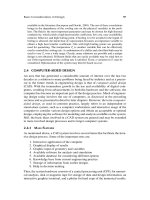
What about the influence of roof alignment and inclination on the insolation
(incoming solar radiation)? Figure 1.15 shows the values measured in central Europe
(Berlin) for the calculated average annual totals of global solar irradiance for
differently oriented surfaces. Lines of equal radiation totals are shown in kWh/m
2
per
year. On the horizontal axis the alignment can be read off and on the vertical axis the
angle of inclination can be seen.
SOLAR RADIATION AND ARGUMENTS FOR ITS USE 9
Sun’s height ␥
s
Horizon = 0° Zenith = 90°
Solar azimuth ␣
s
South = 0° East = –90° West = +90°
Surface  Horizontal = 0° Vertical = 90°
inclination
Surface azimuth ␣ South = 0° East = –90° West = +90°
Table 1.3.
Angle descriptions in solar technology
Figure 1.14.
Angle descriptions in solar technology
(northern hemisphere)
Azimuth angle in
Angle of incidence
Azimuth angle in
Incidence angle in
Azimuth angle in
Incidence angle in
Figure 1.15.
Annual total global solar irradiance for
differently oriented receiving surfaces in
(a) Berlin, (b) Vienna and (c) Bern
(a)
(b)
(c)
M01_PAI_Solar Thermal Systems_Ch01:ther01.qxd 31/03/2010 12:04 Page 9
According to the annual average, optimum irradiance occurs with a southern
alignment (α = 0°) and an inclination of β = 30°. The graph also shows that a deviation
from the optimum alignment can be tolerated over wide ranges, as no significant
losses of radiation are involved. Roughly speaking, for central European regions
(latitudes of about 50°N) any collector angle between 30° and 60° in combination with
an orientation between south-east and south-west will give almost optimal irradiance.
A general, worldwide rule of thumb is that a solar collector should roughly face
the Equator and the optimal tilt angle should be close to 0.7 times the latitude, but
always at least 10° or the minimum tilt angle specified for the solar collector (many
solar collectors require a minimum tilt angle of 15°). For instance, for a latitude of
40°S, the collector tilt angle should be about 30° facing north.
However, deviations from that optimum will in general give only a slight reduction
of the irradiation. The optimum angle of inclination for the winter months (October to
March) is 50° but, in general, orientations between south-east and south-west and
inclination angles between 30° and 60° will lead to a loss of solar radiation of less than
15% compared with the optimum angles.
1.1.4 Collection of dust, and need for cleaning
Whether dust accumulation will take place to such a degree that the solar collector’s
output would be significantly reduced is entirely dependent on the climate. In central
Europe there is enough rain to keep the collector clean. Measurements show that, in
these climates, the performance reduction due to dust on the collectors will be limited
to 2% or less. However, in tropical and dusty climates this can be very different, and
regular cleaning (once per month or more frequently) is needed to maintain the
collector’s output. Some solar water heating systems in tropical countries are even
equipped with a sprinkling system to make regular cleaning easier.
SHADING
Shading reduces the yield of a solar thermal system. To take account of shading of the receiving surface
by the surroundings (houses, trees etc.), three methods can be used:
■
graphical method (indicative)
■ photographic method (indicative)
■ computer-aided method.
GRAPHICAL METHOD
This method requires a scale drawing of the layout of the surroundings, details of the height of each
object that could shade the potential collector position, and a
solar altitude diagram
for the latitude at
which the collector is to be located. First, the elevation and azimuth angles of the relevant objects must
be established, and then the shade silhouette must be plotted in the solar altitude diagram. If large areas
of shade arise in time periods with high radiation, then the expected radiation received must be reduced
correspondingly.
PHOTOGRAPHIC METHOD
In this method a camera with a ‘fish-eye’ lens is used in connection with special solar-geometrical
accessories to photograph the surrounding silhouette while blending in the solar altitude diagram of the
respective location. The results can then be read directly off the photograph.
COMPUTER-AIDED METHOD
Several simulation programs are provided with shade simulators (see for instance TRNSYS and Sundi in
Chapter 10). After determining the elevation and azimuth angles of important objects, the influence of
shade can be directly calculated within the scope of the system simulation. This method yields more
accurate results than the previous two methods.
Figure 1.16 shows an example of a solar altitude diagram with surrounding silhouette.
10 PLANNING AND INSTALLING SOLAR THERMAL SYSTEMS A guide for installers, architects and engineers
M01_PAI_Solar Thermal Systems_Ch01:ther01.qxd 31/03/2010 12:04 Page 10
1.2 The finiteness of energy resources
The available resources of fossil fuels (coal, oil, natural gas and uranium) are being
consumed at an ever-increasing rate to meet the growing energy requirement on our
planet. Because stocks are finite, this process will inevitably lead us into a cul-de-sac.
The key that leads us out of this dilemma is to save energy, to use energy rationally,
and to use renewable energy sources: sun, wind, water and biomass.
Figure 1.17 emphasizes the relationship between fossil fuel reserves, energy
requirement and the radiation supplied by the sun.
Each year the sun provides a multiple of the world energy consumption, and indeed
even a multiple of all the known fossil fuel reserves. Put into numbers, it is 1.5 × 10
18
kWh/a, or 1500 million billion kilowatt-hours per annum. This is more than 10,000
times the energy that the human race needs at present. Moreover, the radiation supply
from the sun carries a 5 billion-year guarantee.
SOLAR RADIATION AND ARGUMENTS FOR ITS USE 11
Figure 1.16.
Solar altitude diagram with example
silhouettes of objects (for latitude of
about 50°)
Figure 1.17.
The energy cube
World energy requirement
Wind
Coal
Oil
Natural gas
Uranium
Biomass
Geothermal heat
Ocean energy
Water
Inside cube:
Potential annual quantity of energy from river, thermal and
chemical sources
Outside cube:
Annual renewable energy
quantities
non-renewable energy reserves
Solar radiation
M01_PAI_Solar Thermal Systems_Ch01:ther01.qxd 31/03/2010 12:04 Page 11
THE FORECAST LIFETIME OF OIL AND NATURAL GAS RESERVES
OIL
The current estimate of secured oil reserves is between 118 and 180 billion tonnes: the latter figure
includes so-called
non-conventional
oil reserves (heavy oils, tar sand, oil shale, and oil deposits in deep
waters and polar regions). From this it is evident that even with the same oil extraction rate as in 1995 of
3.32 billion tonnes per year the oil reserves will be exhausted by about 2050 (Figure 1.18). However, it is
more realistic to assume that increased energy consumption will result in a faster rate of use of the
reserves.
NATURAL GAS
The figures for natural gas reserves vary from 131 to 153 trillion m
3
(4626 to 5403 trillion ft
2
). With a
steady annual extraction rate of 2.3 trillion m
3
(81.22 trillion ft
2
) (as in 1995) the reserves would be
exhausted after 57–65 years. But it is exactly in this area of gas consumption that the greatest annual
rate of increase is found, so that the reserves will very probably run out well before the year 2040.
Even more decisive for structural changes in the energy supply is the question of the point in time
when for geological, technical and economic reasons oil and gas production can no longer be increased,
but will tend only to reduce. The maximum worldwide extraction rate (the big rollover) is expected to be
reached during the second decade of the 21st century: that is, between 2010 and 2020 (Figure 1.19).
From then on we can expect to see significant price increases.
3
Based on experience, we know that in the area of technical innovations the changeover period will last
for several decades. This means that immediate action is required. Thermal solar technology uses the
unlimited supply offered by the sun and makes it possible for every solar plant operator to make an active
contribution to mitigating the increasing dangers connected with the shortage of resources.
12 PLANNING AND INSTALLING SOLAR THERMAL SYSTEMS A guide for installers, architects and engineers
Figure 1.18.
Reserves and forecast lifetime of oil and
natural gas
4
Figure 1.19.
The OPEC proportion constantly
increases from 27% today to over 60%
in the year 2020. In 2020 an under-
supply of liquid hydrocarbons of about
17% – or a quarter of today’s world oil
production – is expected.
5
M01_PAI_Solar Thermal Systems_Ch01:ther01.qxd 31/03/2010 12:04 Page 12