- Trang chủ >>
- Khoa Học Tự Nhiên >>
- Vật lý
advanced experimental methods for noise research in nanoscale electronic devices
Bạn đang xem bản rút gọn của tài liệu. Xem và tải ngay bản đầy đủ của tài liệu tại đây (4.13 MB, 370 trang )
Advanced Experimental Methods for Noise
Research in Nanoscale Electronic Devices
NATO Science Series
A Series presenting the results of scientific meetings supported under the NATO Science
Programme.
The Series is published by IOS Press, Amsterdam, and Kluwer Academic Publishers in conjunction
with the NATO Scientific Affairs Division
Sub-Series
I. Life and Behavioural Sciences IOS Press
II. Mathematics, Physics and Chemistry Kluwer Academic Publishers
III. Computer and Systems Science IOS Press
IV. Earth and Environmental Sciences Kluwer Academic Publishers
V. Science and Technology Policy IOS Press
The NATO Science Series continues the series of books published formerly as the NATO ASI Series.
The NATO Science Programme offers support for collaboration in civil science between scientists of
countries of the Euro-Atlantic Partnership Council. The types of scientific meeting generally supported
are “Advanced Study Institutes” and “Advanced Research Workshops”, although other types of
meeting are supported from time to time. The NATO Science Series collects together the results of
these meetings. The meetings are co-organized bij scientists from NATO countries and scientists from
NATO’s Partner countries – countries of the CIS and Central and Eastern Europe.
Advanced Study Institutes are high-level tutorial courses offering in-depth study of latest advances
in a field.
Advanced Research Workshops are expert meetings aimed at critical assessment of a field, and
identification of directions for future action.
As a consequence of the restructuring of the NATO Science Programme in 1999, the NATO Science
Series has been re-organised and there are currently Five Sub-series as noted above. Please consult
the following web sites for information on previous volumes published in the Series, as well as details of
earlier Sub-series.
http://www
.nato
.int/science
http://www
.wkap
.nl
http://www
.iospress
.nl
http://www
.wtv-books
.de/nato-pco
.htm
Series II: Mathematics, Physics and Chemistry – Vol. 151
Advanced Experimental Methods
for Noise Research in Nanoscale
Electronic Devices
edited by
Josef Sikula
Brno University of Technology,
Brno, Czech Republic
and
Michael Levinshtein
Ioffe Institute of Russian Academy of Sciences,
St. Petersburg, Russia
KLUWER ACADEMIC PUBLISHERS
NEW YORK, BOSTON, DORDRECHT, LONDON, MOSCOW
eBook ISBN: 1-4020-2170-4
Print ISBN: 1-4020-2169-0
©2005 Springer Science + Business Media, Inc.
Print ©2004 Kluwer Academic Publishers
All rights reserved
No part of this eBook may be reproduced or transmitted in any form or by any means, electronic,
mechanical, recording, or otherwise, without written consent from the Publisher
Created in the United States of America
Visit Springer's eBookstore at:
and the Springer Global Website Online at:
Dordrecht
V
CONTENTS
PREFACE IX
I. Noise Sources
1/f Noise Sources 3
F.N. Hooge
Noise Sources in GaN/AlGaN Quantum Wells and Devices 11
S. Rumyantsev
1/f Noise in Nanomaterials and Nanostructures: Old Questions
in a New Fashion 19
M. N. Mihaila
1/f Spectra as a Consequence of the Randomness of Variance 29
G. Härtler
Quantum Phase Locking, 1/f Noise and Entanglement 37
M. Planat and H.Rosu
Shot Noise in Mesoscopic Devices and Quantum Dot Networks 45
M. Macucci, P. Marconcini, G. Iannaccone, M. Gattobigio,
G. Basso and B. Pellegrini
Super-Poissonian Noise in Nanostructures 53
Ya. M. Blanter
Stochastic and Deterministic Models of Noise 61
J. Kumiþák
II. Noise in Nanoscale Devices
Noise in Optoelectronic Devices 71
R. Alabedra
Fluctuations of Optical and Electrical Parameters and Their
Correlation of Multiple-Quantum-Well INGAAS/INP Lasers 79
S. Pralgauskaitơ, V. Palenskis and J. Matukas
VI
Microwave Noise and Fast/Ultrafast Electronic Processes
in Nitride 2DEG Channels 89
A. Matulionis
Noise of High Temperature Superconducting Bolometers 97
I.A. Khrebtov
1/f Noise in MOSTs: Faster is Noisier 109
L.K.J. Vandamme
Experimental Assessment of Quantum Effects in the Low-
Frequency Noise and RTS of Deep Submicron MOSFETs 121
E. Simoen, A. Mercha and C. Claeys
Noise and Tunneling Through the 2.5 nm Gate Oxide
in SOI MOSFETs 129
N. Lukyanchikova, E. Simoen, A. Mercha and C. Claeys
Low Frequency Noise Studies of Si Nano-Crystal Effects
in MOS Transistors and Capacitors 137
S. Ferraton, L. Montès, I. Ionica, J. Zimmermann,
and J. A. Chroboczek
Noise Modelling in Low Dimensional Electronic Structures 145
L. Reggiani, V. Ya. Aleshkin and A. Reklaitis
Correlation Noise Measurements and Modeling of Nanoscale
MOSFETs 153
J. Lee and G. Bosman
Tunneling Effects and Low Frequency Noise of GaN/GaAlN
HFETs 161
M. Levinshtein, S. Rumyantsev and M. S. Shur
High Frequency Noise Sources Extraction in Nanometique
MOSFETs 169
F. Danneville, G. Pailloncy and G. Dambrine
Informative “Passport Data” of Surface Nano- and
Microstructures 177
S. F. Timashev, A. B. Solovieva and G. V. Vstovsky
VII
III. Noise Measurement Technique
Noise Measurement Techniques 189
L.K.J. Vandamme
Techniques for High-Sensitivity Measurements of Shot Noise
in Nanostructures 203
B.Pellegrini, G. Basso and M. Macucci
Correlation Spectrum Analyzer: Principles and Limits
in Noise Measurements 211
G. Ferrari and M. Sampietro
Measurement and Analysis Methods for Random
Telegraph Signals 219
Z. Çelik-Butler
RTS In Quantum Dots and MOSFETs: Experimental Set-Up
with Long-Time Stability and Magnetic Field Compensation 227
J. Sikula, J. Pavelka, M. Tacano, S. Hashiguchi and M. Toita
Some Considerations for the Construction of Low-Noise
Amplifiers in Very Low Frequency Region 237
J. Sikula, S. Hashiguchi, M. Ohki and M. Tacano
Measurements of Low Frequency Noise in Nano-Grained
RuO
2
+Glass Films Below 1 K 245
A. Kolek
Technique for Investigation of Non-Gaussian and Non-Stationary
Properties of LF Noise in Nanoscale Semiconductor Devices 253
A. Yakimov, A. Belyakov, S. Medvedev, A. Moryashin
and M. Perov
The Noise Background Suppression of Noise Measuring Set-Up 261
P. Hruska and K. Hajek
Accuracy of Noise Measurements for 1/f and GR Noise 271
I. SlaidiƼš
Radiofrequency and Microwave Noise Metrology 279
E. Rubiola and V. Giordano
VIII
Treatment of Noise Data in Laplace Plane 287
B. M. Grafov
Measurement of Noise Parameter Set in the Low Frequency
Range: Requirements and Instrumentation 293
L. Hasse
Techniques of Interference Reduction in Probe System
for Wafer Level Noise Measurements of Submicron
Semiconductor Devices 303
L. Spiralski, A. Szewczyk and L. Hasse
Hooge Mobility Fluctuations in n-InSb Magnetoresistors
as a Reference for Access Resistance LF−Noise Measurements
of SiGe Metamorphic HMOS FETs 311
S. Durov, O.A. Mironov, M. Myronov, T.E. Whall, V.T. Igumenov,
V.M. Konstantinov and V.V. Paramonov
Optimised Preamplifier for LF-Noise MOSFET Characterization 319
S. Durov and O.A. Mironov
Net of YBCO and LSMO Thermometers for Bolometric
Applications 327
B. Guillet, L Méchin, F. Yang, J.M. Routoure, G. Le Dem,
C. Gunther, D. Robbes and R.A. Chakalov
Diagnostics of GaAs Light Emitting Diode pn Junctions 337
P. Koktavy and B. Koktavy
New Tools for Fast and Sensitive Noise Measurements 345
J. Sikula, M. Tacano, S. Yokokura and S. Hashiguchi
Using a Novel, Computer Controlled Automatic System
for LF Noise Measurements under Point Probes 355
J.A. Chroboczek, S. Ferraton and G. Piantino
AUTHOR INDEX 363
SUBJECT INDEX
365
IX
PREFACE
The NATO Advanced Research Workshop “Advanced Experimental
Methods for Noise Research in Nanoscale Electronic Devices” was held in
Brno, the Czech Republic, from 14 to 16 August, 2003, being the first event
to be held in this country. The Workshop passed off before the
17
th
International Conference on Noise and Fluctuations – ICNF 2003 that
took place at the Charles University Conference Centre, Prague, Czech
Republic, from 18 to 22 August, 2003.
The Workshop provided a forum for discussion on recently developed
experimental methods for noise research in nanoscale electronic devices. It
brought together specialists in the area of transport and stochastic
phenomena in nanoscale physics, dealing with systems for future nanoscale
electronics. The approach was to create methods for experimental
observations of noise sources, their localization and their frequency
spectrum, voltage - current and thermal dependences. The present
knowledge of measurement methods for mesoscopic devices was
summarized, to identify directions for future research, related to downscaling
effects.
The directions for future research of fluctuation phenomena in quantum
dot and quantum wire devices were specified. Another approach was to
emphasize the fact, that nanoscale electronic devices will be the basic
components for electronics of the 21
st
century. From this point of view the
signal-to-noise ratio is a very important parameter for the device application.
Since the noise is also a quality and reliability indicator, experimental
methods will have a wide application in the future.
This ARW promoted and improved links between scientists from NATO
and Partner countries and helped also to strengthen the scientific
communities in the new NATO countries. The workshop linked the
theoretical assessment of the phenomenon of noise with a discussion of the
advanced experimental methods. Its main idea was to discuss new results in
nanoscale physics and initiate new joint research programmes.
The Workshop was international in scope and included authors from
Belgium, Czech Republic, France, German, Italy, Latvia, Lithuania, the
Netherlands, Poland, Portugal, Romania, Russia, Slovak Republic, Ukraine,
United Kingdom, the United States and Uzbekistan. This Book contains 41
papers providing reviews and recent advances related to noise research in
nanoscale electronic devices.
The organizers of the ARW gratefully acknowledge the financial support
by the NATO Scientific Committee, Brno University of Technology and
VS Technology Brno.
Brno, August 2003 Josef Sikula
I. NOISE SOURCES
3
J. Sikula and M. Levinshtein (eds.),
Advanced Experimental Methods for Noise Research in Nanoscale Electronic Devices (3 - 10)
©
2004 Kluwer Academic Publisher. Printed in the Netherlands.
1/f NOISE SOURCES
F.N. Hooge
Department of Electrical Engineering, Eindhoven University of Technology
5600 MB Eindhoven
The Netherlands
Abstract
1/f noise is a fluctuation in the bulk conductance of semiconductors and
metals. This noise could be a fluctuation in the number of the free electrons or
in their mobility. Many experimental studies on homogenous layers have
proved that the1/f noise is a fluctuation in the mobility. There is no theoretical
model of mobility 1/f noise. The McWhorter model for 1/f noise in MOSTs
simply adds generation-recombination spectra from surface states. According
to this model, estimates of the noise magnitude give unrealistic values. More
important, the McWhorter model is a model on number fluctuations, because
GR noise always is a fluctuation in number. There is no experimental proof of
number fluctuations in the 1/f noise of MOSTs.
Keywords:
noise sources, 1/f noise, fluctuation in the mobility, number fluctuations
1. Introduction
We present a review of the study of 1/f noise in homogenous layers of
metals and semiconductors. Homogenous layers are eminently suited to
study the basic properties of 1/f noise.
Although most work has been done on devices, we will not discuss them
because devices are much too complicated to reveal the unknown basic
properties of the noise sources. There is one exception, however, the MOST.
From the very beginning of noise research this noisy device has been studied
extensively.
At first sight, the McWhorter model explains the noise correctly as a
summation of generation-recombination from traps in the oxide layer.
Because of its simplicity the McWhorter model is still very popular.
First we will demonstrate that experiments on homogenous layers prove
that here the McWhorter model does not apply. The 1/f noise turns out to be
in the mobility and not in the number of the elections as the result from GR
4
noise. Whether the McWhorter model does apply to MOSTs, still is an open
question.
It is impossible to give a complete survey of all literature on 1/f noise.
We restrict ourselves to some important themes that lead to problems still
under discussion now. We refer to survey papers [1,2]. We apologize to the
original authors of important ideas, who have become invisible in this way.
On the other hand the reader should not think that everything presented here
was invented in Eindhoven.
2. The empirical relation
1/f noise is a fluctuation in the conductivity of metals and
semiconductors. The spectral power density is proportional to 1/f over a
wide range of frequencies. The noise can be measured with simple
equipment between 10
-2
Hz and 10
5
Hz. The slope of the spectrum is –(1,0
+
0,1). Spectra with (sometimes varying) slopes between –0,5 to –1,5 should
not be called 1/f spectra
The noise of homogenous layers can be expressed as
fN
R
S
R
α
=
2
(1)
where S
R
is the spectral power density of resistance, R the resistance of
the sample, f the frequency at which the noise is measured, N the total
number of free electrons, and
α
is an empirical, dimensionless constant with
values usually between 10
-6
and 10
-4
. There is no theory behind (1). The
relation normalizes the relative noise to 1 electron. The only assumption
behind (1) is that, whatever the electrons do, they do it independently. In
high-quality material, like epitaxial layers, the α values are in the range 10
-6
to 10
-4
. In damaged materials, mechanical damage or radiation damage, the
α values are much higher. This could explain why in the old investigations,
around 1970, α=2x10
-3
seemed a good average. At that time, samples were
sawn out of large single crystals.
For measurements on homogenous, ohmic samples one uses
fN
i
S
V
S
G
S
R
S
const
V
i
const
i
VGR
α
=
¸
¸
¹
·
¨
¨
©
§
=
¸
¸
¹
·
¨
¨
©
§
==
2222
(2)
If one wishes to study the interference of current, temperature doping
etc, then the 1/f noise has to be well above the thermal noise 4kTR. In order
to avoid heating of the sample, currents should be not too extreme, this sets a
limit to N; as a first indication: N<10
13
. This means that for a “good“ 1/f
noise metal samples should be smaller than (10
µ
m)
3
and semiconductor
5
samples (n around 10
17
cm
-3
) could be much larger up to (1 mm)
3
. The
reverse is also true: if one wishes to make samples free of 1/f noise, make
them larger than (10
µ
m)
3
in case of metals and (1 mm)
3
in case of
semiconductors.
2.1. Point contacts
Point contacts are notorious for their 1/f noise. A point contact may be
homogenous as far as the material is concerned; it is inhomogeneous in the
current density. We consider here a contact between two metal spheres. The
contact area is a circle with radius a (see Fig. 1).
Figure 1. Point contact. N
eff
= a
3
n
The spherical shells between the (approximately) equipotential planes
are homogenous. We apply (1) and (2) to shell with radius r and thickness
dr, and calculate R(r) and S
R
(r). Then we integrate from r = a to r = ∞, and
find an expression like (1). But instead of N we now find
naN
eff
3
= (3)
where n is the electron density. N
eff
is the effective number of electrons;
it is the number in the contact volume a
3
. The radius a of the contact area
cannot be measured, but we know the relation between a and R: R ∝ 1/a.
From this we calculate
3
32
R
fn
fnaR
S
R
αα
∝=
(4)
The dependence
32
/ RRS
R
∝ is experimentally found in noise
measurements in which the pressure on the contact is varied. We have
calculated the contact noise from (1) which holds for bulk 1/f noise. Normal
α
values are experimentally found. So contact noise is bulk 1/f noise.
6
2.2. Grainy layers
In grainy layers there are many point contacts between the grains.
Estimates of the number of contacts and their individual contribution to the
noise lead to a relation like (1) with N
eff
<< N
total
. This explains the high
noise of grainy layers. One finds extremely high values of
α
when using the
total number of electrons in the sample instead of the number in the contact
regions. Superconductors often are in the form of grainy layers. If
α
is
calculated from N
total
,
α
is found to be extremely high. Probably this has
nothing to do with superconductivity.
3. Mobility noise
n∆ or
µ
∆ ? So far, the empirical relation (1) has been used to describe
the conductivity fluctuations in homogenous samples, thin layers and point
contacts. The next step is to determine whether the conductivity fluctuates
because of fluctuations in the number of the electrons or in their mobility.
Number fluctuation was the obvious thing to assume; even today that is what
many people do without any discussion.
One cannot decide on
n∆ or
µ
∆ from measurement on
σ
∆ . One needs
an effect where
n and
µ
do not appear as factors in the product n x
µ
. Such
effects are the Hall effect, thermo e.m.f., hot electron effects, etc. [1,2]. If,
for instance, the average effect is proportional to
µ
ln
n
as in V
th
, the thermo
e.m.f., then we find (6) for the noise
nCV
th
ln
µ
=
(5)
n
n
nn
n
V
V
th
th
∆
+
∆
=
∆
+
∆
=
∆
ln
1
ln
ln
µ
µ
µ
µ
(6)
These voltage fluctuations are compared with resistance fluctuations in
the same structure.
n
n
R
R ∆
+
∆
=
∆
µ
µ
(7)
Mobility fluctuations:
R
R
V
V
th
th
∆
=
∆
(8)
Number fluctuations:
R
R
R
R
nV
V
th
th
∆
<
∆
=
∆
ln
1
(9)
7
A nice example is the Hall effect in GaAs [3].
The noise across the Hall contacts is measured in applied magnetic
fields, and compared to the noise across the same contacts without magnetic
field. The lines for
µ
∆ and n∆ in Fig. 2 follow from rigorous, complicated
calculations. The experimental points follow the
µ
∆
line, far away from the
n∆
line. Many more examples of such comparisons are given in the
literature. Sometimes there is not much difference between
µ
∆ and n∆
lines, but if there is, then n∆ is definitely excluded.
Figure 2. 1/f noise in Hall effect. Epitax n-type GaAs. T=78K [K]. Lines: theory. Points:
experimental results
3.1. Lattice scattering
The mobility is determined by scattering of the free electrons. Lattice
scattering by acoustic lattice vibrations is always present. Other scattering
mechanism might be presented: impurity scattering by charged or neutral
centres surface scattering against the crystal boundaries, electron scattering
by other electrons. For the study of 1/f noise, materials with two scattering
mechanism are of special interest. Let us consider a series of crystals of the
same semiconductors material with varying amounts of impurity scattering
together with the always present constant lattice scattering. The contribution
of the two mechanisms to the resulting mobility
µ
is given by Matthiessen’s
rule
implatt
µµµ
111
+=
(10)
The observed noise is plotted as
α
log
versus
µ
log .
8
The
µ
α
−
dependence experimentally found can only be explained by
assuming 1/f noise in the lattice scattering whereas the other mechanism is
noise free. From (10) follows
0
11
+
¸
¸
¹
·
¨
¨
©
§
∆
=
¸
¸
¹
·
¨
¨
©
§
∆
latt
latt
latt
µ
µ
µµ
µ
µ
(11)
latt
latt
α
µ
µ
α
2
¸
¸
¹
·
¨
¨
©
§
=
(12)
Fig. 3 shows the result for epitaxial n-type GaAs [4], proving that the 1/f
noise is in the lattice scattering only.
Figure. 3. α versus µ. Epitaxial n-type GaAs T=300K [4]
3.2. Scattered light
Measuring the noise in the intensity of scattered light provides an
independent way of proving that the intensity of acoustic lattice modes
varies with a 1/f spectrum. Electrons do not play any role in these
experiments. Musha [5] designed an experimental set-up in which laser light
was scattered in a quartz crystal. See Fig. 4. The spectrum of the scattered
light showed peeks left and right of the laser frequency at a distance of the
frequency of acoustic mode. The noise in the mode intensity is derived from
the correlated part of the noise in the output of the two detectors.
More studies of the optical noise have been performed, also by
measuring the transmission of very long glass fibers [6]. The conclusion
from this experiment is that the noise spectrum of lattice modes definitively
is 1/
f however; the intensities - related to α- are problematic.
9
Figure 4. 1/f noise in scattered light. [5]
4. The McWhorter model
The model is based on simple mathematical relations. A GR spectrum
corresponds to transitions between the conduction band and a trap with
relaxation time
τ
() ( )
22
2
1
4
τω
τ
τ
+
∆=
NS
(13)
If the different kinds of traps have statistical weights
()
τ
τ
ττ
d
c
dg = (14)
Then a 1/f spectrum results by summation of GR spectra
()() () ()
f
NcdrN
c
dSgS
1
4
1
4
2
22
2
00
⋅∆=
+
∆==
³³
∞∞
τω
τ
τ
τττ
(15)
Finding a physical model is reduced now to finding a trap distribution
with the required 1/IJ dependence McWhorter proposed a homogenous
distribution of traps in an oxide layer in the semiconductor. This model is
widely used for the noise in MOSTs. The electrons reach the traps by
tunnelling. Therefore, IJ depends exponentially on x, the distance from the
interface.
λ
ττ
x
e
0
= (16)
10
where
λ
is an effective penetrations depth. If the number of traps is T,
we find from (16)
τ
λ
ττ
dx
dT
d
dx
dx
dT
d
dT
==
(17)
The homogenous trap distribution (dT/dx = const.) gives the required
statistical weight
This model is simple and therefore, very attractive. However, several
assumptions have been made, which are usually passed over:
1. Equal values of
()
2
N∆ in each individual GR spectrum
2. Additivity of the GR spectra
3. GR noise is a
n∆ fluctuation
Ad 2. Under certain conditions for the numbers of the free and trapped
electrons additivity is allowed [7-9]. I shall discus this problem at the Prague
conference.
Ad 3. In principle, it could be true that the 1/f noise in MOSTs is of
nature different from the noise in homogenous samples, for which we proved
experimentally that the 1/f noise is mobility noise. Therefore, we need
experimental evidence, that in MOSTs the 1/f noise is a fluctuation in
number. Otherwise the McWhorter model is irrelevant.
References
[1] F.N.Hooge, T.G.M Kleinpenning and L.K.J. Vandamme, Rept.
Progres. Phys 44,479 (1981)
[2] F.N.Hooge, IEEE Trans El.Dev. 41, 1926 (1994)
[3] L.Ren and J.S.Liberis, Physica B 183,40 (1993)
[4] L.Ren and M.R.Leys, Physica B 172,319 (1991)
[5] T. Musha, G Borbély and M.Shoji, Phys. Rev. Lett 64, 2394 (1990)
[6] F.N.Hooge, Proc. 7
th
Vilnius Conf. on Fluctuation Phenomena in
Physical Systems Palanga 1994 Ed.V.Palenskis. Vilnius Univ. Press
1994. P61
[7] F.N.Hooge, Physica B311, 238 (2002)
[8] F.N.Hooge, Physica B (in Press)
[9] L.K.J.Vandamme and F.N.Hooge, Submitted to Physica B
11
J. Sikula and M. Levinshtein (eds.),
Advanced Experimental Methods for Noise Research in Nanoscale Electronic Devices (11 - 18)
©
2004 Kluwer Academic Publisher. Printed in the Netherlands.
NOISE SOURCES IN GaN/AlGaN QUANTUM
WELLS AND DEVICES
S. Rumyantsev
Rensselaer Polytechnic Institute and Ioffe Institute of Russian Academy of Science,
Room 9015, CII, Rensselaer Polytechnic Institute 110 8-th Street, Troy, New York 12180
USA
Abstract
We will examine possible sources of generation-recombination and 1/f noise
in GaN/AlGaN 2D structures, quantum wells, and devices including contacts,
bulk and quantum well itself and show that sources of g-r noise, and most
probably of 1/f noise in HFETs are located in GaN or AlGaN layers within
some distance from the 2D channel.
Keywords:
GaN, AlGaN, 1/f noise, generation-recombination noise, quantum well
1. Introduction
High electron sheet concentration in excess of 10
13
cm
-2
on the
GaN/AlGaN interface, high breakdown field and high electron peak velocity
make GaN/AlGaN 2D structures very attractive for high-temperature, high-
power, high frequency, and radiation-hard applications. We will discuss
results of the experimental and theoretical investigation of the low-frequency
noise (LFN) in GaN/GaAlN heterojunctions and examine possible sources of
noise, including contacts, surface and 2D channel itself.
2. Experimental details
The GaN/AlGaN heterostructures were grown by metalorganic
chemical vapor deposition (MOCVD) on a semi-insulating 4H-SiC substrate.
12
They consisted of a 50-nm-thick AlN buffer layer, 0.4-µm-thick undoped
GaN layer, followed by Al
0.2
Ga
0.8
N barrier layer. As in all our devices, we
added traces of indium and carbon to improve materials quality. Transistors
and Transmission Line Model (TLM) structures were fabricated on the same
wafer. The transistors had the source-drain spacing of 4-5
µ
m, the gate
length, L, of 1-1.5 µm, and a gate width, W, in the range of 50 -150 µm. The
LFN was measured in the common source configuration in the frequency
range from 1 Hz to 50 kHz.
3. Location of the noise sources
Many different noise sources in 2D structures might be important
including the contact noise, channel noise, surface noise and contribution of
the gate leakage current in HFETs (see Review [1] for references).
To evaluate the contribution of the gate leakage current, we measured
the gate current fluctuations directly. The appropriate analysis of the results
allowed us to calculate the contribution of gate current fluctuations to the
output noise. The correlation between the gate and drain current fluctuations
were measured and analyzed as well. We found that in the majority of
devices the gate current gives only small contribution to the low frequency
noise, if any.
To determine the contribution of the contact noise to the measured noise
spectra, the noise measurements were performed on the TLM structures.
Assuming that the contribution of the contact noise and of the noise from the
channel layer are not correlated and taking into account that the contact
resistance is much smaller than the channel resistance it easy to find the
dependence of noise on the distance L between the contact pads. In the
limiting case when the contact noise is dominant, the spectral noise density,
S
I
/I
2
, should be proportional to L
-2
. In the opposite limiting case, we have
S
I
/I
2
~ L
-1
. Since the experimental dependence was close to the 1/L law, we
conclude that contacts do not contribute much to the overall noise.
To find the relative contributions to the overall noise from the channel
and the surface, we measured the gate voltage dependence of noise in
HFETs at a small drain voltage corresponding to the linear regime. We
found that depending on the surface preparation, passivation, etc., the open
surface might strongly contribute to LFN. For all measurements reported
here, we selected transistors with no contribution of the surface noise.
13
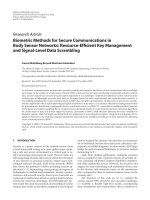
4. Generation-Recombination noise in GaN/AlGaN
heterostructures
The generation-recombination (GR) noise in GaN/AlGaN
heterostructures was reported for the first time in 1999 in Refs. [2,3]. The
temperature dependence of low-frequency noise revealed a contribution
from a local level with the activation energy, E
a
, of approximately 0.42 eV
[2].
10
0
10
1
10
2
10
3
10
4
10
-14
10
-13
10
-12
10
-11
f
0
1/f
T=20 K
T=30 K
T=20 K
T=30 K
T=8 K
S
Id
/I
d2
, 1/Hz
Frequency f, Hz
Figure1. Temperature dependence of noise for GaN/AlGaN heterostructure at low
temperatures. Temperature dependence of τ=1/2πf
0
yields activation energy
of E
a
=1-3 meV [4].
Since that time a wide spectrum of the local levels have been found
within the range of activation energy from 0.2 to 1.0 eV. The smallest
activation energy has been measured at low temperatures T<30K in Ref. [4].
Fig.1 shows the noise spectra at three temperatures for the sample exhibited
this GR noise. Temperature dependence of characteristic time
τ
=1/2
π
f
0
gives
activation energy of E
a
=1-3 meV.
Noise data for the purpose of noise spectroscopy are often presented in
the form of temperature dependence of noise at different frequencies f [5,6]
(Fig.2).
14
300 350 400 450 500 550
10
-14
10
-13
10
-12
3000 Hz
1500 Hz
800 Hz
400 Hz
200 Hz
100 Hz
S
MAX
T
MAX
S
I
/ I
2
(1/Hz)
Temperature (K)
Figure 2. Temperature dependence of low frequency noise in AlGaN/InGaN/GaN quantum
well. Arrhenius plot yields the activation energy of 1.6 eV [6].
In this case,
τ
is taken to be equal to 1/2
π
f, at the temperature T
max
, which
corresponds to the noise maximum. The slope of the dependence of ln( f )
versus 1/T
max
yields the activation energy E
a
.
Fig. 2 shows the temperatures dependence of noise for
GaN/InGaN/AlGaN quantum wells [6] with the largest activation energy of
1.6 eV ever been found in GaN based devices.
For two dimensional (2D) case, the expression for relative spectral noise
density S
I
/I
2
generated by the single trap in the 2D channel has the following
form:
()
()
22
0
2
1
14
ωτ
τ
+
−
=
FF
WnL
N
I
S
s
tsI
,(1)
where N
ts
is the trap sheet concentration, L
0
and W are the channel length and
width respectively, n
s
is the electron sheet concentration,
ω
= 2
π
f is the
circular frequency,
τ
=
τ
c
F is the time constant associated with return to
equilibrium of the occupation of the level, F is the Fermi - Dirac occupancy
function,
τ
c
is the capture time constant
Fs
c
vn
σ
τ
1
=
, (2)
15
where
mEv
FF
2= is the electron velocity on the Fermi level.
For the 2D degenerate electron gas (F ≈ 1), with the experimentally found
value of
τ
, the capture cross section is:
σ
τ
≅
1
nv
s
F
(3)
We found σ≈ 3×10
-18
cm
2
. This value of the capture cross section is too
small to be realistic. This result shows that for degenerate 2D gas the source
of low frequency generation-recombination noise, with any activation
energy, cannot be located directly in the 2D channel.
Another possible location of the traps responsible for generation
recombination noise is fully depleted barrier layer including AlGaN surface
from the gate side. The GR noise from the traps in the AlGaN layer can be
approximately described by Eq. (1), where N
ts
is replaced with N
t
d. Here N
t
is the volume concentration of traps and d is the thickness of the AlGaN. In
this case, the time constant
τ
is given by the Shockley-Hall-Read theory.
Assuming zero free carrier concentration within the depletion region and that
the level under consideration is located in the upper half of the forbidden
gap, the expression for
τ
can be written as [7]:
)/exp(
0
kTE
t
τ
τ
= (4)
where k is Boltzman constant, T is the temperature,
τ
o
= (
σ
n
v
n
N
c
)
-1
, N
c
is the
density of states in the conduction band.
Hence the slope of the plot of 1/kT
max
against lnf (Arrhenius plot) yields
the level position E
a
.
Once E
a
is known, the time constant
τ
ο
and electron capture cross
section can be found.
Our estimate yields quite reasonable value of capture section
σ
n
≈ (10
-12
- 10
-13
) cm
2
for all samples.
The trap concentration N
t
can be crudely estimated as follows. Assuming
that the main contribution to noise comes from the level with occupancy
close to 0.5, we find for the trap concentration:
d
WLnSf
N
s
t
0
2
maxmax
4
π
= (5)
We obtained N
t
≈5×10
16
cm
-3
for AlGaN/GaN 2D structures and
AlGaN/InGaN/GaN quantum wells. Since the doping level of AlGaN barier
layer is almost two orders of magnitude higher, this estimate also looks quite
reasonable.
Local trap might also locate in GaN layer close to the channel (and close
to the Femi level). In this case we have to assume that measured activation
16
energy fully belongs to the temperature dependence of the capture cross
section. The estimate of the of trap concentration in this case yields
N
t
≈5×10
12
cm
-3
.
Measurements of the LFN in GaN films showed that contribution of GR
noise is very weak. On the other hand, AlGaN films demonstrated
pronounced GR noise with activation energy close to those found in
AlGaN/GaN heterostructures. Therefore, we conclude that AlGaN is the
most probable source of the GR noise in GaN based 2D structures.
5. 1/f noise
The 1/f noise level in different semiconductor materials and structures is
usually characterized by the dimensionless Hooge parameter,
α
=(S
I
/I
2
)f.N,
where N is the total number of the carriers in the sample, f is the frequency,
S
1/f
= S
I
/I
2
is the relative spectral density of the 1/f noise.
In spite of the difference in the absolute values of
α
,
for different
samples and structures we found that concentration dependencies
α
(n
s
) are
identical for all samples. At low channel concentrations,
α
decreases with
the increase of n
s
as
α
~ 1/n
s
, reaches a minimum and then increases with a
further increase of n
s
(Fig.3). This kind of
α
~ 1/n
s
dependence was found
for both AlGaN/InGaN/GaN quantum wells and GaN/AlGaN
heterostructures.
10
11
10
12
10
13
10
-3
10
-2
10
-1
10
0
V
G
=0V
1/n
S
α
Ch
Sheet Carrier Density, n
S
(cm
-2
)
Figure 3. The dependence of Hooge parameter
α
on 2D sheet carrier concentration n
S
for AlGaN/InGaN/GaN quantum wells.
17
The dependence
α
~
1/n
s
indicates that the spectral density S
I
does not
depend on the channel concentration. Note that such situation is very typical
for Si MOSFETs, where the noise arises from the electron tunneling from
the semiconductor to traps in the oxide. Hence, the observed
α
~ 1/n
s
dependence might be linked to the electron tunneling from the 2D gas into
the tail states in GaN or AlGaN.
6. Conclusion
Experimental study of the 1/f noise in GaN/AlGaN 2D structures and
AlGaN/InGaN/GaN quantum wells showed that in the majority of devices
contacts, surface and gate leakage current do not contribute much to noise.
The AlGaN layer is the most probable source of the GR noise in
GaN/AlGaN 2D structures. Our estimates yielded a reasonable capture
cross-section and concentration of traps located in AlGaN, which might be
responsible for the noise.
The dependence of the 1/f noise on electron sheet concentration
indicates that the most probable mechanism of the noise is tunneling from
2D channel to the GaN or AlGaN layers.
References
[1] M. E. Levinshtein, A. A. Balandin, S. L. Rumyantsev, and M. S. Shur,
Low-frequency noise in GaN-based Field Effect Transistors in: "Noise
and Fluctuations Control in Electronic Devices", A. Balandin, ed.,
American Scientific Publishers (2002)
[2] S. Rumyantsev, M. E. Levinshtein, R. Gaska, M. S. Shur, A. Khan, J.
W. Yang, G. Simin, A. Ping and T. Adesida, Low 1/f noise in
AlGaN/GaN HEMTs on SiC substrates, Proc. of the Third
International Conference on Nitride Semiconductors (ICNS3),
Montpellier, France, July 1999, phys. stat. sol. (a),
176 (1999) 201.
[3] A. Balandin, S. Morozov, G. Wijeratne, S. J. Cai, R. Li, K. L. Wang,
and C. R. Viswanathan, Effect of channel doping on the low-
frequency noise in GaN/AlGaN heterostructure field-effect transistors
Appl. Phys. Lett.
75 (1999) 2064.