pei - gee peter ho - advances in image segmentation
Bạn đang xem bản rút gọn của tài liệu. Xem và tải ngay bản đầy đủ của tài liệu tại đây (16.1 MB, 126 trang )
SEGMENTATION
ADVANCES
IN IMAGE
Edited by Pei-Gee Peter Ho
ADVANCES IN IMAGE
SEGMENTATION
Edited by Pei-Gee Peter Ho
Advances in Image Segmentation
/>Edited by Pei-Gee Peter Ho
Contributors
Saïd Mahmoudi, Mohammed Benjelloun, Mohamed Amine Larhmam, Vallejos, Silvia Ojeda, Roberto Rodriguez,
Pradipta Kumar Nanda, Luciano Lulio
Published by InTech
Janeza Trdine 9, 51000 Rijeka, Croatia
Copyright © 2012 InTech
All chapters are Open Access distributed under the Creative Commons Attribution 3.0 license, which allows users to
download, copy and build upon published articles even for commercial purposes, as long as the author and publisher
are properly credited, which ensures maximum dissemination and a wider impact of our publications. After this work
has been published by InTech, authors have the right to republish it, in whole or part, in any publication of which they
are the author, and to make other personal use of the work. Any republication, referencing or personal use of the
work must explicitly identify the original source.
Notice
Statements and opinions expressed in the chapters are these of the individual contributors and not necessarily those
of the editors or publisher. No responsibility is accepted for the accuracy of information contained in the published
chapters. The publisher assumes no responsibility for any damage or injury to persons or property arising out of the
use of any materials, instructions, methods or ideas contained in the book.
Publishing Process Manager Martina Blecic
Technical Editor InTech DTP team
Cover InTech Design team
First published October, 2012
Printed in Croatia
A free online edition of this book is available at www.intechopen.com
Additional hard copies can be obtained from
Advances in Image Segmentation, Edited by Pei-Gee Peter Ho
p. cm.
ISBN 978-953-51-0817-7
Contents
Preface VII
Section 1 Advances in Image Segmentation 1
Chapter 1 Template Matching Approaches Applied
to Vertebra Detection 3
Mohammed Benjelloun, Saïd Mahmoudi and Mohamed Amine
Larhmam
Chapter 2 Image Segmentation and Time Series Clustering Based on
Spatial and Temporal ARMA Processes 25
Ronny Vallejos and Silvia Ojeda
Chapter 3 Image Segmentation Through an Iterative Algorithm of
the Mean Shift 49
Roberto Rodríguez Morales, Didier Domínguez, Esley Torres and
Juan H. Sossa
Chapter 4 Constrained Compound MRF Model with Bi-Level Line Field for
Color Image Segmentation 81
P. K. Nanda and Sucheta Panda
Chapter 5 Cognitive and Statistical Pattern Recognition Applied in Color
and Texture Segmentation for Natural Scenes 103
Luciano Cássio Lulio, Mário Luiz Tronco, Arthur José Vieira Porto,
Carlos Roberto Valêncio and Rogéria Cristiane Gratão de Souza
Preface
Generally speaking, image processing applications for computer vision consist of
enhancement, reconstruction, segmentation, recognition and communications. In the last
few years, image segmentation played an important role in image analysis.
The field of digital image segmentation is continually evolving. Most recently, the advanced
segmentation methods such as Template Matching, Spatial and Temporal ARMA Processes,
Mean Shift Iterative Algorithm, Constrained Compound Markov Random Field (CCMRF)
model and Statistical Pattern Recognition (SPR) methods form the core of a modernization
effort that resulted in the current text. In the medical world, it is interested to detect and
extract vertebra locations from X-ray images. The generalized Hough Transform to detect
vertebra positions and orientations is proposed. The spatial autoregressive moving average
(ARMA) processes have been extensively used in several applications in image and signal
processing. In particular, these models have been used for image segmentation. The Mean
shift (MSH) method is a robust technique which has been applied in many computer vision
tasks. The MSH procedure moves to a kernel-weighted average of the observations within a
smoothing window. This computation is repeated until convergence is obtained at a local
density mode. The density modes can be located without explicitly estimating. The
Constrained Markov Random Field (MRF) model has the unifying property of modeling
scene as well as texture images. The scheme is specifically meant to preserve weak edges
besides the well defined strong edges. By Statistical Pattern Recognition approach, the
cognitive and statistical classifiers were implemented in order to verify the estimated and
chosen regions on unstructured environments images.
Following our previous popular artificial intelligent book “Image Segmentation”, ISBN
978-953-307-228-9, published on April 19, 2011, this new edition of “Advanced Image
Segmentation” is but a reflection of the significant progress that has been made in the field
of image segmentation in just the past few years. The book presented chapters that highlight
frontier works in image information processing. I am pleased to have leaders in the field to
prepare and contribute their most current research and development work. Although no
attempt is made to cover every topic, these entire five special chapters shall give readers a
deep insight. All topics listed are equal important and significant.
Pei-Gee Peter Ho
DSP Algorithm and Software Design Group,
Naval Undersea Warfare Center
Newport, Rhode Island, USA
Chapter 1
Template Matching Approaches Applied to Vertebra
Detection
Mohammed Benjelloun, Saïd Mahmoudi and
Mohamed Amine Larhmam
Additional information is available at the end of the chapter
/>1. Introduction
In the medical world, the problems of back and spine are usually inseparable. They can take
various forms ranging from the low back pain to scoliosis and osteoporosis. Medical Imag‐
ing provides very useful information about the patient's condition, and the adopted treat‐
ment depends on the symptoms described and the interpretation of this information. This
information is generally analyzed visually and subjectively by a human expert. In this diffi‐
cult task, medical images processing presents an effective aid able to help medical staff. This
is nowhere clearer than in diagnostics and therapy in the medical world.
We are particularly interested to detect and extract vertebra locations from X-ray images.
Some works related to this field can be found in the literature. Actually, these contributions
are mainly interested in only 2 medical imagery modalities: Computed Tomography (CT)
and Magnetic Resonance (MR). A few works are dedicated to the conventional X-Ray radi‐
ography. However, this modality is the cheapest and fastest one to obtain spine images. In
addition, from the point of view of the patient, this procedure has the advantage to be more
safe and non-invasive. For these reasons, this review is widely used and remains essential
treatments and/or urgent diagnosis. Despite these valuable benefits, the interpretation of im‐
ages of this type remains a difficult task now. Their nature is the main cause. Indeed, in
practice, these images are characterized by a low contrast and it is not uncommon that some
parts of the image are partially hidden by other organs of the human body. As a result, the
vertebra edge is not always obvious to see or detect.
In the context of cervical spinal column analysis, the vertebra edges detection task is very
useful for further processing, like angular measures (between two consecutive vertebrae or
in the same vertebra in several images), vertebral mobility analysis and motion estimation.
However, automatically detecting vertebral bodies in X-Ray images is a very complex task,
especially because of the noise and the low contrast resulting in that kind of medical image‐
ry modality. The goal of this work is to provide some computer vision tools that enable to
measure vertebra movement and to determine the mobility of each vertebra compared to
others in the same image.
The main idea of the proposed work in this chapter is to locate vertebra positions in radio‐
graphs. This operation is an essential preliminary pre-processing step used to achieve full
automatic vertebra segmentation. The goal of the segmentation process is to exploit only the
useful information for image interpretation. The reader is lead to discover [1] for an over‐
view of the current segmentation methods applied to medical imagery. The vertebra seg‐
mentation has already been treated in various ways. The level set method is a numerical
technique used for the evolution of curves and surfaces in a discrete domain [2]. The advant‐
age is that the edge has not to be parameterized and the topology changes are automatically
taken into account. Some works related to the vertebrae are presented in [3]. The active con‐
tour algorithm deforms and moves a contour submitted to internal and external energies [4].
A special case, the Discrete Dynamic Contour Model [5] has been applied to the vertebra
segmentation in [6]. A survey on deformable models is done in [7]. Other methods exist and
without being exhaustive, let’s just mention the parametric methods [15], or the use boun‐
dary based segmentation [16] and also Watershed based segmentation approaches [17].
The difficulties resulting from the use of X-ray images force the segmentation methods to be
as robust as possible. In this chapter, we propose, in the first part, some methods that we
have already used for extracting vertebrae and the results obtained. The second part will fo‐
cus on a new method, using the Hough transform to detect vertebrae locations. Indeed, the
proposed method is based on the application of the Generalized Hough Transform in order
to detect vertebra positions and orientations. For this task, we propose first, to use a detec‐
tion method based on the Generalized Hough Transform and in addition, we propose a cost
function in order to eliminate the false positives shapes detected. This function is based on
vertebra positions and orientations on the image.
This chapter is organized as follow: In section 02 we present some of our previous works
composed of two category of method. The firsts are based on a preliminary region selection
process followed by a second segmentation step. We have proposed three segmentation ap‐
proach based on corner detection, polar signature and vertebral faces detection. The second
category of methods proposed in this chapter is based on the active shape model theory. In
section 03 we describe a new automatic vertebrae detection approach based on the General‐
ized Hough transform. In section 04 we conclude this chapter.
2. Previous work
In this part, we provide an overview of the segmentation approach methods that we have
already applied to vertebrae detection and segmentation. We proposed two kinds of seg‐
Advances in Image Segmentation4
mentation approaches. The first one were based a regions selection process allowing the de‐
tection of vertebra orientations and inter-vertebral angles and the second based of the active
shape model theory. These methods present semi-automatic computer based techniques.
2.1. Region selection
In this section, we propose a first pre-processing step which allows the creation of a polygo‐
nal region for each vertebra. This pre-treatment is achieved by a template matching ap‐
proach based on a mathematical representation of the inter-vertebral area. Indeed, each
region represents a specific geometrical model based on the geometry and the orientation of
the vertebra. We suggest a supervised process where the user has to click once at the center
of each vertebra to be analyzed. These clicks represent the starting points P
(
x
i
, y
i
)
for the
construction of vertebra regions [11]. After this, we compute the distance between every two
contiguous points
(
D
i,i+1
)
and the line L1, which connects these contiguous points, by a first
order polynomial, equation (1).
L
1
= f a, b; P
(
x
i
, y
i
)
, P
(
x
i+1
, y
i+1
)
(1)
The function L1 will be used as reference for a template displacement, Figure 1, by the func‐
tion T(x,y) defined in equation (2). This template function represents an inter-vertebral mod‐
el, which is calculated according to the shapes of the areas between vertebrae.
T
(
x, y
)
=
(
1 - e
-r x
i
2
)
withr =
k
D
i,i+1
(2)
With k = 0.1 an empirical value and xi the coordinate of the point (x, y) in the new reference
plane in each vertebra center. We use the L1 function and the inter-vertebral distances, to
compute the inter-vertebral angles (αiv) and to determine a division line for each inter-ver‐
tebral area. The goal of this proposed template matching process is to find the positions on
the image which are best correlated with the template function. So, for each vertebra, the
template function T
(
x, y
)
is first placed on the geometrical inter-vertebral central point
P
(
x
ic
, y
ic
)
, which represents the average position between each two contiguous click points:
P
(
x
i
, y
i
)
andP
(
x
i+1
, y
i+1
)
. The new reference plane -on each vertebra- is created with the
point P
(
x
ic
, y
ic
)
as center. The X axis of this plane is the line L1. The Y axis is therefore easily
created by tracing the line passing through P
(
x
ic
, y
ic
)
and orthogonal to L1. We notice that
the orientation angle of this second axis present the initial value of the orientation angle αiv.
To determine the points representing border areas, we displace the template function
T
(
x, y
)
equation (2), between every two reference points P
(
x
i
, y
i
)
and P
(
x
i+1
, y
i+1
)
, along the
line L1. For more details on this approach, the reader can consult this [8]. The results ob‐
tained by the process of vertebral regions selection are shown in Fig 2.
Template Matching Approaches Applied to Vertebra Detection
/>5
Figure 1. The template function T displacement.
Figure 2. Results obtained by the process of vertebral regions selection. (a) Original image reference with the click
points, (b) inter-vertebral points given by the template matching process, (c) boundary lines between vertebrae, (d)
vertebrae regions.
Advances in Image Segmentation6
2.1.1. Harris corner detector
After the creation of a polygonal area for each vertebra, we can apply locally a few ap‐
proaches to segmentation as shown in the following examples.
Figure 3. The different steps of the detection process using the region selection method combined to the Harris
corner detector.
Figure 4. Results obtained by using the region selection method combined to the Harris corner detector.
Figure 3 and figure 4 show the results obtained by using the region selection method combined
to the Harris corner detector [8] applied to X-ray image of the cervical spinal column. We no‐
tice that the process of region selection, Figure 3, gives very good results and permit to isolate
each vertebra separately in a polygonal area. On the other hand, the extraction of the anterior
face of the vertebra using the interest point detection process is given with high precision.
Template Matching Approaches Applied to Vertebra Detection
/>7
2.1.2. Polar signature
A second segmentation approach that we proposed to apply after the region selection proc‐
ess is based on a polar signature [8] representation associated to the polygonal region for
each vertebra described on section 2.1. We choose to use this approach in order to explore all
region points likely to be corresponding to vertebra contours.
For each vertebra we use as center of the polar coordinate system the click point initially
used for the region selection step. For the beginning direction, we chose the average direc‐
tion between the frontal line direction and the posterior line. We rotate the radial vector 360°
around the central points with a step parameter expressed in degrees. In order to determine
vertebra contours, we select the maximum value of the image gradient, Figure 5, for each
degree inside the research zone.
Figure 5. Polar signature applied to vertebra region.
Figure 6. Polynomial fitting applied after a polar signature.
In order to get a closed contour, we apply an edge closing method to the contours obtained,
a polynomial fitting to each face for each vertebra. Indeed, for a better approximation of ver‐
tebra contours, we use a second degree polynomial fitting [9, 10]. We achieve this 2D poly‐
nomial fitting by the least square method, Figure 6.
2.1.3. Vertebral Faces Detection
In this method, we proceed by detecting the four faces belonging to vertebrae contours. We
propose an individual characterization of each vertebra by a set of four faces, (anterior, pos‐
Advances in Image Segmentation8
terior, inferior and superior faces). We start with a process of region selection. The resulting
regions obtained are used to create a global polygonal area for each vertebra. Another stage
considered as a second pre-treatment step is the computation of the image gradient magni‐
tude on vertebrae regions. This process allows a first approximation of the areas belonging
to vertebrae contours, figure 7. To extract faces vertebrae contours, we propose a template
matching process based on a mathematical representation of vertebrae by a template func‐
tion. This function is defined according to the radial intensity distribution on each vertebra.
For more details see [12].
Figure 7. The template matching process for faces detection. (a) translation and, (b) rotation operation applied to the
template function.
2.2. Active shape model based segmentation:
In this section, we describe another method that we proposed for cervical vertebra segmen‐
tation in digitized X-ray images. This segmentation approach is based on Active Shape Mod‐
el method [12, 13,14] whose main advantage is that it uses a statistical model. This model is
created by training it with sample images on which the boundaries of the object of interest
are annotated by an expert. The specialist knowledge is very useful in this context. This
model represents the local statistics around each landmark. Our application allows the ma‐
nipulation of a vertebra model. We proposed an approach which consists on modelling all
the shapes of vertebrae by only one vertebra model. The results obtained are very promis‐
ing. Indeed, the multiple tests which we carried out on a large dataset composed of varied
images prove the effectiveness of the suggested approach. The ASM method is composed of
4 steps (figure8):
1. Learning: placing landmarks on the images in order to describe the vertebrae.
2. Model Design: aligning all the marked shapes for the creation of the model.
Template Matching Approaches Applied to Vertebra Detection
/>9
3. Initialization: the mean shape model is associated with the corners of the searched ver‐
tebrae. This step can be manual or semi-automatic.
4. Segmentation: each point of the mean shape evolves so that its contour fits the edge of
the vertebrae.
Figure 8. The steps of our framework using ASM.
3. Shape detection using Generalized Hough Transform
In this section, we propose a cervical vertebrae detection method using a modified template
matching approach based on the Generalized Hough Transform [18]. The Hough Transform is
an interesting technique used in image analysis to extract imperfect instances of a shape in im‐
ages by a voting procedure. The success of this method relies mainly on the quality of the pat‐
tern used. The detection process that we propose starts with the determination of the edges on
the radiography. We achieve this task by using the well-known Canny detector, [19]. After this
step, the detection algorithm selects among the edges which one look the most similar to the
vertebra shape by using the Generalized Hough Transform (GHT) accumulator.
For our experiments, we used 40 X-Ray radiographs coming from the NHANES II database.
These images were chosen randomly but they all are focused on the cervical vertebrae C3 to
C7. The first pre-processing step consists on a preliminary contour detection step. For this
task we used the canny filter detector. After applying the detection process using the GHT
method and the cost function proposed, all the vertebrae were detected perfectly. The seg‐
mentation results show that vertebra positions and edges are well detected by applying the
proposed segmentation approach using the Generalized Hough Transform and followed by
applying the proposed cost function.
3.1. Generalized Hough Transform
3.1.1. R-Table construction
The Generalized Hough transform (GHT) is a powerful pattern recognition technique wide‐
ly used in computer vision. It was initially developed to detect analytic curves (lines, circles,
Advances in Image Segmentation10
parabolas, etc.) from binary image and extended by D. H. Ballard [18] to extract arbitrary
shapes based on a template matching approach. This method is well known by its invari‐
ance to scale change, rotation and translation. The detection process of the GHT is presented
as two main parts:
The R-Table is a discrete lookup table made to represent the model shape. The construction
of this table is computed during a training phase based on the edge information as follow.
Given an arbitrary shape of a target object, figure 11, the first step is to determine a reference
pointc
→
=(c
x
, c
y
) in the object. The shape is defined in according to the distance and angle
from the boundary to the reference point. For each point of the boundary we compute the
orientation φ and the relative position r
→
=(r
x
, r
y
) from the reference point. Then, we store the
distance r and the direction from the boundary point to the reference point β in the R-Table
as a function of the orientationφ. We have in general many occurrences of the same orienta‐
tion as we move around the boundary. The form of the R-table is shown in Table 1.
Orientation φ Positions (r,β )
0
{
(r
i
, β
i
)
/
φ
i
= 0
}
Δφ
{
(r
i
, β
i
)
/
φ
i
= Δφ
}
2Δφ
{
(r
i
, β
i
)
/
φ
i
= 2Δφ
}
… …
Table 1. The general R-table form.
3.1.2. The accumulator construction
The accumulator is a three dimensional voting scheme constructed in the following manner.
For each edge point p
→
in the image, we compute the gradient directionφ
p
. Then, we vote for
all possible positions p
→
−r
→
i
of the reference point in the accumalator array, where r
→
i
are the
positions (r
i
, β
i
) undexed under φ
i
=φ
p
in the R-Table. The shape is indicated by finding local
maxima in the voting scheme.
3.2. Application to vertebrae segmentation
The proposed approach is based on three main steps:
1. Modeling
2. Detection
3. Post-processing
Template Matching Approaches Applied to Vertebra Detection
/>11
Figure 9. The steps of the proposed framework.
3.2.1. Modeling
The modeling process is an offline task. It is composed of three steps:
i. Geometric model construction: In this step, we build a vertebra mean model repre‐
senting the average shape corresponding to a set of 25 vertebrae. The contour used
to create this mean shape was extracted manually. the resulting model is shown in
Figure 2(a)
ii. Gradient computation and edge detection: We use the canny operator to extract the edge
of the vertebrae mean model. Canny operator was proposed in 1986 [19]. It is widely
used in image processing and provides an accurate result for edge detection.
Within this operator, the image is first smoothed to reduce the noise. This step is realized by
convolving the image with the kernel of Gaussian filter defined by equation (3):
G
(
x, y
)
=
1
2πσ
2
e
−
(
x
2
+y
2
)
/
2σ
2
(3)
The gradient of each pixel in the smoothed image is computed by applying the Sobel-opera‐
tor. The approximation is performed in horizontal and vertical directions by applying the
two masks shown in equation (4).
G
x
=
- 1 0 1
-2 0 2
-1 0 1
G
y
=
-1 -2 -1
0 0 0
1 2 1
(4)
Then, the direction of the edges is determined by the equation (5).
φ = arctan
(
G
x
G
y
)
(5)
The next step is non-maximum suppression. Only the local maxima in the gradient image
are preserved. Finally, an edge tracking by hysteresis is used, where high and low threshold
are defined to make a filter for pixels of the last image.
The canny edge detection result is shown in Figure 2(b).
Advances in Image Segmentation12
iii. R-Table construction: This offline phase of the GHT consists of calculating the tem‐
plate shape of the vertebra, constructed using information about position and di‐
rection of edge points computed in the last step.
Assuming that n denotes the number of model edge point p
i
(x
i
, y
i
)(i = 1 …n) and φ
i
its corre‐
sponding gradient. the refrence pointc
→
=(c
x
, c
y
)is calculated by the equation (6):
c
⇀
=
1
n
∑
p
⇀
i
(6)
The R-table is then constructed by analysing all the boundry points of the model shape. For
each point p
i
, we compute the distance r
i
and β
i
the angle between the horizontal direction
and the reference point c as shown ine equation (7) and (8).
r
i
=
(
x
c
- x
i
)
2
+
(
y
c
- y
i
)
2
(7)
β
i
=artan
(
y
i
− y
c
x
i
− x
c
)
(8)
Figure 10. The modelling process results (a) Vertebra mean model, (b) Edge detection result, (c) the template shape
constructed from the R-Table.
Therefore, the R-table allows to recompute the center point position, using edge points and
the gradient information, equation (9).
c
x
= x + rcos
(
β
)
, c
y
= y + rsin
(
β
)
(9)
The different parameters of the modified Hough transform are presented in Figure11.
Template Matching Approaches Applied to Vertebra Detection
/>13
Figure 11. The GHT parameters corresponding to a model edge point.
The R-table construction algorithm can be expressed as follow (Listing 1):
1. Create the R-table.
2. For each edge point p
i
, do:
a. Compute the gradient direction φ
b. Calculate r
i
c. Calculate β
i
3. Increment r
i
and β
i
as a function of φ
4. End
Listing 1. Pre-processing steps used to create the R-table
Figure 10(c) shows the vertebra construction using only information stored in the R-Table.
3.2.2. Potential vertebrae centers detection
For the vertebrae detection we propose two alternative approaches, Automatic and semi-au‐
tomatic detection. We make a preliminary pre-processing step based on histogram equaliza‐
tion to enhance X-ray images. Next, we use the Canny and Sobel operators for edge
detection and gradient computation. Then, we perform GHT process based on the R-table
calculated at offline training.
a. Pre-processing
Advances in Image Segmentation14
• Contrast-Limited Adaptive Histogram Equalization:This step aims to prepare the X-ray
images to edge detection by using the Contrast-Limited Adaptive Histogram Equali‐
zation (CLAHE) [3] technique used to improve the image contrast. It computes first
different local histograms corresponding to each part of the image, and uses them to
change the contrast of distinct regions of the image. This method is well known by
limiting noise amplification. The result of this step is shown in Figure 13(b).
• Gradient computation and edge detection:In this step, we repeat the same process descri‐
bed in the model construction. Therefore, edge detection with Canny filter is applied
to the improved image, and sobel operator is performed in –x and –y directions. The
result of the edge detection is showen in figure 13(c).
b. Region of interest selection
We made two alternative approaches of our selection of Region of Interest (ROI). The differ‐
ent versions of ROI selection are presented in Figure 12.
Figure 12. The two proposed processing of ROI selection.
Template Matching Approaches Applied to Vertebra Detection
/>15
Figure 13. The proposed edge detection approach in case of cervical vertebrae (a)the original X-ray image, (b) the
improved image, (c) The Canny edge detection result.
• Automatic: This algorithm travel through the image without any human action. Noises are
observed in the final results.
• Semi-automatic: Two points are placed to make a sub-image covering the area of cervical
vertebrae. The figure 14 shows the result selection
Figure 14. Semi-automatic ROI selection.
c. Accumulator construction:This step represents the core of the Generalized Hough Trans‐
form detection. It aims to determine the position of the center points of vertebrae in the
input X-ray image by using the information stored in the R-table.
Advances in Image Segmentation16
In practice, each point from the edge detection results, figure 13(c), votes for different possi‐
ble centers. The selection is based on the gradient direction of the target point and its corre‐
sponding information in the R-table. These votes are stored in an accumulator.
The proposed model may be not easily matched. For this reason, we add a new parameter to
make a range of scale to enhance the detection process. Therefore, a voted point can be ex‐
pressed by its two coordinates x and y:
a
b
=
x
i
y
i
+ s * r
φ
j
coscos
(
β
φ
j
)
sinsin
(
β
φ
j
)
(10)
Wheresis the scale, (r
φ
j
, β
φ
j
) the parameters obtained in (5) and (6) corresponding to φ value
in the R-table. Listing 2 summarize the detection algorithm.
1. Find all edge detection points
2. For each feature point
(
x
i
, y
i
)
a. Compute the gradient direction φ
b.
For each (r
φ
j
, β
φ
j
) indexed under φ in the R-table
• For each scale s, compute the candidate center
(
a, b)
• Increment
(
a, b) in the accumulator.
3. Potential centers are given by local maxima in the accumulator
Listing 2. Detection algorithm of the Generalized Hough transform method.
3.2.3. Post-processing analysis:
For the post processing analysis we propose a new powerful issue in order to consider in a
more global way the results given by the GHT voting procedure. This process is composed
of four steps:
a. Image grid cost: We divide the image area into small squares which sizes are depending
of the image resolution. We attribute to each of these areas a value determined by a cost
function at first depending only of the number of votes. Each square vote for a unique
point computed as a mean of all inside points
This method gives some good results on quality radiographies but quickly reach its lim‐
itations by detecting mainly false positive. That is why, in addition to this first detection
process, we introduce a new cost function, in order to eliminate the false positives.
b. Top voted: Based on the top three voted centers from the last step, we keep only the
points that are in a specific distance computed in an offline process based on experi‐
mentations,area of the first and third quadrant in figure 15. Then, we repeat the same
process for the selected point. This technique respects the inclination of the neck.
Template Matching Approaches Applied to Vertebra Detection
/>17
c. Linear regression fitting:Among the set of possible vertebrae extracted, the good ones are
those forming a line, globally orthogonal to the orientation of the considered vertebra.
We apply a simple linear regression based on a processing selection of top voted point
from the accumulator.
The objective of this step is to select the effectively voted points
(
x, y
)
based on the straight
line equation (11).
{
y = ax + b
a =
S
xy
S
xx
b = y
¯
−ax
¯
(11)
Where S
xy
=
∑
(x
i
− x
¯
)(y
i
− y
¯
)
Figure 15. Region of selection around the top voted point in color.
d. Adaptive distance filter: An adaptive filter is finally applied to the result of the linear regres‐
sion fitting step. This task aims to check the distance between selected points. Based on
these distance, we compute the average distance between vertebrae centers. This enables
us to eliminate false centers (with a distance higher or smaller than the average distance).
3.3. Experiments and results
Experimentations have been conducted using a set of 40 digitized X-ray films. These images
presenting cervical spine region (Figure 13(a)) are obtained from the National Health and
Nutrition Examination Surveys database NHANES II.
These experimentations are focused on the detection of the cervical vertebrae C3 to C7 (Fig‐
ure 16). Indeed, our input images contain a total of 200 (40x5) vertebrae. We notice that the
mean model was build using a set of 25 cervical vertebrae (Figure10(a)).
Advances in Image Segmentation18
Figure 16. Cervical vertebra C1 to C7.
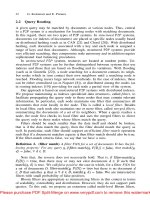
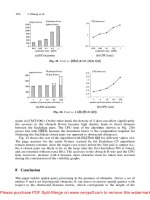
Figure17 and Figure 18 shows the obtained results by using thetwo proposed approaches in
case of four X-ray images. These results enabled a global accuracy of 64,5% with automatic de‐
tection and 89% with the semi-automatic detection on the 200 vertebrae investigated as shown
in Table 2. Notice that the C7 vertebra is detected with a rate of 32,5% and 60% with the two
techniques which is lower than the mean accuracy. This is due to the edge detection step which
does not detect efficiently this vertebra. The noise surrounding this cervical area makes this de‐
tection more difficult. We note 35,5% of false detection in the automatic technique.
Vertebrae
type
Detection rate
Automatic Semi-automatic
True False True False
C3 70,0% 35,5% 97,5% 0%
C4 77,5% 95,0%
C5 65,0% 95,0%
C6 77,5% 97,5%
C7 32,5% 60,0%
Global 64,5% 89,0%
Table 2. Accuracy recognition.
Template Matching Approaches Applied to Vertebra Detection
/>19