A novel supervised machine learning algorithm for intrusion detection k Prototype+ID3
Bạn đang xem bản rút gọn của tài liệu. Xem và tải ngay bản đầy đủ của tài liệu tại đây (750.95 KB, 6 trang )
A Novel Supervised Machine Learning Algorithm
for Intrusion Detection:
K-Prototype+ID3
K. Srikanth, S. Raghunath Reddy, T. Swathi
Computer Science and Engineering
G. Pulla Reddy Engineering College
Kurnool, India
Abstract— Data mining methods make it probable to look for
large amounts of information for characteristic rules and
patterns. They can be used to detect intrusions, attacks and/or
anomalies when applied to network monitoring data recorded on
a host or in a network .In this paper, we introduced a novel
machine learning algorithm “K-Prototype + ID3” which is used
to classify normal and anomalous activities in a computer
network. First we apply “k-prototype clustering algorithm”
which is a partition based clustering algorithm that works well
for data with mixed numeric and categorical features for
classifying anomalous and normal activities in a computer
network. The k-prototype method first partitions the training
instances into k-clusters using dissimilarity measurement. On
each cluster representing a density region of normal or anomaly
instances we construct an “ID3 decision tree”. The decision tree
on every cluster filters the decision boundaries by learning the
subgroups within the cluster. At last, to get final decision on
classification, the results of K-Prototype and ID3 methods are
combined using two phases namely Candidate Selection phase
and Candidate Combination phase on the test instance to predict
normality or anomalistic. We perform experiments on Network
Anomaly data (NAD) data set. Results show that K-
Prototype+ID3 have high classification accuracy of 96.84 percent
on NAD compared to individual K-Means, ID3and K-
Means+ID3.
Keywords— Data mining, Classification, K-Means clustering, K-
Prototype, Decision trees, Intrusion Detection.
I. INTRODUCTION
Intrusion detection systems aim at detecting attacks against
computer systems and networks, or against information
systems in general, as it is difficult to provide provably secure
information systems and maintain them in such a secure state
for their entire lifetime and for every utilization. Therefore, the
task of intrusion detection systems is to monitor the usage of
such systems and to detect the apparition of insecure states.
Intrusion detection technology [1] is an important component
of information security technology and an important
supplement to traditional computer security mechanisms.
Intrusion detection can be categorized into two types:
one is anomaly detection. It firstly stores users normal
behavior into feature database, then compares characters of
current behavior with characters of feature database. If the
deviation is large enough, we can say that the current behavior
is anomaly or intrusion. Although having a low false negative
rate and high false alarm rate, it can detect unknown types of
attacks. The other is misuse detection. It establishes a feature
library according to the known attacks, and then matches the
happened behaviors to detect attacks. It can only detect known
types of attacks, but is unable to detect new types of attacks.
Therefore misuse detection has a low false alarm rate and a
high false negative rate.
There are many methods applied into intrusion
detection [6], such as methods based on statistics, methods
based on data mining, methods based on machine learning and
so on. In recent years, data mining technology is developing
rapidly and increasingly mature and now it is gradually
applied to Intrusion Detection field. Clustering is a data
mining technique where data points are clustered together
based on their feature values and a similarity metric.
Clustering algorithms are generally categorized under two
different categories- partitional and hierarchical. Partitional
clustering algorithms divide the data set into non-overlapping
groups [8, 9]. Algorithms k-mean, k-modes, etc. fall under this
category. Hierarchical algorithms use the distance matrix as
input and create a hierarchical set of clusters. Hierarchical
clusters are may be agglomerative or divisive, each of which
has different ways of determining cluster membership and
representation. Bloedorn [2] use k-means approach for
network intrusion detection. There is a disadvantage in using
k-means approach because it works only for numeric
attributes. In this paper, we introduced a new algorithm ―K-
Prototype‖ which works for mixed data namely numeric and
categorical which gives a broad scope to work with wide
range of data sets.
1.1 Contribution of the Paper
The contribution of the paper is enumerated as follows:
The paper presents a K-means based algorithm
―K-Prototype‖ which works well for data sets of
mixed attributes namely numeric and categorical.
The paper presents a K-Prototype + ID3
algorithm for classifying the data as normal or
anomaly using Nearest Neighbor rule and
Nearest Consensus rule.
The paper evaluates the performance of K-
Prototype+ID3 clustering algorithm for anomaly
1475
International Journal of Engineering Research & Technology (IJERT)
ISSN: 2278-0181
www.ijert.orgIJERTV3IS051537
Vol. 3 Issue 5, May - 2014
detection and compares with individual K-
Means, ID3and K-Means+ID3.
The rest of the paper is organized as follows: In section2, we
briefly discuss the K-Prototype and ID3 decision tree learning
based intrusion detection methods. In section3, we present K-
Prototype+ID3 method for intrusion detection. In section4, we
discuss the experimental dataset. In section5, we discuss the
results. In section6, we conclude our work.
II. INTRUSION DETECTION WITH K-PROTOTYPE
CLUSTERING AND ID3 DECISION TREE LEARNING
METHODS
In this section, we briefly discuss the K-Prototype [3]
clustering and ID3 decision tree classification [12] methods
for intrusion detection.
2.1 Review of k-prototype Clustering Algorithm
The k-prototype algorithm [3] works well for mixed data, a
combination of pure numeric and categorical data. This uses
joint probability distributions based on probability of co-
occurrence with other attributes.
K-prototype Clustering Algorithm
Begin
Initialization – Allocate data objects to a pre-determined k
number of clusters randomly.
• For every categorical attribute
• Compute distance δ(r, s) between two categorical
values r and s.
• For every numeric attribute
• Compute significance of attribute
• Assign data objects to different clusters randomly.
Repeat steps 1–2
1. Compute cluster centers for C
1
, C
2
, C
3
, , , , , ,C
k
.
2. Each data object d
i
( i = 1, 2, . . . , n) {n is number of data
objects in data set} is assigned to its closest cluster center
using 𝜗(𝑑
𝑖
, 𝐶
𝑗
)
Until no elements change clusters or a pre-defined number of
iterations are reached.
End.
The cost function of k-prototype is specified in the following
equation, which is to be minimized for clustering mixed data
sets.
𝖢 =
𝜗(𝑑
𝑖
, 𝐶
𝑗
)
𝑛
𝑖=1
Where
𝜗(𝑑
𝑖
, 𝐶
𝑗
) =
(𝑤
𝑡
𝑚
𝑟
𝑡=1
(𝑑
𝑖𝑡
𝑟
− 𝐶
𝑗𝑡
𝑟
))
2
+
Ω(𝑑
𝑖𝑡 ,
𝑐
𝑚
𝑐
𝑡=1
𝐶
𝑗𝑡
𝑐
)
2
Where
(𝑤
𝑡
𝑚
𝑟
𝑡=1
(𝑑
𝑖𝑡
𝑟
− 𝐶
𝑗𝑡
𝑟
))
2
denotes the distance of object d
i
from its closest cluster center C
j
, for numeric attributes only,
w
t
denotes the significance of t
th
numeric attribute which is to
be computed from the data set,
Ω(𝑑
𝑖𝑡 ,
𝑐
𝑚
𝑐
𝑡=1
𝐶
𝑗𝑡
𝑐
)
2
denotes the distance between the data object d
i
and its closest
cluster center C
j
in categorical attributes only.
Let A
i
, k denote the k
th
value for categorical attribute A
i
. Let
the total number of distinct values for A
i
is p
i
. Then this
distance is defined as
Ω(X, C) = (N
i,1,c
/ N
c
) * δ(X, A
i,1
) + (N
i,2,c
/ N
c
) *
δ(X, A
i,2
) + … + (N
i,pi,c
/ N
c
) * δ(X, A
i,pi
)
Algorithm ALGO_DISTANCE [3] computes the distance δ(x,
y).
The following properties hold for of δ(x, y):
(1) 0 <= δ(x, y) <= 1.
(2) δ(x, y) = δ(y, x ).
(3) δ(x, x) = 0.
2.2 Intrusion Detection with k-prototype Clustering Algorithm
We are provided with a training data set (X
i
, Y
i
) i=1, 2, … .N,
where X
i
represents an n-dimensional continuous valued
vector and Y
i
represents the corresponding class label with
―0‖ for normal and ―1‖ for intrusion. The k-prototype
algorithm has the following steps:
For each test instance Z:
Compute the distance D(C
i
, Z), i=1,2,….k. Find
cluster C
r
that is closest to Z.
Classify Z as an intrusion or a normal instance using
either the Threshold rule or the Bayes Decision rule.
The Threshold rule for classifying a test instance Z
that belongs to cluster C
r
is:
Assign Z 1 if 𝑃(𝜔
1𝑟
| 𝑍∈𝐶
𝑟
) > τ
Otherwise Z0
Where ―0‖ and ―1‖ represent normal intrusion classes
in cluster C
r ,
𝑃(𝜔
1𝑟
| 𝑍∈𝐶
𝑟
) represents the
probability of anomaly instances in cluster C
r
, and τ
is predefined threshold. A test instance is classified as
an anomaly only if it belongs to a cluster that has
anomaly instances in majority.
The Bayes Decision rule is
Assign Z 1
if 𝑃(𝜔
1𝑟
| 𝑍∈𝐶
𝑟
) > 𝑃(𝜔
0𝑟
| 𝑍∈𝐶
𝑟
)
Otherwise Z0,
where ω
0
represents the normal class in cluster C
r
and
𝑃(𝜔
0𝑟
| 𝑍∈𝐶
𝑟
) is the probability of normal
instances in cluster C
r.
In our experiments we use Bayes Decision rule for classifying
the given test instance as normal or intusion activity.
2.3 Intrusion Detection with ID3 decision trees
We compute the information gain IG on each attribute T of
ID3 decision tree algorithm as follows
1476
International Journal of Engineering Research & Technology (IJERT)
ISSN: 2278-0181
www.ijert.orgIJERTV3IS051537
Vol. 3 Issue 5, May - 2014
,
=
× ()
()
Where P is the total input space and P
i
is the subset of P for
which attribute T has a value i. The Entropy(P) over n classes
is given by
=
log(
)
=1
where p
j
represents the probability of class ―j‖. The
probability of class j is calculated as follows:
=
=1
Where N
k
is the number of training instances in class x.
The attribute with the maximum information gain,
say L, is chosen as the first node i.e., root of the tree. Next, a
new decision tree is recursively constructed over each value of
L using the training subspace P-{P
L
}. A leaf-node or a
decision node is formed when all the instances within the
available training subspace are from the same class. For
detecting intrusions, the ID3 decision tree outputs binary
classification decision of ―0‖ to indicate normal activity and
―1‖ indicates intrusion to test instances.
III. INTRUSION DETECTION BY USING K-
PROTOTYPE + ID3 METHOD
We start our work with two data sets. One is training data set
and the other is testing data set. We apply K-Prototype + ID3
algorithm first on training data set. During training, first using
K-Prototype we divide the given training instances in to ‗x‘
disjoint clusters C
1
, C
2 …
C
x
. After dividing training instances
into ―x‖ clusters, we apply ID3 decision tree on training
instances of each cluster. It there are any overlaps among the
instances in the clusters, the overlapped clusters is trained with
the ID3 which refines the boundary decisions by partitioning
the instances with the set of if-then rules over the feature
space. During Testing, the algorithm has two steps namely
candidate selection phase and candidate combination phase. In
candidate selection phase we extract the individual decisions
of K-Prototype and ID3. In candidate combination phase, we
combine the decisions of K-Prototype and ID3 to get the final
decision of class membership which is assigned to a test
instance. For combining the decisions of K-Prototype and ID3,
we follow two joining rules: i) Nearest Neighbor rule and ii)
Nearest Consensus rule. A complete review of two phases is
given below.
3.1 The Candidate Selection Phase
Let C
1
, C
2
, …C
x
be the clusters formed after applying K-
Prototype method on training instances. Let o
1,
o
2
, …
o
x
be the
centroids of clusters C
1
, C
2
, …C
x
respectively. Let D
1
, D
2
,
…D
x
be the ID3 decision trees on clusters C
1
, C
2
, …C
x
. Let T
i
be the test instance, this phase extracts anomaly scores for z
candidate clusters R
1
, R
2,
…R
z
. The ―z candidate clusters‖ are
z clusters in C
1
, C
2
, …C
x
that are closer to T
i
in terms of
Euclidean distance between T
i
and the cluster centroids. Here,
z is a user defined parameter.
Let w
1
, w
2
, …, w
z
represent centroids of candidate
clusters R
1
, R
2,
…R
z
. Let ED(T
i
, w
1
)=d
1
, ED(T
i
, w
2
)=d
2
, and
ED(T
i
, m
f
)=d
f
, represent the Euclidean distances between the
test instance T
i
and the z candidate clusters. The K-Prototype
anomaly scores A
s
, s=1,… , z, for each of the z candidate
clusters is given by
=
1
× 1
(
=1
,
)
Where
1
is the probability of anomaly instances in
cluster ―s‖. In the above equation the term
1
(
=1
,
)
is called the Scaling Factor (SF). The decisions from the ID3
decision trees associated with the z candidate clusters are
either ―0‖ for normal activity or ―1‖ for anomaly activity. The
candidate selection phase outputs an anomaly score matrix
with the decisions extracted from the K-Prototype and ID3
anomaly detection methods for a given test vector. The
decisions stored in the anomaly score matrix are combined
with the candidate combination phase to yield a final decision
on the test vector.
3.2 The Candidate Combination Phase
Anomaly score matrix which contains anomaly scores of the
K-Prototype and the decisions of ID3 over z candidate
clusters. This anomaly score matrix is the input for Candidate
Combination Phase.
To combine the decisions of K-
Prototype and ID3 algorithms, we use the following
two rules. They are: 1) Nearest Consensus rule 2)
Nearest Neighbor rule.
R
1
R
2
R
3
……… R
z
K-Prototype
1 1 0 ……… 1
ID3
0 1 0 ……… 0
↑
Consensus
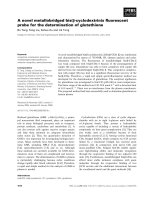
Fig 1. Anomaly score matrix for test vector T.
3.2.1
Nearest-Consensus Rule
Fig. 1 is an
example
of an
anomaly
score matrix for
the
test vector T. The
candidate clusters
R
1
; R
2
; ;
Rz
are
structured
in the
anomaly
score matrix such that the
distances
d
1
; d
2
; ; d
f
between T
and the
candidate clusters
R
1
; R
2
; ;
Rz
,
respectively,
satisfy d
1
<
d
2
<
<
d
z
.
I
n
the
Nearest-consensus
rule
, we combine the decisions of K-Prototype and ID3
decision tree method and choose the anomaly score for the test
vector T. For eg., in Fig. 1, from the anomaly score matrix the
combined decisions of K-Prototype and ID3 for candidate
cluster R2 and finally the test vector T is classified as ―1‖ i.e.,
an anomaly.
1477
International Journal of Engineering Research & Technology (IJERT)
ISSN: 2278-0181
www.ijert.orgIJERTV3IS051537
Vol. 3 Issue 5, May - 2014
3.2.2
Nearest-neighbor Rule
The
Nearest-neighbor
rule gives the decision of ID3 of
the nearest candidate cluster within the z candidate
clusters. For the test vector T the nearest candidate
cluster is R1. Therefore the decision of ID3 is assigned
to test vector T as ―0‖ (normal).
IV. EXPERIMENTAL DATA SET
In this section, we present in detail description of data set
Network Anomaly Data (NAD). The NAD contains three sub
data sets. They are 1) NAD 98 2) NAD 99 3) NAD 00,
obtained by attribute extracting the 1998, 1999, and 2000
MIT-DARPA network traffic corpora [].
In our experiments, we taken at most 5000 training
instances from NAD 98 & 99 sub data set with 70 percent of
them being normal instances and remaining of them being
anomaly instances and we taken 2500 unseen testing instances
from NAD 98 & 99 (i.e., those that are not included in training
data subsets), with 80 percent of them being normal instances
and remaining 20 percent being anomaly instances. For NAD
2000 data set, we considered less number of instances i.e., 420
training instances and testing instances because of limited
number of anomaly instances available in NAD 2000.
Table 1 shows the proportion of normal and anomaly
instances and the number of dimensions in the three sub data
sets of NAD data set.
Datasets
Dime
ns-
ions
Training
instances
Testing instances
Normal
Ano-
maly
Normal
Anoma-
ly
N
A
D
1998 12 3500 1500 2000 500
1999 10 3500 1500 2000 500
2000 10 294 126 336 84
Table 1 Characteristics of the NAD Data set used in intrusion
detection experiments.
4.1 Network Anomaly Data:
Here we give brief description of each sub data set of NAD.
The data set is extracted from MIT-DARPA network traffic,
each data sub set contain artificial neural network-based
nonlinear component analysis feature-extracted 1998, 1999,
2000. The NAD 1998 Data sets were gathered on an
evaluation test bed simulating network traffic similar to that
seen between an Air Force base (INSIDE network) and the
Internet (OUTSIDE network). Nearly seven weeks of training
data and two weeks of test data were composed by a sniffer
deployed between the INSIDE and OUTSIDE network. From
OUTSIDE network thirty-eight different attacks were
launched. List files provide attack labels for the seven-week
training data, but the list files associated with the test data
doesn‘t contain attack labels. So, we considered only seven
week training data for both training and testing purposes. The
NAD 1999 Data sets were generated on a test bed similar to
that used for NAD 1998 Data sets. Twenty-nine additional
attacks were identified. The data sets contain approximately
three weeks of training data and two weeks of test data. In our
experiments, we use the tcpdumps generated by the sniffer in
the INSIDE network on weeks 1, 3, 4, and 5. The tcpdumps
from week-2 were excluded because the list files related with
data sets were not available. The NAD 2000 Data sets are
attack-scenario specific data sets. The data sets contain three
attack scenarios replicated with the background traffic being
similar to those in NAD 1999 data sets. The first data set, LLS
DDOS 1.0, replicates a 3.5 hour attack scenario in which a
trainee attacker starts a Distributed Denial of Service (DDOS)
attack against a raw adversary. The second data set, LLS
DDOS 2.0.2, is a two hour furtive DDOS attack scenario. The
third data set, Windows NT attack, is a nine hour data set
enclosed five phased Denial of Service (DoS) attack on
Windows NT hosts.
V. EXPERIMENTAL RESULTS
In this section, we
discuss
the
results
of the K-
P
rototype+ID3
method
and
compare
it with the
individual
k-Means, ID3 and k-Means +ID3 decision tree
methods
over the
NAD
data set. We use four
different
measures
f
or comparing
the
performance of K-
Prototype+ID3 over
k-Means, ID3 and k-Means +ID3
methods
:
1. ―total
accuracy‖
or
―accuracy‖
is the
percentage of
all
normal
and
anomaly
instances
that are
correctly classified,
2.
―precision‖
is the
percentage
of correctly
detected anomaly instances
over all the
detected anomaly
instances,
3. TPR or recall is the
percentage
of
anomaly
instances
correctly detected
,
4.
FPR is the
percentage
of
normal instances
incorrectly
classified
as
anomaly,
5.1
Results on the NAD-1998 Data Set
Here, we
present
the
outcome
of the k-Means, ID3
decision
tree, k-means+ID3-based anomaly detection
methods
and
the
K-Prototype+ID3
method
over the
NAD-1998 data
sets.
Fig. 2
demonstrates
the
performance
of the k-
Means, the ID3, the K-Means+ID3 metho d s
, and K-
Prototype+ID3 averaged
over 12 trials for
k-means, K-
Prototype,
K
-means+ID3, and K-Prototype+ID3.
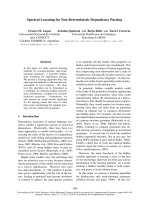
For the
NAD-1998 data
sets,
the k value of the k-Means & K-
Prototype
method
was set to 20. For
the
ID3, the
training
space was
discretized
into 45
equal-width
intervals.
For the K-Prototype+ID3 cascading
method
the k
was
set to 20 and the data was discretized
into 45
equal-
width intervals.
The choice of k value used in our
experiments was
based on 10 trial
experiments
conducted
with k set to 5, 10, 12, 15, and 20. The
performance
of the
k-Prototype
anomaly detection
did
not show any major
enhancement when
k value w a s set
to a value gr ea te r
than 20. In the same way, the
selection
of the number
of
equal-width intervals
for
discreti
zation
was based on 19 e xp er i ment s
conducted wi th
different discretization
values ( e.g. 10, 15, , 100). Fig.
4 shows that the K-Prototype+ID3
cascading method
based
on
Nearest-neighbor
(NN)
combination
rules has
better performance
than the
k-means,
ID3, k-means+ID3
1478
International Journal of Engineering Research & Technology (IJERT)
ISSN: 2278-0181
www.ijert.orgIJERTV3IS051537
Vol. 3 Issue 5, May - 2014
in terms of TPR, FPR,
Precision and Accuracy.
Fig 2. Performance of K-Means, ID3, K-Means+ID3, and the K-
Prototype+ID3 over the NAD 1998 test data set.
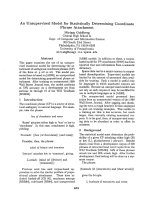
5.2
Results on the NAD-1999 Data Set
Fig. 3
demonstrates
the
performance
of the k-Means, the
ID3, the K-Means+ID3, and K-Prototype+ID3
methods
averaged
over 12 trials
for
k-Prototype and
K-
Prototype+ID3. The k value of individual k-Prototype was
set to 5 for the NAD 1999 Data sets.
For the ID3
algorithm,
the
training
space was
discretized
into 25
equal- width intervals.
For the K-Prototype+ID3
cascading
,
the
value
of k was set to 5 and the data was
discretized
into 25
equal- width intervals.
Fig. 3 shows
that the K-Prototype+ID3
cascading method based
on
Nearest-neighbor
(NN)
combination
rules has
better
performance
than the
k-means,
ID3, k-means+ID3 in
terms of TPR, FPR,
Precision and Accuracy.
Fig 3. Performance of K-Means, ID3, K-Means+ID3, and the K-
Prototype+ID3 over the NAD 1998 test data set.
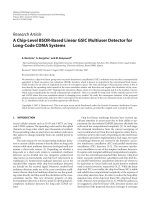
5.3
Results on the NAD-2000 Data Set
Fig. 4
demonstrates
the
performance
of the k-Means, the
ID3, the K-Means+ID3, and K-Prototype+ID3
methods
averaged
over 12 trials
for
k-Prototype and
K-
Prototype+ID3. The k value of individual k-Prototype was
set to 10 for the NAD 2000 Data sets.
For the ID3
algorithm,
the
training
space was
discretized
into 15
equal- width intervals.
For the K-Prototype+ID3
cascading
,
the
value
of k was set to 10 and the data was
discretized
into 15
equal- width intervals.
Fig. 4 shows
that the K-Prototype+ID3
cascading method based
on
Nearest-neighbor
(NN)
combination
rules has
better
performance
than the
k-means,
ID3, k-means+ID3 in
terms of TPR, FPR,
Precision and Accuracy.
Fig 4. Performance of K-Means, ID3, K-Means+ID3, and the K-
Prototype+ID3 over the NAD 1998 test data set.
VI. CONCLUSION AND FUTURE WORK
In this
paper,
we
presented
the K-Prototype+ID3 pattern
recognition method
for intrusion
detection.
The
K-
Prototype
+ID3
method
is based on
cascading
two
w
e
ll-
k
n
own
machine learning methods:
1) the k-
Prototype and 2) the ID3 decision trees. The k -
Prototype
method is
f i r s t
applied to
partition
the
training
instances
into k disjoint clusters.
The
ID3
decision tree built on each cluster learns the
subgroups
within
the cluster and
partitions
the decision space
into
finer
classification
regions;
thereby enhancing
the
overall classification performance.
We
compare
our
cascading
method
with the individual
k-Means, ID3; K-
Mean+ID3
methods in
terms of the overall classification
performance defined over
four
different performance
measures.
Results on the NAD 98, NAD 99, and NAD
2000 data sets show that
K-Prototype+ID3 is better
when compared to individual k-means, ID3, and K-
Means+ID3 method. Another major benefit is that the
proposed algorithm works well both for categorical and
numerical attributes where K-means+ID3 doesn‘t work
for categorical attributes. As we know that K-Prototype
is better when compared to k-Means algorithm in terms
of classification performance.
Future directions
in this research
include:
1)
developing
theoretical
error bounds
for the K-
Prototype+ID3 method
,
and
2)
comparing
the
performance
of
K-Prototype+ID3
with
cascading
classifiers
developed
using
different clustering
methods
like
hierarchical clustering, adaptive
resonance
(ART)
neural networks,
and
Kohonen‘s
sel
f-o
rganizing
maps and decision trees like C4.5 and
Classification
and
Regression
Trees (CART).
0
0.2
0.4
0.6
0.8
1
K-Means
ID3
K-Means+ID3
0
0.2
0.4
0.6
0.8
1
K-Means
ID3
K-Means+ID3
K-
Prototype+ID3
0
0.2
0.4
0.6
0.8
1
K-Means
ID3
K-Means+ID3
1479
International Journal of Engineering Research & Technology (IJERT)
ISSN: 2278-0181
www.ijert.orgIJERTV3IS051537
Vol. 3 Issue 5, May - 2014
[1]
Qun Yang, ―A survey of Intrusion Detection Technology [J],‖ Network
Security Technology & Application, 2008
[2]
Bloedorn, E., A. D. Christiansen, W.Hill, C. Skorupka, L. Talbot, and
J.Tivel (2001, August). Data mining for network intrusion detection:
How to get started. />
[3]
Amir Ahmad and Lipika Dey ―A k-mean clustering algorithm for mixed
numeric and categorical data.‖ Data & Knowledge Engineering 63
(2007) 503–527].
[4]
R.P. Lippman, D.J. Fried, I. Graf, J. Haines, K. Kendall, D.McClung, D.
Weber, S. Webster, D. Wyschogrod, R.K. Cunningham, and M.A.
Zissman, ―Evaluating Intrusion Detection Systems: The 1998 DARPA
Off-Line Intrusion Detection Evaluation,‖ Proc.DARPA Information
Survivability Conf. and Exposition (DISCEX ’00),pp. 12-26, Jan. 2000.
[5]
J. Haines, L. Rossey, R.P. Lippman, and R.K. Cunningham,―Extending
the DARPA Offline Intrusion Detection Evaluation,‖ Proc. DARPA
Information Survivability Conf. and Exposition (DISCEX’01), June
2001.
[6]
Herve Debar, Marc Dacier, Andreas Wespi ―Towards a taxonomy of
intrusion-detection systems‖ Computer Networks 31 (1999) 805-822
[7]
Ciza Thomas, Vishwas Sharma, N Balakrishnan IISc, Bangalore India
―Usefulness of DARPA Dataset for Intrusion Detection System
Evaluation‖
[8]
R. Duda, P. Hart, Pattern Classification and Scene Analysis, John Wiley
and Sons, New York, 1973.
[9]
A.K. Jain, R.C. Dubes, Algorithms for Clustering Data, Prentice Hall,
Englewood Cliff, New Jersey, 1988.
[10]
R. Duda, P.Hart, and D. Stork, Pattern Classification, second ed. Wiley
Publishers, oct. 2000.
[11]
J. Huang and C. Ling, ―Using AUC and Accuracy in Evaluating
Learning Algorithms‖ IEEE Trans. Knowledge and Data Eng,
vol. 17,
no. 3, pp. 299-310, Mar. 2005.
[12] T. Mitchell, Machine Learning, McGraw-Hill, 1997.
[13] A. Lazarevic, A. Ozgur, L. Ertoz, J. Srivastava, and V.Kumar, ―A
Comparative Study of Anomaly Detection Schemes in Network
Intrusion Detection‖, Proc. SIAM Int’l conf. Data Mining, May 2003.
[14] S.C. Chin, A. Ray, and V. Rajagopalan, ―Symbolic Time Series Analysis
for Anomaly Detection: A Comparative Evaluation‖ Signal Processing,
vol. 83, no. 9, pp 1859-1868, Sept. 2005.
[15] Z. Zhang, J. Li, C.N. Manikopoulos, J. Jorgenson, and J. Ucles, ―HIDE:
A Hierarchical Network Intrusion Detection System Using Statistical
Preprocessing and Neural Network Classification,‖ Proc, 2001 IEEE
Workshop Information Assurance, pp. 85-90, June 2001.
[16] S. Kumar and E.H. Spafford, ―A Pattern Matching Model for Misuse
Intrusion Detection,‖ Proc. 17
th
Nat’l Computer Security Conf., pp. 11-
21, Oct. 1994.
[17] I. Levin, ―KDD-99 Classifier Learning Contest: LLSoft‘s Results
Overview,‖ SIGKDD Explorations, vol.1, pp. 67-75, Jan. 2000.
[18] J. Gomez and D.D. Gupta, ―Evolving Fuzzy Classifiers for Intrusion
Detection,‖ Proc. 2002 IEEE Workshop Information Assurance, June
2001.
[19] J. Kittler, M. Hatef, R.P.W. Duin, and J. Matas, ―On Combining
Classifiers,‖ IEEE Trans. Pattern Analysis and Machine Intelligence,
vol. 20, no. 3, pp. 226-239, Mar. 1998.
[20] A. Verikas, A. Lipnickas, K. Malmqvist, M. Bacauskiene, and A.
Gelzinis, ―Soft Combination of Neural Classifiers: A Comparative
Study,‖ Pattern Recognition Letters, vol. 20, pp. 429-444, 1999.
[21] C. Kruegel and G. Vigna, ―Anomaly Detection of Web-Based Attacks,‖
Proc. ACM Conf. Computer and Comm. Security, Oct. 2003.
[22] A. Ray, ―Symbolic Dynamic Analysis of Complex Systems for Anomaly
Detection,‖ Signal Processing, vol.84, no. 7, pp. 1115-1130, 2004.
REFERENCES
1480
International Journal of Engineering Research & Technology (IJERT)
ISSN: 2278-0181
www.ijert.orgIJERTV3IS051537
Vol. 3 Issue 5, May - 2014