Chart your way to profits the online traders guide to technical analysis
Bạn đang xem bản rút gọn của tài liệu. Xem và tải ngay bản đầy đủ của tài liệu tại đây (15.05 MB, 427 trang )
ffirs.qxd 2/8/07 1:08 PM Page i
Chart Your
Way to Profits
ffirs.qxd 2/8/07 1:08 PM Page ii
Founded in 1807, John Wiley & Sons is the oldest independent publishing company in the United States. With offices in North America, Europe, Australia and Asia, Wiley is globally committed to developing and
marketing print and electronic products and services for our customers’
professional, and personal knowledge and understanding.
The Wiley Trading series features books by traders who have survived
the market’s ever changing temperament and have prospered—some by
reinventing systems, others by getting back to basics. Whether a novice
trader, professional, or somewhere in-between, these books will provide
the advice and strategies needed to prosper today and well into the future.
For a list of available titles, please visit our Web site at www.Wiley
Finance.com.
ffirs.qxd 2/8/07 1:08 PM Page iii
Chart Your
Way to Profits
The Online Trader’s Guide
to Technical Analysis
TIM KNIGHT
John Wiley & Sons, Inc.
ffirs.qxd 2/8/07 1:08 PM Page iv
Copyright © 2007 by Tim Knight. All rights reserved.
Published by John Wiley & Sons, Inc., Hoboken, New Jersey.
Published simultaneously in Canada.
Wiley Bicentennial Logo: Richard J. Pacifico
No part of this publication may be reproduced, stored in a retrieval system, or transmitted
in any form or by any means, electronic, mechanical, photocopying, recording, scanning,
or otherwise, except as permitted under Section 107 or 108 of the 1976 United States
Copyright Act, without either the prior written permission of the Publisher, or
authorization through payment of the appropriate per-copy fee to the Copyright
Clearance Center, Inc., 222 Rosewood Drive, Danvers, MA 01923, (978) 750-8400,
fax (978) 646-8600, or on the web at www.copyright.com. Requests to the Publisher for
permission should be addressed to the Permissions Department, John Wiley & Sons, Inc.,
111 River Street, Hoboken, NJ 07030, (201) 748-6011, fax (201) 748-6008, or online at
/>Limit of Liability/Disclaimer of Warranty: While the publisher and author have used their
best efforts in preparing this book, they make no representations or warranties with respect
to the accuracy or completeness of the contents of this book and specifically disclaim any
implied warranties of merchantability or fitness for a particular purpose. No warranty may
be created or extended by sales representatives or written sales materials. The advice and
strategies contained herein may not be suitable for your situation. You should consult with a
professional where appropriate. Neither the publisher nor author shall be liable for any loss
of profit or any other commercial damages, including but not limited to special, incidental,
consequential, or other damages.
For general information on our other products and services or for technical support, please
contact our Customer Care Department within the United States at (800) 762-2974, outside
the United States at (317) 572-3993 or fax (317) 572-4002.
Wiley also publishes its books in a variety of electronic formats. Some content that appears
in print may not be available in electronic books. For more information about Wiley
products, visit our web site at www.wiley.com.
Library of Congress Cataloging-in-Publication Data:
Knight, Tim, 1966–
Chart your way to profits : the online trader’s guide to technical
analysis / Tim Knight.
p. cm.—(Wiley trading series)
Includes bibliographical references and index.
ISBN: 978-0-470-04350-9 (cloth)
1. Stocks—Charts, diagrams, etc. 2. Investment analysis.
3. Electronic trading of securities. I. Title.
HG4638.K55 2007
332.63'2042—dc22
2006030762
Printed in the United States of America.
10
9
8
7
6
5
4
3
2
1
ffirs.qxd 2/8/07 1:08 PM Page v
To Alexander Dobrovolski, who made it all possible
ffirs.qxd 2/8/07 1:08 PM Page vi
ftoc.qxd 2/8/07 1:08 PM Page vii
Contents
Introduction
ix
About the Author
CHAPTER 1
Technical Analysis: What It Is and
Why It Works
xiii
1
CHAPTER 2
Fundamentals of Chart Creation
27
CHAPTER 3
Modules and Preferences
45
CHAPTER 4
Watch Lists and Chart Styles
71
CHAPTER 5
Indicators in Action
83
CHAPTER 6
Multiple Studies and Comparisons
109
CHAPTER 7
Trendlines and Reversals
139
CHAPTER 8
Expansion and Channels
191
CHAPTER 9
Rounded Tops and Saucers
207
CHAPTER 10 Cup with Handle
239
CHAPTER 11 Multiple Tops and Bottoms
257
CHAPTER 12 Head and Shoulders
283
vii
ftoc.qxd 2/8/07 1:08 PM Page viii
viii
CONTENTS
CHAPTER 13 Fibonacci Drawings
347
CHAPTER 14 JavaCharts and ProphetCharts
379
CHAPTER 15 A Practical Guide to Trading
399
Index
407
flast.qxd 2/8/07 1:09 PM Page ix
Introduction
One of my favorite photographs was taken by my wife on our honeymoon.
We were on the second leg of our trip, the first of which was in Dubrovnik,
Croatia (part of the former Yugoslavia), and the second in central Italy.
The photo shows me in bed, apparently asleep. The title of the book I am
holding across my chest is clearly legible: Technical Analysis of Stock
Trends, by Edwards and Magee.
Charting the financial markets has been my passion for some 20 years.
The very first trade I ever placed in my life was on Black Monday, the crash
of 1987—hardly a propitious start. But the markets and their vagaries have
fascinated me ever since.
In 1992, I took my three main areas of interest—computers, trading,
and business—and combined them to create Prophet Financial Systems.
That was before the commercial Internet even existed (we used dial-up
modems in those days for daily data updates). Over the years, we built a
wide array of tools, all with the purpose of trying to help people make better trading decisions.
To be honest, I personally find books about technical analysis boring.
They are full of indicators, formulas, tables, and numbers. By and large,
they put me to sleep (witness the honeymoon photo). I set out to make this
book different. I wanted you to enjoy learning from this book, and I
wanted to use as many real-life examples as possible. Hypothetical charts
mean little, in my opinion. So you will find this book packed with hundreds
of examples drawn from real trading in U.S. equity markets. This should
give you a practical way to see how to apply the ideas presented in these
pages.
ACCESSING THE CHARTS
In 1998, we at Prophet took the first small steps toward creating a charting
applet, which we called JavaCharts. My philosophy in product development
ix
flast.qxd 2/8/07 1:09 PM Page x
x
INTRODUCTION
has always been the same: have my engineers create a product that I love
to use. This had the happy side effect of attracting a lot of traders, because they liked what they saw too.
JavaCharts became the foundation of the business in many ways. It
was very popular on our own web site, Prophet.net, and we licensed it to a
wide variety of brokerages and other businesses. The quality and reputation of the product was an important reason behind our securing the “Best
of the Web” awards from both Barron’s and Forbes, beginning in 1999 and
continuing to this day.
Over a nearly four-year period—from the beginning of 2003 to the end
of 2006—we focused on our next generation of charting. Originally referring to this as simply JavaCharts 2, we later christened it ProphetCharts.
Although this book will prove helpful to anyone interested in technical
analysis, it will be especially instructive to users of the JavaCharts and
ProphetCharts products.
There are a variety of ways to access the JavaCharts product. It is
available on the Prophet web site (www.prophet.net) for no charge, although many of its power features require a monthly subscription fee. It
is also available on a large number of sites that have licensed the product from Prophet. As of this writing, for instance, customers of Scottrade, optionsXpress, thinkorswim, and XPressTrade have access to
JavaCharts.
ProphetCharts, which is newer and more feature-rich, is available
only on the INVESTools Investor Toolbox (www.investools.com) and
the www.Prophet.net web site as of this writing. Although JavaCharts
and ProphetCharts have many similarities, there are certain newer features in ProphetCharts that simply do not exist in the older product. A
breakdown of the differences between these two products is detailed in
Chapter 14.
Even if you don’t use any charting product at all, I hope that the concepts and illustrations in this book will prove invaluable to you. However,
I encourage you to check out either JavaCharts or ProphetCharts if you
are able to do so.
HOW TO REACH ME
I would love to hear from you! I enjoy being in touch with other people interested in charting, so feel free to drop me a line with your questions and
comments. My e-mail address is
flast.qxd 2/8/07 1:09 PM Page xi
Introduction
xi
You also might enjoy my “Technically Speaking” blog, which I try to
update every trading day. The URL is .
Whether or not you use any charting product, you should benefit from
this book. I’ve tried to make it accessible, understandable, and practical
for anyone interested in making better trading decisions. Let me know
what you think, and good luck with your trading!
flast.qxd 2/8/07 1:09 PM Page xii
flast.qxd 2/8/07 1:09 PM Page xiii
About the Author
Tim Knight is the founder of Prophet Financial Systems, a wholly-owned
online software company that was acquired by INVESTools in January
2005; he presently serves as Senior Vice President of Technology for
INVESTools.
An active trader and chartist, Tim founded Prophet in 1992 to provide
market data to self-directed investors using stand-alone technical analysis
software. With the advent of the World Wide Web, he envisioned combining the power of these expensive software packages with browser-based
convenience—enabling traders to focus on their analysis, instead of worrying about software upgrades and database issues. His online technical
analysis suite at Prophet.Net delivers on this vision and more.
In his trading today, Tim relies on technical analysis as the primary basis
for his investment decisions, and he has leveraged his passion for the markets to fuel the innovation for which Prophet.Net is known. In fact, Barron’s
and Forbes magazines have consistently named Prophet.Net the “#1 Web Site
for Technical Analysis.” He writes the popular Technically Speaking blog
every trading day, which can be found at .
Before starting Prophet, Tim was Vice President of Technology Products
at Montgomery Securities in San Francisco, where he led the development of
an institutional online-trading platform. Additionally, he has held various positions in marketing management at Technical Tools and Apple Computer,
and is the author of 20 computer trade books. Tim is a graduate of Santa
Clara University and holds a bachelor’s degree in business management.
He lives in Palo Alto, California with his wife, two children, two dogs,
and a pair of well-behaved computers.
xiii
flast.qxd 2/8/07 1:09 PM Page xiv
flast.qxd 2/8/07 1:09 PM Page xv
Chart Your
Way to Profits
flast.qxd 2/8/07 1:09 PM Page xvi
ccc_knight_001-026_ch01.qxd 1/12/07 2:24 PM Page 1
CHAPTER 1
Technical
Analysis: What
It Is and
Why It Works
Technical analysis is the study of past price movement for the purpose of
predicting future price movement, which, if done correctly, can lead to
substantial trading profits. The prices studied are typically those of financial instruments such as stocks, commodities, and foreign currencies. But
no matter what market is being studied, the underlying principles are the
same. Specifically:
• A price chart is the most perfect representation of the balance of buyers and sellers for any given entity.
• Prices tend to move in trends and patterns which, based on historical
analysis, can lead to statistically meaningful probabilities of future
price movement.
• The close and skilled examination of a price chart can guide a
trader as to how long he should remain in a trade and when he should
exit.
No matter what you trade, technical analysis can make you a better
and more profitable trader. Price charts will consistently provide the most
truthful picture that can be had of a tradable object, because everything
that can be publicly known or speculated is already built into the graph.
You will never get the same pure representation of a stock (or anything
else) from a broker, a newsletter writer, or an analyst. A chart is as good
as it gets.
1
ccc_knight_001-026_ch01.qxd 1/12/07 2:24 PM Page 2
2
CHART YOUR WAY TO PROFITS
THE BULLS VERSUS THE BEARS
Before we get into price charts—and there will be hundreds of them in
this book—let’s examine the basics about what forms a price chart in the
first place: sellers (the supply) and buyers (the demand).
When buyers are more powerful than sellers, prices move up. When
sellers are more powerful than buyers, prices move down. This tug-of-war,
in these simple terms, is behind the trillions of dollars that get traded
every week of the year.
What many people tend to forget is that every time a trade is placed,
each side believes that they are right and the other side of the transaction
is wrong. When person A buys stock from person B, person A believes the
stock is going to go up in price (meaning B is selling too cheap) and person B believes he would rather have the cash than the stock (meaning A is
buying an over-valued, or at least fully-valued, stock).
As a group, the individuals that believe a given instrument is going to
move higher in price are the bulls, whereas the opposing camp, believing
prices for the same instrument will drop, are the bears. And the war between the bulls and the bears, fought over many thousands of different
stocks, options, and commodities every day, is what creates price movement. Analyzing that movement well is what will give you a substantial
edge in the markets you trade.
WHY IS A PREDICTION VALUABLE?
The astonishing thing about technical analysis is not only how far out its
predictive power goes, but also how, even with a future full of unknowns,
it still seems able to see its way clear to make a meaningful prediction. A
staggering number of great forces can wreak havoc with financial markets—scandals, war, governmental chaos, interest rates, terrorist attacks,
earnings surprises, the social climate, and so forth. Through it all, the
knowledgeable chartist can see what others cannot see and know what
seems unknowable.
Let’s take a real-life example with a very long timespan: the Dow
Jones Industrial Average over a period of more than 100 years. Figure
1.1 has two Fibonacci fans drawn on it (don’t worry if you are not familiar with that term; it will be explained in Chapter 13). These fans are
drawn from an extreme low to an extreme high. The first is drawn from
the low in 1903 (the “Rich Man’s Panic,” it was called) to the peak of the
roaring twenties bull market in 1929. The second is drawn from the
ccc_knight_001-026_ch01.qxd 1/12/07 2:24 PM Page 3
Technical Analysis: What It Is and Why It Works
3
FIGURE 1.1 The Dow Jones Industrial Average from 1900 to 2005, enhanced
with two Fibonacci fans.
depths of the depression in 1932 to the peak of the Internet bubble in
January of 2000.
There are a variety of astounding things to note in this chart:
• The point where the two major lines intersect in 1974 predicted the
precise bottom of the massive 1973–1974 bear market.
• The steady climb from 1990 to 1995 was perfectly bounded by two of
the fan lines.
• Most impressive of all, the ultimate market top in 2000 was established by the first fan (which, remember, began 97 years before).
Figure 1.2 is a close-up view of late 1999 and early 2000; as you can
see, the almost century-old fan line creates impressive resistance to these
prices moving higher on four different occasions. If we were in stocks at
this time, this would be a vital warning signal that the top was established.
This is an extreme example, but the point is that being able to gain insight into the most likely future of a particular price is a vehicle for real
trading profits. It is an edge that those not using charts effectively simply
will not have.
ccc_knight_001-026_ch01.qxd 1/12/07 2:24 PM Page 4
4
CHART YOUR WAY TO PROFITS
FIGURE 1.2 Highlighted here four times is the Dow bouncing off the fan line
established over a century earlier.
A WORD ON SHORTING
There will be many times in this book where we will refer to “shorting” a
particular stock or “being short” a stock. It is valuable to understand this
terminology, in case you do not already.
Most people participating in a market are “long” the market; that is,
they own the security with the hope that the price will go up. So if a person owns 1,000 shares of Apple Computer (AAPL) which he bought at $50
per share, and later sells it for $90 per share, he has made $40,000 based
on the long position ($40 per share gain times 1,000 shares).
A person who is short a security has done things backwards: he first
sells a security he does not own for a certain price with the hope that the
price will go down. The reason people are able to sell stock they do not
own (essentially giving them a negative number of shares) is that their
broker has so much of the stock already that it is available to sell with the
promise that, at some point, it will be repurchased to replace the shares
that were sold.
Taking the example of Apple again, an individual might sell short
1,000 shares of Apple at $90 per share. If the stock fell to $50 and the
trader “covered” the position (that is, bought 1,000 shares of the stock,
ccc_knight_001-026_ch01.qxd 1/12/07 2:24 PM Page 5
Technical Analysis: What It Is and Why It Works
5
thus making the broker whole), he would have made $40,000 just as the
other trader did, only he would have done it in the other direction.
The advantages and disadvantages of shorting markets will be discussed near the end of the book, but the principal benefit of shorting is
that you can take advantage of a falling market as well as a rising one. If
you are at the beginning of a bear market, and you can only buy stocks, it
will be very difficult to make money. If you are able to short stocks at high
prices and then buy them back later at low prices, you can make money in
either an up or down market.
The key disadvantage to shorting stocks is that all the big money is
made by going long. The most you can ever make with a short position is
100% (that is, if the stock goes to $0.00, which almost never happens),
whereas the most you can make with a long position is unlimited. You can
definitely make profits shorting markets, but unless you are a brilliant options trader, you will never get rich being a bear (that is, a person betting
on a market going down).
SUPPORT AND RESISTANCE
The world of technical analysis can seem overwhelming to many. There
are hundreds of complex mathematical indicators, studies, patterns, and
rules. But there is absolutely no reason good charting has to be complicated. A trader can set aside all of the complexity and focus on some solid
basics, starting with the ideas of support and resistance.
To illustrate this, think back to the children’s game Red Rover. In
case you don’t remember it, kids split up into two groups, and each group
forms a line by holding hands so that there are two parallel lines of kids
standing across a field from one another. Then one team calls out, “Red
Rover, Red Rover, send Ethan (or some other kid’s name) right over!,”
and the named child rushes headlong into the other line, trying to break
through. If he busts through the line, he gets to choose a person to join
his team.
This image of “breaking through” is exactly what support and resistance are all about, because in the grown-up world of trading, buyers of
securities tend to mass at certain price levels. And those owners will hold
the line at those prices if the security tries to go above (in the case of resistance) or below (in the case of support).
Let’s take a simple, hypothetical example. Suppose a given stock
traded at between $4.95 and $5.05 for many months. Day after day, week
after week, it stayed in this range, accumulating owners of the stock at
around the $5 level. Let’s go on to assume the company has some good
ccc_knight_001-026_ch01.qxd 1/12/07 2:24 PM Page 6
6
CHART YOUR WAY TO PROFITS
news, and the stock goes up to $6, but subsequent profit-taking pushes the
stock back down again.
Given this circumstance, you can rest assured that it’s unlikely the
stock is going to drop beneath about the $5 level. The reason is that
there’s a huge number of owners at that level, and they are simply not going to sell. Fear and greed are the primary drivers of the market, and in
this case, greed is going to come first (meaning the owners are telling the
market “I refuse to sell my stock at this price for a breakeven trade. I want
a profit.”). If something remarkable happens and it shoves the stock down
to, say, $4.50, the fear starts to take hold (“I am worried my losses will go
even higher, so I’m going to sell now while I still have the chance.”), which
means the selling will feed on itself.
Expressed in economic terms, the stock price found equilibrium at
the $5 level, thus amassing a large number of owners. If the stock price
challenges that level again, equilibrium will once more take hold, stabilizing the price. The people owning stock at this level constitute resistance—the “Red Rover” line will hold fast, unless a very powerful force
punches through it.
Support, therefore, is a price level at which prices are prone to stay
above. Resistance is a price level at which prices are prone to stay below.
So these are reliable levels at which to count on a pause in price movement, unless the levels are violated, which is where the real action is.
WHAT HAPPENS WHEN PRICES PUNCH THROUGH?
The time when profits are made is when prices push through support or
resistance and break out. The longer a price has been trying to push
through a certain price level, the more forceful it will be when it finally
does make it through (think back to our Red Rover game, and picture a
particularly eager youngster who has tried ten times to get through the
line and is more determined than ever to do so).
Figure 1.3 is an example of how potent this is. The first half of the
stock chart for ALVR shows prices bouncing between about $2.00 and
$2.50. For month after month the stock was completely stagnant, and buyers were accumulating at these levels. There were several attempts to
push through resistance (represented by the horizontal line), but they
failed . . . until the midpoint of the graph, in April.
At that point, three important things happened: (1) buyers overcame
sellers, pushing prices above resistance; (2) volume increased as excitement began to build around the stock; and (3) when some profit-taking
took place, prices eased back, but they did not go beneath the former line
ccc_knight_001-026_ch01.qxd 1/12/07 2:25 PM Page 7
Technical Analysis: What It Is and Why It Works
7
FIGURE 1.3 After breaking out of a saucer pattern, ALVR blasted ahead on
much bigger volume to a 500% gain in about a year.
of resistance. From that point, the stock moved up about 500% in the
course of a year.
The concept of how resistance can change into support (and vice
versa) is critical to your understanding of reading a chart. Any sort of
line—be it a trendline, a channel, a horizontal line—has two faces to it:
support and resistance. Once prices cross a line, the nature of that line
changes. As you will learn later in the book, if a price crosses a line more
than once, the line becomes meaningless and should probably be deleted.
Let’s take another look at resistance to see how valuable it is to have
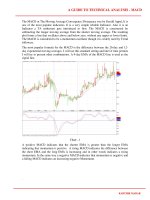
an awareness of price behavior at certain levels. Figure 1.4 shows the
stock for Chesapeake Energy (symbol CHK) over a period of about half a
year. Early on, the price was blasting skyward to a new high, then it
slumped down through August. It then regained its footing and mounted a
new assault on higher prices, but it was repelled again at about the same
level. A couple of months later, in November, a third attempt was made to
push past the $34 barrier, but it failed a third time. You can imagine the
frustration and exasperation of the owners of this stock as they kept seeing their stock getting shoved away from higher prices.
What the market was telling the owners of this stock was: “You’re not
going to go any higher.” The supply of stock (those selling it) was creating
what is known as overhead resistance. Perhaps some people who bought
ccc_knight_001-026_ch01.qxd 1/12/07 2:25 PM Page 8
8
CHART YOUR WAY TO PROFITS
FIGURE 1.4 This is known as a triple top, where a new high happens three
times, but the price can’t get above it. Once the attempts at overcoming this resistance failed, the stock collapsed.
FIGURE 1.5 After its triple top, CHK went on to a nearly 99% decline in price.