A GUIDE TO TECHNICAL ANALYSIS- MACD
Bạn đang xem bản rút gọn của tài liệu. Xem và tải ngay bản đầy đủ của tài liệu tại đây (637.83 KB, 24 trang )
A GUIDE TO TECHNICAL ANALYSIS - MACD
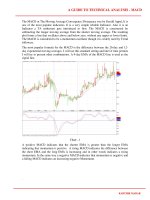
The MACD or The Moving Average Convergence Divergence was by Gerald Appel, It is
one of the most popular indicators. It is a very simple reliable Indicator. Also it is an
Indicator a TA enthusiast gets introduced to first. The MACD is constructed by
subtracting the longer moving average from the shorter moving average. The resulting
plot forms a line that oscillates above and below zero, without any upper or lower limits.
The MACD is considered to be a momentum oscillator though it is widely used by Trend
followers.
The most popular formula for the MACD is the difference between the 26-day and 12-
day exponential moving averages. I will use this standard setting and later if time permits
I will try to present other combinations. A 9-day EMA of the MACD line is used as the
signal line.
Chart –1
A positive MACD indicates that the shorter EMA is greater than the longer EMA
indicating that momentum is positive. A rising MACD indicates the difference between
the short EMA and the long EMA is increasing and in other words indicates a rising
momentum. In the same way a negative MACD indicates that momentum is negative and
a falling MACD indicates an increasing negative Momentum.
.
KARTHIK MARAR
A GUIDE TO TECHNICAL ANALYSIS - MACD
Three common signals
1. MA cross over or signal line crossover. The basic and the most common is the signal
line cross over. Buy when the MACD line crosses above the signal line and Sell when the
MACD line crosses below the signals line.
2. Zero Line crossover. Some use only the zero line cross over as signals. Buy when the
MACD line crosses the zero line and Sell when the MACD line crosses below the zero
line.
3. Divergences
Let us see in a little detail what happens when the moving average cross over and zero
line cross over occurs.
Let us assume that the stock is in a downtrend and the MACD is below the zero line and
below the signal line. Then when the Bullish moving average cross over (MACD
crossing the signal) occurs the shorter EMA has started converging towards the long
EMA indicating the negative momentum is waning. It does mean that the bullishness
will continue. It may or may not. So a Buy when the Bullish cross over occurs does not
always produce a good trade.
Now consider when the stock is in an up trend and the MACD is above zero and the
signal line. If a Bearish cross over occurs (MACD crossing below the signal line) the
short EMA has started to converge towards the long MA indicating that the positive
momentum is waning. It again does not indicate that bearishness has set in. It may be just
a pull back. The stock may dip and then continue its journey upwards.
When the MACD cross above the zero line it mean that the short EMA has actually
crossed over the long EMA indicating that the momentum has indeed reversed from
negative to positive. In the same manner the when the MACD crosses below the zero line
it means the momentum has turned negative. The Bullish zero line cross over generally
gives better trades. But many times it will notice you are entry is much delayed. The
Bearish zero line cross over gives too much of your profits and some time one loses
money too.
To summarize
1. Buying based on Bullish MA cross over does always produce good trades.
However in many cases this does helps in early entry points. How to distinguish is
the problem. Combining with other Indicators may help. We will explore this
later.
KARTHIK MARAR
A GUIDE TO TECHNICAL ANALYSIS - MACD
2. Selling based on Bearish MA cross over may take you out of the trade too soon.
Again combining with other Indicator may be of help in deciding if it is time to
get out.
3. Bullish zero line cross over generally prove profitable. The drawback again the
entry point may be delayed in many cases.
4. Selling based on Bearish zero line cross over may give away too much of your
profit. A trailing stop may help in over coming this issue
Chart-2 illustrates some of these points.
KARTHIK MARAR
A GUIDE TO TECHNICAL ANALYSIS - MACD
One of the most important signals based on the MACD is DIVERGENCE. We will
postpone discussion on this till little later.
Now Let us take a deeper look at the MACD charts and try to learn a little more about the
additional signals that we get and how to trade them.
So far we were talking about Bullish crossover after a downtrend. In this case the Bullish
crossover occurred below the zero line. However the Bullish crossover can occur above
the zero line. Such crossover occurs when the stock dips temporarily before proceeding
with the up trend. Such crossovers above the zero line produce some excellent trades.
Bearish crossovers occurring above the zero line generally acts as warning signals as it
indicates waning of the positive momentum. Bearish crossover below the zero line
indicates strong bearishness.
For the making the discussion more interesting we will first make a system with the
following criteria.
BUY when there is a Bullish MA crossover.
SELL when there is a Bearish MA crossover.
Additionally the zero line bullish crossovers will be marked with an encircled number 1
with an arrow pointing upwards in order to indicate that the momentum has indeed
reversed.
Bullish crossovers above the zero line will be marked an encircled number 2 and arrow
pointing upwards indicating good trade opportunities.
Similarly bearish crossover above the zero line will marked 3 and bearish crossover of
the zero line will be marked 4.
A chart and an Indicator with these signals enclosed
Next we will see if we can find more signals…
KARTHIK MARAR
A GUIDE TO TECHNICAL ANALYSIS - MACD
Chart-3
DIPs and HOOKs
Let us look at a situation when the stock is in an up trend and the MACD line is above the
signal line. You will notice that the MACD line temporarily converges towards the signal
line and diverge again. We will call them DIPs.
Some times the MACD line even briefly dips below the signal line and bounce back. We
will call these HOOKs.
The DIPs and HOOKs normally indicate brief pullbacks in the up trend and provide
good add-on or pyramiding opportunities.
In the same manner DIPs and HOOKs occur during the downtrend when the MACD line
is below the signal line. These indicate temporary pull up during down trends and present
good shorting opportunities.
Chart-4 present examples of the “Dips” and “Hooks’ during a up trend.
KARTHIK MARAR
A GUIDE TO TECHNICAL ANALYSIS - MACD
Chart-4
It will be nice if we can indicate the “Hooks” on the Indicator and the chart. We will
represent the DIPs during the up trend as green dots on the Indicator and green up arrows
on the charts. Green stars will represent the HOOKs. On the Chart the HOOKs will be
coincide with a BUY.
In the same way DIPs during a downtrend will be represented by an orange dot on the
Indicator and an orange down arrow on the chart. The HOOKs will be represented by a
orange star and will be accompanied by a sell signal on the chart.
The DIPs are good add-on/short term trade opportunities during the up trend and good
warning points during the downtrend.
KARTHIK MARAR
A GUIDE TO TECHNICAL ANALYSIS - MACD
The HOOKS represent a stronger Buy/Short opportunities if we combine with other
indicators. Sideways markets produce lot of alternating Hooks
Of course we have to have a lot of discretion when we used the Dips and Hooks. Later
we will take some example to see how we can use these additional signals.
KARTHIK MARAR
A GUIDE TO TECHNICAL ANALYSIS - MACD
Zero line Rejects
Finally we will look at what is commonly known as “ZERO LINE REJECT” or ZLR.
Take a situation when the MACD Line starts converging from top above the Zero line
towards the zero line. At times the MACD line reverses and just near the zero line and
starts climbing up again. At times the MACD line penetrates the zero line a little and
starts reversing. These reversals many times produce excellent trades. These reversals
just above the zero line or after just penetrating the zero line are called the Zero line
rejects. The situation described above will be Bullish ZLR. A bearish ZLR occurs when
the MACD line climbs from the bottom towards the zero line and reverses just below the
zero line or after just penetrating it.
Of course one should be quite careful trading the ZLR as it may be a temporary reversal.
Working with tight stop losses can produce some excellent trades.
Chart-6 shows some Bullish ZLR.
KARTHIK MARAR
A GUIDE TO TECHNICAL ANALYSIS - MACD
Now we have some basic tools like Zero line crossovers, MA crossovers, Dips and
Hooks. Without complicating further with Histograms we will see how to trade better
these signals.
Trading MACD better combining with other Indicators
Well, we have many signals now. How do we differentiate which are better signals?
Trading just with the MACD does not provide much clue. If we combine with some other
indicators we may get some more clues.
Combining with ADX provides some good additional clues and we can differentiate
which are better signals. I call these signals Power Buys, Power Dips and Power shorts.
We will take up some example and define some basic rules, which can be consistently
followed.
RULE : All Bullish signals Buys, Dips, Hooks, Zero line crossover are generally good
when the Both the ADX and DI+ are rising. To differentiate these from other signals we
will call then Power Buys, Power Dips etc.
Example -1
KARTHIK MARAR