Evaluating runoff generation and water quality at a small forested catchment study case luot mountain at vfu in xuan mai town, hanoi capital, vietnam
Bạn đang xem bản rút gọn của tài liệu. Xem và tải ngay bản đầy đủ của tài liệu tại đây (528.47 KB, 30 trang )
MINISTRY OF AGRICULTURE AND RURAL DEVELOPMENT
VIETNAM FORESTRY UNIVERSITY
STUDENT THESIS
Evaluating runoff generation and water quality at a small forested catchment
Case study: Luot mountain at VFU in Xuan Mai town, Hanoi capital, Vietnam
Major: Advanced Curriculum in Natural Resources Management
Code: D850101
Faculty: Forest Resources and Environmental Management
Student: Vu Duong Ly
Student ID:0954011529
Class: K55 Natural Resources Management
Course: 2010 – 2014
Advanced Education Program
Developed in Collaboration with Colorado State University, USA
Supervisor: Dr. Bui Xuan Dung
Hanoi, November 2014
ACKNOWLEDGEMENT
I would like to express my sincere gratitude to Dr. Dung and Prof: Lee Mac
Donald providing continuous encouragement and enthusiastic support during the research
work in. I greatly appreciated the help provided for by the weather station and laboratory
work at Vietnam Forestry University, and would especially like to thank Ms. Diem, Mr. Le
who helped me directly.
TABLE CONTENT
ABSTRACT .......................................................................................................................... 1
I. INTRODUCTION ............................................................................................................ 2
II. OVERVIEW OF THE PREVIOUS RESEARCH ISSUES ........................................ 4
2.1. Overview ........................................................................................................................ 4
2.2. Limitation of the previous studies ............................................................................... 5
III. OBJECTIVE, SCOPE, CONTENT OF THE STUDY .............................................. 6
3.1. Objective ........................................................................................................................ 6
3.2. Scope .............................................................................................................................. 6
3.3. Contents ........................................................................... Error! Bookmark not defined.
IV. STUDY SITE AND METHOD .................................................................................... 7
4.1. Study site........................................................................................................................ 7
4.2. Method ........................................................................................................................... 8
4.2.1. Rainfall monitoring .................................................................................................... 8
4.2.2. Catchment runoff monitoring .................................................................................... 8
4.2.3. Observating water quality of catchment runoff ......................................................... 8
V. RESULT AND DISCUSSION ..................................................................................... 13
5.1. Characteristic of runoff generation........................................................................... 13
5.2. Runoff component....................................................................................................... 16
5.3. Water quality and characteristic of catchment ........................................................ 19
VI. CONCLUSION ............................................................................................................ 24
REFERENCES................................................................................................................... 25
LIST OF TABLE
Table 1: Climate- Hydrology indicator at Xuan Mai (Ba Vi weather station) ................... 7
Table 2: Physical and chemical materials ........................................................................... 9
Table 3: Parameters index .................................................................................................. 23
LIST OF FIGURES
Figure 1.Location of study site and rainfall, runoff monitoring ........................................ 6
Figure 2. Runoff generation in forested headwater catchment over time ........................ 13
Figure 3.Characteristic of (a) Rainfall storm;(b) storm runoff;(c)Runoff coefficient in
over storm event .................................................................................................... 14
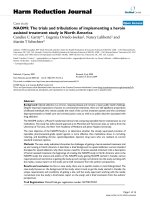
Figure 4: The relationship between Rainfall and runoff through all storm events ......... 15
Figure 5: Schematic illustration of hydrograph separation analysis. .............................. 16
Figuge 6: Characteristics of runoff components at study catchment ............................... 17
Figure 7: The relationship between quick runoff and rainfall ......................................... 17
Figure 8: The relationship between delayed runoff and rainfall .................................... 18
Figure 9: Total suspend sediment and rainfall ................................................................. 19
Figure 10: The relationship between TSS and (a)runoff; (b) precipitation ..................... 20
Figure 11: The DO responses to rainfall ........................................................................... 21
Figure 12: pH and rainfall in over time ............................................................................ 22
ABSTRACT
To evaluate runoff generation and water quality at a small forested catchment, we
conducted and monitoring station, collected da from weather station and examined some
water quality index (suspend sediment, DO, pH, Chloride, Nitrite, Sulfate) in Luot
mountain at VFU in Xuan Mai town, Hanoi capital, Vietnam. This study began form 17th
July to 23th September. Based on hydrographic analysis for nine storm events, we found
that mean storm precipitation was 139 mm per storm. Mean storm flow was 114 mm,
corresponding to 82.3% of the runoff coefficient. Total rainfall in over study time is 1248
mm where total runoff is 906mm. The runoff coefficient is 72.6%. The highest
precipitation is 399mm (2sd to 5th September) when amount of runoff is 326mm. The runoff
coefficient is 81.7%; the lowest precipitation is 17mm while amount of runoff is 12mm.
This coefficient reaches 70.2%. This study is a good way to assess the relationship between
plantation and hydrological process, assessing the impact of plantation to water quantity
and quality. Findings of this study will provide an important scientific basis to enhance the
protective function of forests planted for Vietnam
1
I. INTRODUCTION
Water is one of the most important factors of natural resources which is necessary
for human, ecosystem, and the economic development in mountain and non-mountain
areas (FAO, 2005). However, the quantity and quality of fresh water not only in many
regions of Vietnam but also in the world (Marzocchi et al. , 2009) are increasingly
endangered by overuse, misuse, pollution, and especially changing land cover caused by
shifting cultivation. It is increasingly recognized that both are strongly influenced by
forests to water resource because forest maintains water quality through the stable soil,
reduce erosion, sediment, and the pollutants from hill slope. Forests also affect the amount
of available water in keeping a canopy on rainfall, evaporation of moisture from the
surface plant, maintain soil moisture, collect water from fog and maintain of soil
infiltration rate. They also affect the time of water transport by maintaining or improving
the permeability and the ability to accumulate water in the soil (Bosch and Hewlett, 1982).
Beside this, climate change is altering forest’s role in regulating water flows and
influencing the availability of water resources (Bergkamp, Orlando and Burton, 2003).
Moreover, with temperature climate and slope terrain the, threats of water degradation in
Viet Nam is very serious. Therefore, the relationship between forests and water is a critical
issue that must be accorded high priority. Management of forest resources has correlation
relationship to water resource management and land conservation through changing the
amount, timing runoff and soil erosion (FAO, 2005).
Beside this the problems of controlling water quality and quantity, along with
managing freshwater fisheries, have also become more complex (Valentinet at., 2008). The
effects on the hydrological environment will significantly increase if no efforts are made to
minimize the potential impacts. Sustainable management of water catchments is one of the
options that have to be considered to ensure all development activities have an acceptable
impact on both water yield and water quality. However, the lack of scientific information on
2
catchment runoff is hindering the development of solutions and policies in environmental
protection and the mitigation of natural hazards in Vietnam. Therefore, to tackle these
environmental issues, field-oriented observation is necessary. In this context, we can assess
and develop the management of water quality in forest catchment in Viet Nam
The plantation area in Luot mountain of Vietnam Forestry University have been
planted since 1984 when the school was arrived to Xuan Mai. Forest ecosystems are
planted at Luot mountain is a vital part of training to perform the tasks of the school. In
addition, since most appear plantation views have said that they are daily flow regulation
and improve water quality for the region. To understand the opinion of flow regime and
water quality from plantation, we installed a monitoring station to measure runoff and
precipitation in a 1.6ha mountainous forested catchment at Luot Mountain owned by
Vietnam Forestry University, Hanoi and conducted the study entitled “Evaluating runoff
generation and water quality at a small forested catchment”. This study is a good way to
assess the relationship between plantation and hydrological process, assessing the impact
of plantation to water quantity and quality. Findings of this study will provide an important
scientific basis to enhance the protective function of forests planted for Vietnam.
3
II. OVERVIEW OF THE PREVIOUS RESEARCH ISSUES
2.1. Overview
Overland flow and water quality have been researched for many years in hydrology
which was born in many years ago. They are applied in producing and reached certain
achievements. The traditional hydrology developed Horton runoff theories in 1930s and 1940s
to research surface runoff formation mechanism. For 30 years of research ( Forster G R,1982)
[31]. Hibbert A R, (1967) [32], by the empirical observations which showed that rainfall
intensity is usually smaller than the potential speed of water absorption in Forestry. The
Hydrology researches in slope terrain developed very fast and instead of ZHANG, 1989 [7]
runoff super absorbent theory to form the runoff generation mechanism theories.
In recent years, there have been many overland flow research such as
Moltranov.A.A.(1960, 1973), Matveev P.N (1973) Santra Reginal (1989), Giacomin
(1662)(cited by Anh.K.P [11]… One of the most comprehensive researches which
conducted in Russia, is Moltranov researcher. He confirmed that, forest soil is possible to
transfer water from surface water to groundwater where the area has 25o-30o of slope. The
drier soil effect of forest in Russia realizes not only in swamps but also in Middle Asia
which has low rainfall. In Africa, the first overland flow research was established by Hallet
professor at Preotoria university in 1929 (Hudson,1981). Generally, Forest soil has high
infiltration capacity and low overland flow appearance ( Douglass, 1977; Prichett, 1979) (
cited by Dien[5]). However, when forest are cut down to lead high slope and bare soil can
make increase amount of water for overland flow (Ruxton BP, 1967 ; Imenson AC and
VIS, 1982) ( cited by Dien [5])
One of the characteristics that related with runoff is permeable. Darcy law’s is the
typical research about infiltration. Base on this, precipitation falls down directly to soil is
very high. This law proves that with higher infiltration the overland flow is lower.
4
Rainfall characteristic still affect to runoff. In Australia, when Oloughlin researched
Hydrology in eucalyptus forest, he concluded that overland flow has linear relationship with
precipitation by the formation: y= a+bx; whereas x is precipitation, y is overland flows
The results from previous studies in Vietnam and other countries in southeastern
Asia showed a large difference in annual runoff coefficients (calculated by dividing annual
runoff by precipitation) among countries and different regions within countries. The
biggest mean annual runoff coefficient was found in Vietnam (27.4%), while the smallest
was found in Indonesia (2.1%). However, within a country, the annual runoff coefficient
was very different across regions. The mean annual runoff coefficients in Laos and the
Philippines were 13.3 and 7.6%, respectively.
Potential reasons in among countries and regions are differences in catchment
scale, annual precipitation, and/or land use type. These findings suggested that the study
site for our field trip studying water resource management in Vietnam had to be established
in Vietnam itself because of the wide variety of runoff coefficients across regions.
In Viet Nam, runoff and erosion was researched in 1970s. But from 1995 to now,
this problem has concerned more and more. The relationship between runoff and erosion
has talked by Quynh and Dien(1991). One of the most important results is the overland
flow quantitative formula for tropical forest like Viet Nam.
2.2. Limitation of the previous studies
Although there are many researches which study in runoff and erosion, are
conducted by many professors in the world, but they still have some limitation such as:(1)
Runoff generation and formation was studied a long time ago but the systematic hasn’t
enough;(2) Most of studies just stop in description level and low quantitative and lack of
Mathematic models to ensure confidence to descript runoff generation process. On the
other hand, Vietnam still uses old methods and equipment than other countries to measure
runoff generation and lack of data water quality in forest catchment.
5
III. OBJECTIVE, SCOPE OF THE STUDY
3.1. Objective
The main objectives of this study include: (1) Evaluating runoff generation a small
forested catchment and (2) examing water quality characteristics of forested catchment
3.2. Scope
The scope of research is about (1) The study site belongs to the forested catchment
at Luot Mountain owned by Vietnam Forestry University, Hanoi;(2)Runoff generation
characteristics and water quality observed in natural raining
Weather station
Road
20oN
Gauging
station
Study site
Weather station
16oN
Catchment
12oN
104oE
108oE
Gauging station
Figure 1.Location of study site and rainfall, runoff monitoring
6
IV. STUDY SITE AND METHOD
4.1. Study site
Study site belongs to in a small catchment at Luot mountain which is owned and
managed by Forestry Viet Nam University in Xuan Mai town-Chuong Mi commune –Ha
Noi. It’s far 35km from Ha Noi in the North-West and 45km from Hoa Binh city in the
South – East. This belongs to: 20o58’in the North and 105o05’ in the East. It ‘s near the
High Way 21st in the West, Xuan Mai town in the South and Hoa Son District Luong Son
commune Hoa Binh province in the North and South
Luot is the low and medium mountain, this topology is simple. It is formed by 2 closed
hills. The average slope is from 150 to 250. The highest peak hill is 133m, the other is 76m. The
catchment is covered mainly by acacia, pine, eucalyptus, and some native tree plantation.
Study site has 2 main seasons. Rainy season begin from April to October and dry
season starts from November to March in the next year. The detail is as table below
Table 1: Climate- Hydrology indicator at Xuan Mai (Ba Vi weather station)
Month
Precipitation(mm)
Temperature(0C)
Moisture (%)
1
30
15.7
85.1
2
40
17.1
85.8
3
47
19.9
84.4
4
112
23.5
97.0
5
287
27.1
84.0
6
284
28.5
82.1
7
340
28.4
83,0
8
360
27.9
85.6
9
286
26.8
85.0
10
273
24.1
83.3
11
54
20.5
82.0
12
12
17.2
81.1
Mean
177
23.1
84.8
7
Temperature regime: Mean temperature per year is 23.10 C, the highest temperature
is 28.50C(June), the lowest temperature is 15.70C (January). Precipitation regime: Mean
annual precipitation is 2125 mm. Highest mean precipitation is 360mm (August); Lowest
mean precipitation is 12mm (December).There are 210 rainy days per year. Moisture
regime: The study site has high moisture which the distribution doesn’t same between
months in year. The annual mean moisture is 84.8 %, The highest is 97.9% in April, the
lowest is 81.1% in December
4.2. Method
4.2.1. Rainfall monitoring
The rainfall data was collected from 15th July to 23 September by US rain gauges
for storm event and by tipping bucket rain gauge of VFU weather station for hourly data.
4.2.2. Catchment runoff monitoring
Instruments for the monitoring station is a Parshall flume. The flumes were fixed on
the exposed channel bedrock and sealed to avoid leakage of stream water. Thus, we assumed
that all of the storm flow and baseflow was captured at the flumes. Water level was monitored
in the flumes and discharge was calculated using the formula for the specificsize of Parshall
flume based on water depth (Herschy, 1985). After that I used Omnilog 7 software to
download this Parshall Flume data and Microsoft Excel to process data.
4.2.3. Observating water quality of catchment runoff
We collected some index of physical, chemical parameters: temperature,,
conductivity, sulfate, sediment, DO, Chloride and NO2 that can show water quality
characteristics. All of materials used as table below:
8
Table 2: Physical and chemical materials
pH indicator
pH
Glass-stoppered,
Dissolved Oxygen 1 Reagent Powder Pillows
Dissolved Oxygen 2 Reagent Powder Pillows
DO
Dissolved Oxygen 3 Reagent Powder Pillows
Measuring Tube, plastic
Sodium Thiosulfate Standard Solution, 0.0109N
Starch Indicator Solution,
Sulfaver4 Powder Pillows
Dipstick, Sulfate, Measure
Sulfate
ClipperCylinder,
graduated, polymethylpentence
Chloride 2 IndicatorPowder Pillow
Chloride test measuring
Silver Nitrate solution
Color Comparator Box
Nitrite test measuring
Color Viewing tubes, plastic
NitriVer powder pillows for 5-mL sample
a. pH
I used pH indicator paper to measure pH after waiting 15s when I put this to water
sample to read result.
b. Suspend sediment(SS):
I calculated SS by 4 steps as below:
1. Collect 25mm of water in VFU Forest small ponds below flume
9
2. Use filter to keep sediment.
3. Make some samples (sediment, sediment+filter,tin)
4. Measure weight of sediment.
c. DO in the field
To calculate DO, it includes 12 important and carefully steps. There are:
1. Submerge the glass – stoppered DO bottle in the water to be tested. Allow it to
fill to the top. Note: collect and prepare the sample in the DO bottle. Transferring the
sample from one container to another could contaminate it with atmosphere oxygen.
2. Be certain that no air bubbles are present by inclining the bottle slightly and
inserting the stopper with a quick thrust. This will force air bubbles out of the sample. If
bubbles become trapped in steps 2 or 3, the sample should be discarded and the test begun
again. Note: start the test immediately after collecting the sample.
3. Carefully remove the stopper from the bottle. Add the contents of one Dissolved
Oxygen 1, and one Dissolved Oxygen 2 Reagent Powder Pillow stopper the bottle firmly
to avoid trapping air.
4. Grip the bottle and shake vigorously. A delay in mixing the solution may result
in the powder not dissolving properly. A flocculent precipitate will form. If oxygen is
present, the precipitate will be brownish – orange. A small amount of powdered reagent
may remain at the bottom of the bottle. This will not effective the results.
5. Allow the sample to stand until the floe has settled half-way and the upper half
on the bottle is clear
6. Shake the bottle again
7. Allow the floe to settle again
8. Remove the stopper add the contents of one Dissolved Oxygen 3 Reagent
Powder Pillows
10
9. Carefully replace the stopper and shake to mix. The Floe will dissolve and a
yellow color will develop in the presence of oxygen. This is the prepared sample
10. Fill the plastic measuring tube to the top with the prepared sample
11. Pour the contents of the tube into mixing bottle
12. Add Sodium Thiosulfate Standard Solution, 0.0109N one of drop at a time to
the contents of the mixing bottle. Swirl the bottle after each drop. Count each drop.
Continue until the sample changes from yellow to colorless
d. Chloride
Chloride was checked by titration measuring through 4 steps below:
1. Fill the mixing bottle to the 23-mL, mark with sample
2. Add the contents of one chloride 2 Indicator Powder Pillow, Swirl to mix
3. Add Silver Nitrate Solution one drop at a time. Swirl the bottle after each drop is
added. Count each drop until the sample changes from yellow to red-brown
4. Total drops *12.5 = mg/L sodium chloride (NaCl)
e. Nitrite
To measure Nitrite I did 5 steps which are
1. Rinse a viewing tube several times with sample, then fill to 5mL, mark
2. Add the contents of one Nitriver 3 Powder Pillow for 5mL sample
3. Stopper the tube and shake vigorously for exactly 1min.
4. Allow this prepared sample to sit undisturbed for 10 not more than 15min
5. Because no appearing pink color so after placing the tube into right opening of
the Color Comparator, filling another tube the 5mL, mark with untreated sample so this is
not the differences between 2 tubes
f. Sulfate
Here is sulfate test processing:
1. Fill the sample mixing bottle o the 25mL mark
11
2. Use the clipper to open one Sulfaver4 Powder Pillows. Add the contents of the
pillow to the mixing bottle. Press the cap on tightly and shake the bottle for 15s
3. A white turbidity will appear if sulfate is present
4. Allow the sample to stand 5min
5. Invert the bottle to mix any solid left on the bottom. Remove the capon the
mixing bottle and slowly pour the contents into the clean 25mL graduated cylinder
6. Hold the cylinder in the vertical position. While looking straight down into the
cylinder slowly insert the sulfate dipstick down into the cylinder until the black dot
disappears completely. Hold the dipstick in that position are rotate the cylinder and
viewing the scale on the dipstick through the non-graduated portion of the cylinder
7. Read the concentration by looking across the sulfate of the sample to the scale
on the dipstick. The number on the dipstick scale that meets with the surface of the sample
corresponds to mg/L of sulfate in the sample
8. If the black dot disappears before the first test mark( 200mg/L), the
concentration of sulfate is greater than 200mg/L. If the black dot does not disappears after
the dipstick is inserted to the cylinder bottom, the surface concentration is less than
50mg/L
12
V. RESULT AND DISCUSSION
5.1. Characteristic of runoff generation
Figure 2. Runoff generation in forested headwater catchment over time
From this figure we can see that catchment runoff quickly responded to precipita
tion inputs. Increased rainfall intensity corresponded to increased runoff at
catchments. There were 9 rain storms that I chose during the study time. The range of
precipitation ranged from 0.05 to 3.3mm when the range of runoff is from 0.02 to 1.8mm.
The highest rainfall is 3.3mm which belong in storm 9th where the runoff value is 1.8mm.
13
Rainfall
0
50
100
150
200
Rainfall
250
300
a
mm
350
Runoff
400
450
450
400
350
300
250
Runoff
200
b
150
100
50
0
Runoff coefficient
%
100
90
80
70
60
c
50
Runoff coefficient
40
30
20
10
0
1
2
3
4
5
6
7
8
9storm event
Figure 3.Characteristic of (a) Rainfall storm;(b) storm runoff;(c)Runoff coefficient in
over storm event
14
Based on hydrographic analysis for nine storm events (figure 3), we found that
mean storm precipitation was 139 mm per storm. Mean storm flow was 114 mm,
corresponding to 82.3% of the runoff coefficient. Total rainfall in over study time is 1248
mm where total runoff is 906mm. The runoff coefficient is 72.6%. The highest
precipitation is 399mm (2sd to 5th September) when amount of runoff is 326mm. The runoff
coefficient is 81.7%; the lowest precipitation is 17mm while amount of runoff is 12mm.
This coefficient reaches 70.2%. We can easy the runoff generation trend depends so much
on the rainfall. When rainfall increases, the runoff increases. When there is no rain, there is
no runoff
Runoff
mm/Storm
350
y = 0.817x - 0.69
R² = 0.9645
300
250
200
150
100
50
0
0
100
200
300
400
500
Precipitation(mm/storm)
Figure 4: The relationship between Rainfall and runoff through all storm events
To check the close relationship between rainfall and runoff we can see figure 4.
When rainfall increases the runoff increases by the formula: y = 0.817x-0.69 with R² =
0.999. That means in small catchment, most of rainfalls become runoff
15
5.2. Runoff component
Quick runoff = Storm flow
Discharge (mm)
Delayed runoff = Base flow
Event
Separation line
Y aT b
Quick runoff
Delayed runoff
Time (T)
Figure 5: Schematic illustration of hydrograph separation analysis.
The separation line is Y=at+b where b is the first value. Because this is a small and
ephemerid catchment so runoff has 2 components. That why delayed runoff is the equal of
runoff value minus quick runoff value
Runoff has two components which are quick runoff(overland flow) and delayed
runoff(base flow) (Figs: 6-8). Base flow comprised 53 mm (corresponding to 46.7% of
storm flow)and overland flow comprised 61 mm (corresponding to 53.3% of storm flow).
Overland flow was defined as that part of the runoff that enters streams during and
immediately after precipitation via overland flow and fast subsurface flow. Base flow was
defined as slow soil water movement and bedrock outflow process in the forested
catchment at Luot Mountain owned by Vietnam Forestry University, Hanoi.
16
delayed runoff
quick runoff
1
2
3
4
5
6
7
8
9
Figuge 6: Characteristics of runoff components at study catchment
Through the formula in Figure 5 we can calculate the runoff components. These
separate runoff components enabled a qualitative evaluation of underlying dominant runoff
pathways. And we can see that percent of quick runoff is bigger than delayed runoff. Quick
runoff ranged from 38% to 62% where the range of delayed runoff is from 38% to 62%.
The mean of quick runoff is 52.7% where delayed runoff exposes 47.3%. This suggested
that overland flow is the dominant hydrological processes. And we know that quick flow
has the close relationship between erosion. This is one of big problem we should concern
200
Quick runoff
(mm/storm)
180
160
140
120
100
80
y = 0.4427x + 4.0952
R² = 0.9646
60
40
20
0
0
100
200
300
400
Figure 7: The relationship between quick runoff and rainfall
17
500
The fig 7 is the way to examine the relationship between quick runoff and rainfall.
When runoff increases, quick runoff increases the value by the formula: y = 0.442x + 4.095
with R2 is so high R² = 0.964. Its mean this is the very close relationship. The rainfall
changes from 13mm to 399mm where quick runoff swing from 7mm to 166mm. The mean
of quick runoff is 61mm (53.3%) where mean of rainfall is 139mm. We can say that quick
runoff depends so much on rainfall
180
Delayed
runoff(mm/stor
m)
160
140
120
100
y = 0.3933x - 3.9799
R² = 0.8609
80
60
40
20
0
0
100
200
300
400
500
Rainfall (mm/storm)
Figure 8: The relationship between delayed runoff and rainfall
Through the fig 8, we can check again the relationship between delayed runoff and
rainfall. When rainfall ranged from 13mm to 399mm, base flow reaches from 38% to 62%.
The relationship formula between base flow is y = 0.393x - 3.979 with R² = 0.860
We can see overland flow depend more and more on amount rainfall. The
relationship between overland flow is close than base flow through R.
18
5.3. Water quality and characteristic of catchment
a. Suspend sediment
Standard TSS (B1)
Figure 9: Total suspend sediment and rainfall
Total suspended sediment (TSS) are particles that are larger than 2 microns found
in the water column. Anything smaller than 2 microns (average filter size) is considered a
dissolved solid. Most suspended solids are made up of inorganic materials, though bacteria
and algae can also contribute to the total solids concentration.
19
TSS is one of the most water quality measurements. From fig 9, we can realize the
TSS trend which depends more and more on rainfall. When rainfall increases, TSS
quantity increases. The highest storm(399mm), the highest TSS value(97mg/L). The range
of TSS is from 3mg/L to 97mg/L. The mean of TTS is 35.7 mg/L. The range of average of
suspend sediment is from 0.261mg/L to 0.291mg/L. All off storm events has lower TSS
than TSS standard (for aquatic life).This is a good condition for aquatic life development
Figure 10: The relationship between TSS and (a)runoff; (b) precipitation
We know when rainfall increases, runoff increases. Beside this rainfall and TSS has
closed relationship. Moreover, the relationship between TSS and total runoff is very closed
when the trend line of TSS is the formula y = 0.166x1.084 with R² = 0.995
We can see TSS increases too when runoff increases. I suggested that TSS depends on
runoff. When runoff increases TSS increases by the formula y = 0.277x1.022 with R² = 0.989
By this we can realize, the relationship between rainfall and TSS is closer than
runoff and ones through R2
20