Synthesis, characterization of novel ZnOCuO nanoparticles, and the applications in photocatalytic performance for rhodamine B dye degradation
Bạn đang xem bản rút gọn của tài liệu. Xem và tải ngay bản đầy đủ của tài liệu tại đây (1.8 MB, 13 trang )
Environmental Science and Pollution Research
/>
RESEARCH ARTICLE
Synthesis, characterization of novel ZnO/CuO nanoparticles,
and the applications in photocatalytic performance for rhodamine B
dye degradation
Thi Thao Truong1 · Truong Tho Pham2,3 · Thi Thuy Trang Truong4 · Tien Duc Pham4
Received: 9 August 2021 / Accepted: 14 October 2021
© The Author(s), under exclusive licence to Springer-Verlag GmbH Germany, part of Springer Nature 2021
Abstract
Photocatalytic deg radation of environmental pollutants is being up to date for the treatment of contaminated water. In the
present study, ZnO/CuO nanomaterials were successfully fabricated by a simple sol-gel method and investigate the photodegradation of rhodamine B (RhB). The synthesized ZnO/CuO nanoparticles were characterized by X-ray diffraction (XRD),
energy-dispersive spectroscopy (EDS), scanning electron microscopy (SEM), transmission electron microscopy (TEM), UVVis diffuse reflectance spectroscopy (UV-Vis-DRS), thermal analysis (TGA), surface charge, and Fourier transform infrared
spectroscopy (FTIR). The photo-degradation of the dye RhB was followed spectroscopically. The overall composition of
ZnO/CuO material was found to be wurtzite phase, with particle size of 30 nm, and the Vis light absorption increased with
an increase of Cu content. The ZnO/CuO nanomaterials were highly active leading to a photo-degradation of 10 ppm RhB
reaching 98% within 180 min at 0.1 g/L catalyst dosage. The change in surface charge after degradation evaluated by ζ potential measurements and the differences in functional vibration group monitored by Fourier transform infrared spectroscopy
(FTIR) indicates that the RhB adsorption on the Zn45Cu surface was insignificant. And scavenging experiments demonstrate
that the RhB degradation by ZnO/CuO nanomaterials involves to some degree hydroxyl radicals.
Keywords ZnO/CuO · Photocatalyst · Solgel method · Rhodamine B · Degradation mechanism
Introduction
Responsible Editor: Sami Rtimi
* Tien Duc Pham
; ;
1
Department of Chemistry, TNU-University of Sciences,
Tan Thinh Ward, Thai Nguyen City, Thai Nguyen 250000,
Vietnam
2
Laboratory of Magnetism and Magnetic Materials, Science
and Technology Advanced Institute, Van Lang University,
Ho Chi Minh City, Vietnam
3
Faculty of Technology, Van Lang University,
Ho Chi Minh City, Vietnam
4
Faculty of Chemistry, University of Science, Vietnam
National University, Hanoi, 19 Le Thanh Tong, Hanoi,
Hoan Kiem 1000 00, Vietnam
Metal oxides are a widely used material for various applications
in industrial. Among numerous metal oxides, ZnO is known as a
multifunctional material due to the potential application in many
fields, such as electronics, optoelectronics, sensor, converter,
energy generator, and photocatalyst in hydrogen production,
event for biomedicine and pro-ecological systems (Kolodziejczak-Radzimska et al. 2014). The ZnO is high chemical stability, high thermal and mechanical stability at room temperature,
hardness, rigidity, and piezoelectric constant while its hybrid
property is low toxicity, biocompatibility, and biodegradability
(Ghahramanifard et al. 2018). ZnO is also a well-known semiconductor in groups II–VI, whose covalence is on the boundary
between ionic and covalent semiconductors with a broad energy
band of 3.37 eV (Chou et al. 2017) and large exciton binding
energy (Shashanka et al. 2020). One advantage is that ZnO has
quantum yield and easily controlled synthesis processes (Singh
and Soni 2020). Furthermore, the structural, morphology, optical, and electrical properties of the nanoscaled ZnO can also be
easily modified or improved for many applications (Belkhaoui
13
Vol.:(0123456789)
et al. 2019). Therefore, an extensive study investigated the ZnO
as a potential photocatalytic degradation of various both organic
and inorganic pollutants such as ionic dyes, antibiotics, pesticides, peptis, and heavy metal ion (Boon et al. 2018; Pirhashemi
et al. 2018; Raizada et al. 2019). A high number of studies using
ZnO for photocatalysis is increasing every year to approximately
2400 at 2019 (Frederichi et al. 2021).
Nevertheless, the photocatalyst of ZnO has several limitations. For example, the absorption in the visible (Vis) region
is less than 5% (Yu et al. 2019) and the high recombination
rate of photo-induced charge carriers against the movement
of electron and hole to material surface reacts (Kumari et al.
2020). To improve this feature, ZnO was combined with
many metal oxides to form effective materials, such as Cu2O
(Mamba et al. 2018; Yu et al. 2019), WO3, NiO, CoFe2O4,
Au, Pt/Ga, Sr–Au, graphene, Mn, Co, Ce, Nd, Gd (Koe et al.
2019; Zhai and Huang 2016), Sn (Venkatesh et al. 2020), and
Ag (Ramasamy et al. 2021). Among these composite materials, a mixed oxide system of ZnO and Cu has attracted many
researchers (Huo et al. 2019; Jiang et al. 2019; Maleki et al.
2015; Vaiano et al. 2018). That is because CuO is a low-cost
metal oxide with a narrow bandgap (1.2–2.1 eV) (Singh and
Soni 2020). Nevertheless, CuO shows a low photocatalytic
performance (Pirhashemi et al. 2018) because of the high
recombination rate of charge carriers in the CuO system.
Therefore, the integration of ZnO and CuO could decrease
the rate of recombination of photogenerated carriers (Sahu
et al. 2020). Moreover, S. Rtimi indicated that the signal for
the iso-energetic charge transfer among Cu2O and ZnO and
the electrostatic interaction between p-type Cu2O and ZnO
accelerated the electron migration to the ZnO n-type semiconductor (Mamba et al. 2018), enhanced the response to Vis
light, and increased the photocatalytic performance under the
sunlight. Many methods are studied to fabricate the ZnO/CuO
materials known as metallurgical process, mechanochemical
process, or chemical processes as precipitation, solgel, solvothermal, and hydrothermal methods, using an emulsion
or microemulsion, or growing from a gas phase, pyrolysis
spray, sonochemical method, or synthesis using microwave.
Among them, the sol-gel method allows the using of a wide
selection of solvents, surfactants, and heat treatment, making
it easier to control the particle size and shape. For instance,
the hollow microsphere with a diameter of approximately 5
μm composed of uniform nanoparticles with a diameter of
approximately 20 nm was observed in the work of Chen et al.
(2020); the quasi-sphere shape with uniform morphologies
has been reported (Acedo-Mendoza et al. 2020); the hybrid
nanocomposite in which CuO nanoparticle is attached to the
ZnO–T tetrapod surface (Sharma et al. 2020), ZnO nanorod
(Patil et al. 2019), nanoflower-like structure (Mardikar et al.
2020), nanowires (Chou et al. 2017), and thin film (Asikuzun
et al. 2018) was investigated. The composite of ZnO and CuO
was studied with various ratio of Zn/Cu:Cu content with very
13
Environmental Science and Pollution Research
low Zn/Cu ratio in the range 1000/3÷1000/9 (Singh and Soni
2020), with the mass ratios as 99.9/0.1, 98.0/2.0, and 95.0/5.0
(Ruan et al. 2020), or different percentages of Cu in the catalyst of 1, 3, 5, and 10% (Harish et al. 2017), event component
from 100% Zn to 100% Cu (Lavín et al. 2019). The previous
work indicated that the ZnO/CuO composite showed a better
photocatalytic efficiency than the ZnO. Nevertheless, to the
best of our knowledge, the optimum composition of CuO and
the influence of Cu content have not been reported. Kavita
Sahu et al. (Sahu et al. 2020) founded that the formation
of p-n 2D CuO–ZnO hybrid nanoheterojunctions enhanced
the photogenerated charge carrier separation, so that they
exhibited excellent photocatalytic decomposition for methylene blue (MB), methylene orange (MO), and 4 nitrophenol
(4-NP) under sunlight radiation. Ruan et al. (2020) indicated
that the ZnO/CuO n-n heterojunction photocatalysts, electron
on the conduction band (CB) of ZnO, move to the valence
band (VB) of CuO by the electrostatic attraction, and form
electrons in the CB of CuO and holes in the VB of ZnO,
respectively. Thus, the recombination of the electrons and
hole pairs was reduced on the surface of ZnO, and the photocatalytic activity of ZnO/CuO for Acid Orange 7 under the
solar light was improved compared to pure ZnO.
Rhodamine B (RhB) is a well-known fluorescent cationic
dye in organic chemistry and biological studies. RhB is usually
used as a colorant in many industries such as the plastic, textile,
or paint, or illegally used for coloring different confectionery
by sweet markets or bakers. RhB is soluble in water, and stable with light, temperature, chemicals, or microbes. However,
RhB is an extremely toxic pollutant for water environment that
strongly affects humans and organisms (Yen Doan et al. 2020).
RhB has no deadly effects on the ecosystem as pesticides (Rani
et al. 2021) but in the body, RhB can cause oxidative stress,
injury, increase in cell apoptosis, and brainstem (Sulistina and
Martini 2020). In this study, for the first time, we synthesized
the series of ZnO/CuO nanomaterials with different ratios by
sol-gel method. The characterization of the materials was systematically examined by different physicochemical methods
including X-ray diffraction (XRD), energy-dispersive spectroscopy (EDS), scanning electron microscopy (SEM), transmission electron microscopy (TEM), and UV-Vis diffuse reflectance spectroscopy (UV-Vis-DRS), thermal analysis (TGA),
Fourier transform infrared spectroscopy (FTIR), and surface
charge evaluation. Their photocatalytic performance for RhB
degradation under the solar light was thoroughly investigated.
The mechanisms for RhB removal using ZnO/CuO were also
studied based on the presence of different radicals as well as
the changes in charging behavior and surface functional group
after RhB degradation.
Environmental Science and Pollution Research
Experimental
Materials
Oxalic acid (H2C2O4) (purity ≥ 99.5%), cupric nitrate trihydrate (Cu(NO3)2·3H2O) (purity = 99.0–101.0%), zinc acetate dihydrate (Zn(CH3COO)2·2H2O) (purity ≥ 99.0%), and
ethanol (C2H5OH) (96%, for HPLC), rhodamine B (≥ 97%,
for HPLC), n-butanol (n-C4H9OH) (purity ≥ 99.5%), diammonium oxalate monohydrate ((NH4)2C2O4·H2O) (purity
≥ 99%), and silver nitrate ( AgNO3) (purity ≥ 99.8%) were
purchased from Sigma-Aldrich, India, to be used without
further purification. Deionized water was used throughout
the whole study.
Synthesis of ZnO/CuO nanoparticles
ZnO/CuO nanoparticles were prepared by sol-gel method
(Kolodziejczak-Radzimska et al. 2014; Siddiqui et al. 2018).
Firstly, zinc acetate dihydrate and cupric nitrate trihydrate
were dissolved in ethanol at 60°C for 30 to 60 min, leading
to the formation of a clear and homogeneous solution. The
Zn:Cu molar ratios were 45:1; 30:1; 20:1; 15:1; and 10:1
(labeled as Z
nxCu). Secondly, a solution of oxalic acid in
ethanol was added dropwise into the initial solution under
vigorous stirring at 60°C and maintained for 2 h to obtain the
milky white suspension gel form. The mole ratio of oxalic
acid:total metal ions was 1:1. The gel formed was dried at
80°C for 36 to 48 h to completely dry (xerogel). The xerogel
was subjected to thermal analysis to determine the sample
annealing temperature. After that, the xerogel was finely
ground and annealed at 450°C in air for 2 h, heating rate
200 °C/h.
Characterization
After heat treatment, crystal structure and phase composition of obtained products were studied by XRD using
a X-ray diffractometer (Max 18XCE, Japan) with Cu Kα
radiation (λ = 0.154056 nm) at a scan rate of 0.02° s −1 in
the 2θ range from 20 to 80°. The morphology and particle
size of the materials were evaluated by SEM (Leo 1430VP)
and TEM (Jeol JEM 2100F microscope) at an accelerating
voltage of 200 kV. Elemental analysis of samples was examined using a JSM-7900F SEM attached with EDS. Optical
absorption, reflectance, and bandgap properties were analyzed using UV-Vis diffuse reflectance spectroscopy (DRS)
by a Scinco 4100 instrument. The surface charge before and
after interaction with RhB was determined by zeta potential
using Zetasizer Nano ZS (Malvern, England). The zeta (ζ)
potential was calculated from electrophoretic mobility with
Smoluchowski’s equation. Fourier transform infrared (FTIR)
spectroscopy was used to evaluate the change of vibration
functional surface groups. The FTIR spectra were conducted
on JASCO, Japan (FT/IR-4600 type A), using TGS detector
with a solution of 4 cm−1. The wavenumber was recorded
from 400 to 4000 cm−1.
Evaluation of photocatalytic activity
The photocatalytic performance of materials was investigated in aqueous RhB solution using natural sunlight (on
a sunny day, between 9:00 am and 15:00 pm), at different
concentrations of RhB from 10 to 50 ppm with the range of
photocatalyst dosage of 0.1–0.5 g/L. In the photodegradation, different amounts of catalyst were dispersed in 250-mL
RhB solutions. Before sunlight irradiation, the suspensions
were agitated using magnetic stirrer in the dark for 60 min
to achieve the contacted RhB molecules with the photocatalyst. About 7 mL RhB solution was withdrawn, centrifuged,
and filtered, and the solution was collected to determine the
RhB concentrations by using a UV-Visible spectrophotometer (UV-1700 Pharma Spec, Shimadzu, Kyoto, Japan). The
relative RhB concentration (C/C0) was determined using the
relative absorbance (A/A0) at a wavelength of 554 nm (Jiang
et al. 2019), where A0 and A were the absorbances of RhB
solutions at the lighting start time (t0) and at any time t,
respectively. The photocatalytic efficiency was calculated
using Eq. (1) (Venkatesh et al. 2020):
H (%) =
A − At
Co − Ct
100% = o
100%
Co
Ao
(1)
where H is the photocatalytic efficiency, C0 is the initial
concentration, and Ct is the concentration of RhB after illumination t min.
For cycle tests, the used photocatalyst was washed several
times with ethanol and deionized water and dried at 80°C
for 12h after each run.
For the scavenger tests, di–ammonium oxalate monohydrate (AO) (Sakib et al. 2019), tert–butanol (BuOH) (Raja
et al. 2019), and silver nitrate ( AgNO3) (Osotsi et al. 2018),
were used as h+, ·OH, and e− reactive species, respectively.
Results and discussion
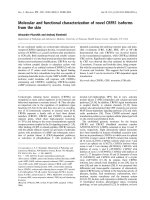
The TGA/DTA of Z
n10Cu and Z
nCu0 xerogels have been
done and shown in Fig. 1. The TGA-DTA curves of two
samples are found to be similar with two weight-loss segments, corresponding to the endothermic process. The
weight-loss segment between 30 and 200 °C, containing
three endothermic processes at 81.21, 125.15, and 162.27°C
(ZnCu0 sample) and 83.34, 143.73, and 169.41°C ( Zn10Cu
sample), is about 52.275% and 20.77% for Z
nCu 0 and
Zn10Cu, respectively. This effect can be attributed to the
removal of water and residual solvent (Mel’nik et al. 2006),
the decomposition of non-carbonized anion N
O3−, and other
nitrogen-containing molecules (Xu et al. 2009). The second
weight-loss segment was located between 366–427°C and
13
Environmental Science and Pollution Research
100
(a)
2
10
TG-ZnO
100
5
80
80
-2
-5
60
DTA-Zn10Cu
-10
TG (%)
0
60
40
0
DTA (µV/mg)
DTA-ZnO
TG (%)
(b)
TG-Zn10Cu
40
-15
-20
20
20
-4
0
200
400
o
600
Temperature ( C)
800
-25
-30
200
400
o
0
800
600
Temperature ( C)
Fig. 1 Schematic of thermal analysis of Z
nCu0 (a) and Z
n10Cu (b) xerogels
13
Z-(103)
Z-(110)
Z-(102)
C-(111)
Z-(100)
Z-(002)
Z-(101)
Z-(200)
Z-(112)
Z-(201)
ZnO-(101)
ZnO: Z-(hkl)
CuO: C-(hkl)
Intensity (a.u)
312–394°C for Z
nCu0 and Z
n10Cu xerogel, respectively. The
weight loss in this segment is about 22.49% for Z
nCu0 and
39.96% for Zn10Cu, and it may concern to several mechanisms: the volatilization of excess oxalic acid (the boiling
point 365.1±25.0 °C), the decomposition of the gel network,
or a combustions of organic materials. A decrease in the
weight is insignificant and thermal effect is observed in the
temperature range after those segment, indicating that the
calcination temperatures at above 450°C is the crystallization process. Therefore, we have decided to treat all samples
at 450°C.
Characterization of ZnO/CuO materials
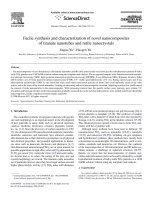
The crystal structures of ZnO/CuO nanoparticles were
analyzed by XRD method. The diffraction patterns of ZnO/
CuO nanoparticles with different Zn/Cu ratio are shown in
Fig. 2. In the ZnO sample, there are a total of nine diffraction peaks in the 2θ ranging from 25 to 70°. These peaks
locate at 31.76°, 34.61°, 36.29°, 47.56°, 56.98°, 62.84°,
66.20°, 68.00°, and 69.08° and match well with the PDF
card (JCPDS No.36-1451) of the Wurtzite structure of ZnO
(Shukla and Shukla 2018). The Miller indices of ZnO of the
Wurtzite structure are denoted in Fig. 2. There are not any
peaks concerning the impurity phase which can be observed
within the XRD detection limit. In other samples, the change
in the Zn/Cu ratio influences the shifting and rising a new
peak in the XRD patterns but the Wurtzite structure remains
unchanged. By increasing the Cu content, the diffraction patterns of ZnO/CuO nanoparticles tend to shift toward a high
angle, meaning a shrinkable of the volume of unit cell, as
Zn10Cu
Zn15Cu
Zn20Cu
Zn30Cu
Zn45Cu
ZnO
30
40
50
60
2θ (degree)
70
80
Fig. 2 XRD pattern of synthesized ZnO/CuO materials. The inset
show the diffraction profile of ZnO-(101)
seen in the inset of Fig. 2. This observation is highly contrary to what was observed in the work of Lu et al. (2017),
where the lattice parameters of ZnO/CuO nanocomposites
had not varied with changing the Zn/Cu ratio. Ping et al.
explained this phenomenon by considering a similar ionic
radius of Zn2+ (0.074 nm) and Cu1+ (0.074 nm) ions (supported by XPS measurement). It is worth noting that Cu has
doped at the Zn site of wurtzite structure of ZnO to form
Environmental Science and Pollution Research
the tetrahedral coordination of Zn/Cu surrounded by four
oxygens. In general, a partial substitution of Cu at the Zn
site can vary the oxidation state of Cu ions in either C
u2+
1+
(0.071nm) or C
u (0.074 nm) depending on the synthesis conditions (Lu et al. 2017; Rooydell et al. 2017). The
different oxidation state of Cu ions is a crucial reason for
changing the lattice parameters (the shift of XRD pattern)
of ZnO/CuO nanoparticles. Therefore, the shift of the XRD
patterns observed in Fig. 2 is mainly due to the incorporation of Cu2+ into the ZnO lattice. This also suggests that
oxygen vacancies do not play a crucial role on the optical
properties of our samples. Our observation is consistent
with the previous reports (Rooydell et al. 2017). Furthermore, an increase in the Cu content also enhances intensity
of the diffraction peak at 38.56°. This peak belongs to the
main intense peak (111) of the monoclinic structure of CuO
(JCPDS card no. 45-0937). The appearance of this peak in
the ZnO/CuO nanoparticles approves that the Cu doping
on the ZnO is not only incorporation inside the ZnO lattice to construct the Z
n1−xCuxO compounds but also buildup
of CuO lattice for forming the Zn1−xCuxO/CuO nanocomposites. Obviously, an increase in Cu doping concentration
prefers to form the Z
n1−xCuxO/CuO nanocomposites as
evidence from an enhanced intensity of the (111) peak of
CuO and an unchanged peak position of (101) of ZnO in the
Z15Cu and Z10Cu samples. The crystallite sizes calculated
from Sherrer’s equation indicates that the ZnO crystallite
sizes of the Zn0Cu, Zn45Cu, Zn30Cu, Zn20Cu, Zn15Cu, and
Zn10Cu system are about 28.0, 25.2, 23.6, 18.0, 27.7, and
29.0 nm, respectively.
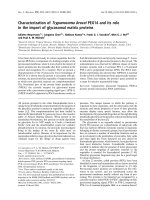
(Zn10Cu)
(Zn30Cu)
Elemen
t
OK
Cu L
Zn L
Totals
Weight
(%)
18.89
06.47
74.64
100.00
Atomic
(%)
48.70
04.20
47.10
Element
Weight
(%)
22.71
2.25
75.04
100.00
Atomic
(%)
54.53
1.36
44.10
OK
Cu K
Zn K
Totals
The presence of Cu in materials was confirmed by the
EDX spectra (Fig. 3). The sharp peaks of Zn, Cu, and O
were obtained; no other peaks related to any other element
were detected in the spectrum within the detection limit.
The calculated Zn/Cu ratio from the EDX spectrum of
Zn10Cu is about 47.1/4.2 (11.2/1.0), which is quite close to
the design value. The other samples also show a matching
between theoretical and calculated Zn/Cu ratio values, which
are 15.57/1.00, 32.4/1.00, and 47/1 for the Zn15Cu, Zn30Cu,
and Zn45Cu samples, respectively.
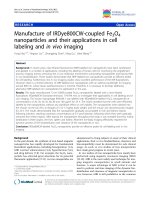
The morphologies of some ZnxCu materials are presented
by SEM and TEM images in Figs. 4. The ZnO and system
of CuO–ZnO are uniformly spherical. The SEM images on
the larger scale (μm) show that the ZnO particles are aggregated but the aggregation of CuO–ZnO did not occur. All
the materials with different Zn/Cu ratios were in the size of
27 ± 8 nm.
The optical nature of synthesized materials was analyzed
through the UV-Vis diffused reflectance spectra technique,
corresponding to the results in Fig. 5. The optical spectrum
of pure ZnO exhibits with strong absorption spectra in range
of 200–400 nm, and the sharp absorption edge around 400
nm. The characteristic edge of ZnO was observable in the
ZnxCu material, and the band-gap energy (Eg) of ZnO and
the ZnxCu (x = 45, 30, 20, 15, 10) system was calculated
from the UV-visible absorption spectra of ZnO by a Tauc
plot (Senasu et al. 2020; Souza et al. 2017) (Fig. 6b). The Eg
values decreased with increasing Cu content and found to be
3.07, 3.05, 2.99, 2.92, 2.84, and 2.62 eV.
(Zn15Cu)
Element
OK
Cu K
Zn K
Totals
(Zn45Cu)
Element
OK
Cu K
Zn K
Totals
Weight
(%)
17.32
4.92
77.76
100.00
Atomic
(%)
46.08
3.29
50.62
Weight
(%)
17.08
1.67
81.25
100.00
Atomic
(%)
45.69
1.13
53.19
Fig. 3 EDX spectra of different Z
nxCu materials
13
Environmental Science and Pollution Research
Fig. 4 A. SEM images of a Zn15Cu, b Zn30Cu, and c Zn45Cu; B. TEM images of a ZnO and b Z
n45Cu
Fig. 5 UV-Visible DRS spectra
of pure and Cu doped ZnO
nanoparticles
1.0
0.8
ZnO
Zn45Cu
(a)
(b)
Zn10Cu
Zn30Cu
Zn20Cu
0.8
Zn15Cu
0.6
Zn10Cu
Zn20Cu
Abs
Abs (a.u)
0.6
Zn15Cu
Zn30Cu
0.4
Zn45Cu
0.4
ZnO
0.2
0.2
300
13
400
500
Wavelength (nm)
600
2.6
2.7
2.8
2.9
3.0
Eg (eV)
3.1
3.2
3.3
Environmental Science and Pollution Research
1.4
1.2
Abs
1.0
0.8
100
(a)
Initial RhB 20 ppm
Ads 60 min in the dark
= Lighting 0 min
Lighting 30 min
Lighting 60 min
Lighting 90 min
Lighting 120 min
Lighting 180 min
(b)
Zn10Cu
Zn15Cu
80
Photocatalytic efficiency (%)
1.6
0.6
0.4
Zn20Cu
Zn45Cu
60
40
20
0.2
0.0
460
480
500
520
540
560
580
0
600
0
20
40
60
Wavelength (nm)
80
100
120
140
160
180
Time (min)
Fig. 6 a Absorption spectra of RhB as a function of irradiation time after the photocatalytic degradation using 0.1 g/L Zn45Cu exposed to the
sun light. b Photocatalic efficiency decompose 20 ppm RhB under sunlight by 0.1 g/L synthetic materials
coupled CuO/ZnO nanocomposite shifted the band gap
energy into the visible light region.
Photocatalytic activity
To apply the ZnO/CuO materials as photocatalysts in
natural environment, we investigated their photocatalytic
activities for the RhB degradation in a solution with a pH of
approximately 6 under solar light. The catalyst dosage of 0.1
g/L was fixed to remove 20 ppm RhB from aqueous solution.
The results are shown in Fig. 6.
Figure 6 a shows the UV-Vis spectra of the RhB aqueous solute taken out at different reaction times during the
photodecomposition process using the Zn45Cu material. As
can be seen, the maximum Abs of 20 ppm RhB solution
at 554 nm before and after presence of Zn45Cu placed in
the dark only slightly decreased (abs from 1.50 down 1.44,
corresponding to 4%). When irradiation time increased, the
100
100
80
80
60
40
(a): 0.1 g/L Zn45Cu
10 ppm RhB
20 ppm RhB
30 ppm RhB
50 ppm RhB
20
0
0
100
200
300
400
Time (min)
500
600
700
Photocatalytic efficiency (%)
Photocatalytic efficiency (%)
Furthermore, all ZnO/CuO materials have a high value
of Abs in the Vis region compared to pristine ZnO: the abs
for ZnO is 0.2 while abs for ZnxCu samples (x = 45, 30, 20,
15, 10) are about 0.35 to 0.7; the abs for ZnxCu samples in
the region below 370 nm is also sharply reduced compared
to pristine ZnO. This may be related to their morphologies,
particle size, and surface nanostructures, improving the
crystallinity and reducing the defects (Ungula et al. 2017);
another reason may be due to the strong sp-d exchange interaction between the band electrons of ZnO and the localized
electrons of C
u2+ ions substituting for the Z
n2+ ions (Ramya
et al. 2018) or the substitution of Cu ions in the ZnO lattice
(Kama rulzaman et al., 2016) or a separating phase between
ZnO and CuO. These results confirm the formation of CuOloaded ZnO hierarchical structures. Also, the formation of
(b). 20 ppm RhB
0.05 g/L Zn45Cu
0.1 g/L Zn45Cu
0.2 g/L Zn45Cu
0.5 g/L Zn45Cu
60
40
20
0
0
50
100
150
Time (min)
Fig. 7 Photodegradation efficiency of RhB under sunlight at different initial concentrations of RhB and Zn45Cu
13
Environmental Science and Pollution Research
maximum absorbance decreased gradually. After 240 min
upon sunlight irradiation, RhB degradation reached to 82%.
Figure 6b indicates that Cu content was in the sample, and
the light absorbance in the visible region of ZnO/CuO systems increases while the photocatalytic efficiency of RhB
degradation by the material did not increase accordingly.
The ZnO/CuO system with ratio of Zn/Cu = 45 shows the
highest photocatalytic efficiency compared to other Zn/
Cu ratio samples, followed by Z
n10Cu; the efficiencies of
Zn15Cu, Zn20Cu and Zn30Cu were insignificant. The influence of doped Cu content to the photocatalytic performance
of ZnO/CuO materials did not follow a rule in the previously
published papers (Acedo-Mendoza et al. 2020; Harish et al.
2017; Kumari et al. 2020). Maybe, in the region of Zn/Cu
atom ratio = 10÷20, the excess amount of Cu cannot be
incorporated in the ZnO host lattice sites, CuO was segregated from the ZnO crystal lattice leading to the new phase,
and the photocatalytic behavior in the visible light of ZnO/
CuO system is mainly due to CuO activity, so the higher
the Cu content, the higher the photocatalytic efficiency is.
However, in the region of Zn/Cu atom ratio = 20÷45, that is,
the lower the Cu content, the Cu ion readily penetrates the
ZnO crystal lattice during phase information, causing some
structural deviations, and enhance the RhB decomposition
photocatalytic efficiency of the ZnO/CuO system; the photocatalytic behavior in the visible light of CuO/ZnO system
may be due to the combined action between CuO and ZnO,
or the interaction between ZnO and CuO. Therefore, the
optimum content of Cu in Zn45Cu is the important factor to
affect the photocatalytic activity of the coupled ZnO/CuO
photocatalyst.
The Zn45Cu sample will be used in the next studies. Photodegradation efficiency of RhB under sunlight at different
1.8
0.05 g/L; y = - 0.05704 + 0.00214x; R2 = 0.95307
0.1 g/L; y = - 0.16141 + 0.00486x; R2 = 0.97397
0.2 g/L; y = - 0.41004 + 0.00815x; R2 = 0.97895
0.5 g/L; y = - 0.02257 + 0.00604x; R2 = 0.98899
1.6
1.4
(b)
RhB 10 ppm; R2 = 0.96722
y = - 0.40518 + 0.01127x;
RhB 20 ppm; R2 = 0.97397
y = - 0.16141 + 0.00486x;
RhB 30 ppm; R2 = 0.96091
y = - 0.44227 + 0.00632x;
RhB 50 ppm; R2 = 0.99423
y = - 0.1032 + 0.00138x;
2.0
(a)
1.2
1.5
1.0
Log(Co/C)
Log (Co/C)
initial concentrations of the Z
n45Cu catalyst and RhB is
shown in Fig. 7.
Figure 7 shows that the RhB degradation efficiency using
0.1 g/L Zn45Cu under the solar light decreased significantly
when increasing initial RhB dye concentrations from 10 to
50 mg/L. The RhB degradation efficiencies after 180 min
with 10, 20, 30, and 50 ppm decreased to about 98, 82, 73,
and 21% respectively. Furthermore, RhB degradation efficiencies gradually increased after 180 min with increasing
the catalyst from 0.05 to 0.5 g/L. It implies that the reaction
rate depended on both the initial concentrations of Zn45Cu
and RhB. To understand this dependency, we used the
pseudo-first-order reaction to describe the ln(C/Co) against
the time (Fig. 8). As can be seen in Fig. 8, all correlation
coefficient (R2) values were higher than 0.9, demonstrating
that the RhB degradation behavior using Z
n45Cu catalyst
was in accordance with the pseudo-first-order kinetic.
The stability of the Zn45Cu nanoparticles was evaluated
by catalytic degradation of RhB recycles. The material was
recovered and reused three cycles. After photocatalytic
experiments, the catalyst was taken out from the reaction
vessel by centrifugation, rinsed with ethanol and deionized
water, before drying in the oven at 80°C for 12h. The RhB
degradation efficiencies after the regenerations are shown in
Fig. 9. As can be seen, the RhB degradation efficiencies at
all times decreased insignificantly. It means that the photocatalytic activity of Zn45Cu nanoparticles is relatively stable.
It should be noted that RhB removal in the presence of 0.1
g/L synthesized materials for 60 min without the light was
only 4% (lighting 0 min in Fig. 6a), suggesting the negligible
RhB adsorption on Zn45Cu nanoparticles. Similar experiments were also carried out with all Z
nnCu materials. We
found that RhB concentrations were only reduced below 6%
0.8
0.6
0.4
1.0
0.5
0.2
0.0
0.0
0
50
100
150
Time (min)
200
250
0
100
200
300
400
500
600
700
Time (min)
Fig. 8 Kinetic study of RhB photodegradation process with Zn45Cu catalyst under the sunlight a 0.1 g/L Zn45Cu and different initial RhB concentrations. b 20 ppm RhB and differrent Zn45Cu concentrations
13
Environmental Science and Pollution Research
Photocatalytic effficiency (%)
100
(a)
Run (1)
Run (2)
Run (3)
80
60
40
20
0
20
40
60
80
100
120
140
160
180
Time (min)
Fig. 9 The reusability of Z
n45Cu for RhB degradation
after 60 min without the light. It again implies that all the
synthesized ZnnCu material has very low RhB adsorption
effectiveness. To confirm the effect of adsorption process,
we evaluate the changes in surface functional group by FTIR
spectra (Fig. 10) and surface charge change by zeta potential
of the material before and after RhB degradation.
Figure 10 shows that FTIR spectra of Zn45Cu present
a peak around 450 cm−1 and 750 cm−1, which are generally assigned to the stretching vibration of Zn–O and Cu–O
bonds (Andrade et al. 2017); the broad peak at about 3500
cm−1 was assigned for the –OH group. In addition, two small
peaks at around 2900 c m−1 and some peaks at around 1000
cm−1 show the C–H bonds (Kadam et al. 2018) and the
peaks at 1400 c m−1 and 1500 c m−1 correspond to the banding of C–H bonds (Manohar et al. 2020). All these bands
were presented on the FTIR spectra of Z
n45Cu after RhB
adsorption and degradation process, and the intensity of
peaks slightly decreased compared with the FTIR spectra of
RhB. Furthermore, the FTIR spectra of Z
n45Cu after interaction with RhB only appeared a new peak at 1638 cm−1. It can
be seen that the 1649 cm−1 peak of RhB shifted to shorter
wavenumber, while other characteristic peaks of RhB were
not observed. The results of FTIR spectra indicate that the
RhB adsorption on the Zn45Cu surface was insignificant.
The results of zeta potential of Zn45Cu sample at pH 6
and 8 were found to be + 14.6 and + 16 mV, respectively.
Nevertheless, after interaction process with RhB at neutral
media, the zeta potential of Z
n45Cu sample was found to
be + 19 mV. Since RhB is a cation dye, if the RhB adsorption occurred on the surface of material, the zeta potential
would increase significantly. However, in our case, the zeta
potential of Z
n45Cu sample before and after degradation
changed slightly. It implies that the adsorption of RhB onto
the surface of material was negligible. In other words, the
RhB removal from aqueous solution was mainly by photocatalytic mechanism.
The photocatalytic reaction mainly occurred due to the
presence of the active species of electrons ( e−), holes ( h+),
superoxide
radical anions ( O·−
), hydroxiperoxyl radical
)
2
·
( HO2 , and hydroxyl radicals (·OH) (Kumaresan et al.
2020). Among them, hydroxyl radicals (·OH) are most active
(Anitha and Muthukumaran 2020; Lavín et al. 2019). To
study the photodegradation mechanism, AO, AgNO3, and
BuOH were conducted during photoreaction respectively.
The result is shown in Fig. 11.
The presence of AO and Ag+ in the reaction system
(decomposition of 10 ppm RhB solution by 0.1 g/L Z
n45Cu
under the sunlight at room temperature) at the first 90 min
leads to significantly increased RhB decomposition compared to the reaction system without them, and slightly
increased from 100 to 180 min (compared to the reaction
system without them). These results revealed that the loss
100
Zn45Cu+RhB
Photocatalytic efficiency (%)
Transmition (%)
Zn45Cu
RhB
4000
3500
3000
2500
2000
1500
1000
500
Wavenumber (cm-1)
80
(b)
60
Zn45Cu 0.1 g/L RhB 10 ppm
Zn45Cu 0.1 g/L RhB 10 ppm + AgNO3
Zn45Cu 0.1 g/L RhB 10 ppm + AO
Zn45Cu 0.1 g/L RhB 10 ppm + BuOH
40
20
0
20
40
60
80
100
120
140
160
180
Time (min)
Fig. 10 FTIR spectra of RhB and Zn45Cu sample before and after
adsorption
Fig. 11 Effect of different scavenger on photodegradation process
13
Environmental Science and Pollution Research
of electron or hole or the present of Ag could accelerate
photodegradation process. We all know that Ag absorbs
light at about 420 nm, and Ag has been also adsorpted on
the surface of material (ZnO–CuO); therefore, it accelerates
photodegradation process. Only the presence of n-butanol
in the reaction system immediately significantly reduced the
decomposition efficiency of RhB at all times; after 180 min,
the efficiency was only about 35%. We suggest that hydroxyl
radicals are mainly activated species involved for RhB photocatalytic activity of ZnO/CuO system (Zn45Cu). This result
was also confirmed by the influence of the reaction medium
on the photocatalytic efficiency. The photocatalytic degradation of 20 ppm RhB by 0.1 g/L Zn10Cu was carried out at pH
3, 7, and 10 (Fig. 12). The 20 ppm RhB removal efficiency in
different media is very obvious, at 120 min is 30%, 53%, and
92% respectively for pH 3, 7, and 10. At pH 10, the effect
was almost maximum after only 90 min.
According to Anitha et al. and Lavín et al. (Anitha and
Muthukumaran 2020; Lavín et al. 2019), the photocatalysis
process takes place according to the following reactions:
2O2 + 2e− → 2 O2 ⋅−
(2)
2H+ + 2O2 ⋅− → 2HO⋅ 2
(3)
2HO⋅ 2 → O2 + H2 O2
(4)
H2 O2 + 2e− → OH⋅ + OH−
(5)
1∕2 O2 + H2 O + 2e → OH⋅ + OH−
(6)
h+ + H2 O → H+ + OH⋅
(7)
OH⋅ + RhB → degradation products
(8)
100
Photocatalytic efficiency (%)
Zn10Cu 0.1 g/L, RhB 20 ppm
pH 3
pH 7
pH 10
80
60
40
20
0
0
20
40
60
80
100
120
140
Time (min)
Fig. 12 Effect of pH on photocatalytic degradation of RhB
13
160
180
In the acidic environment, it is favorable for the reactions
from (2) to (6) and (8) and in the alkaline medium, it is
favorable for the Reactions (7) and (8). And RhB could exist
between two forms in acidic and alkaline media as shown in
the previously published paper (Birtalan et al. 2011).
At low pH, RhB exists in cationic form, the material surface is also positively charged, and the electrostatic repulsion
makes it difficult for them to come close for a reaction occur.
And the presence of A
g+ (e− scavenger) did not reduce photocatalytic efficiency; it means that Reactions (2), (5), and
(6) which occur insignificantly lead to (8) reaction which is
weak. In alkaline medium, RhB exists in neutral form, and
the electrostatic repulsion makes it easier for them to transfer
to the material surface for reaction to occur; additionally,
the RhB molecular structure has bond angles below 90°,
which are unstable and easy to decompose. So, the reaction
in alkaline medium occurs more easily.
The band gap energies (Eg) of ZnO and CuO are reported
to be about 3.23 and 1.4 eV, respectively, whereas the electron affinity (χ) is 4.35 and 4.07 eV, respectively (Harish
et al. 2017). During sunlight irradiation, electrons in the
valence band (e−VB) of CuO and ZnO were excited (e* VB),
and jump into the conduction band (CB), leaving holes in the
VB of CuO. However, this energy is not enough for e*VB of
ZnO to pass the Eg = 3.23 eV to jump into the CB to generate electrons and holes at the CB and the VB, but e * VB of
CuO can induce it. As the above discussion, when the Cu
content in the ZnO/CuO system is very low, the Cu atom can
penetrate into the ZnO crystal structure, causing structural
deviation, giving up the VB overlap (VBO) between ZnO
and CuO rather than bandwidth changes (Liu et al. 2008).
Thus, it leads to increase in Eg of the ZnO/CuO system falling below 1.4 eV. Then, initial e * VB of ZnO migrated on
the VBO, and easily moved to the CBO of the system. The
electrons and holes were generated in both the VB and CB
of CuO and ZnO. At the same time, the overlap makes the
holes and electron migrate from CuO to ZnO and vice versa
that increases photocatalytic capacity of Zn45Cu. These e*
VB react with dissolved oxygen molecules, and form super
oxide radical anion ( O2·−), which further indirectly turn
into highly reactive hydroxide radicals (OH·). Moreover,
the holes in the valence band of CuO which can react with
OH− ion form highly reactive hydroxyl radicals. Hydroxide
radicals react strongly with oxidants, and generate either
photogenerated electrons or holes which finally oxidize the
RhB molecules, or hydroxide radicals oxidize directly with
RhB. ZnO/CuO system may be a favorable p–n junction
which helps the separation of generated electron-hole pairs
under visible light irradiation (Harish et al. 2017).
Based on the above detailed discussion, we can suggest
the mechanism of the photocatalytic process of RhB by
Zn45Cu 450°C under the sunlight follows the reactions:
Environmental Science and Pollution Research
CuO∕ZnO + hv → CuO∕ZnO (e∗ (VB)) ↔ CuO∕ZnO((e∗ (VBO) )
(9)
( ∗
(( +
)
)
−
CuO∕ZnO (e (VBO)) → CuO∕ZnO h (VBO + e (CBO)
(10)
)
(
)
)
((
CuO∕ZnO h+ (VBO) + e− ( CBO) ↔ CuO∕ZnO h+ (VB) + CuO∕ZnO(e− (CB )
(11)
e− + O2 → O2 ⋅− (inactive)
(2)
h+ + H2 O → H+ + OH⋅
(7)
OH⋅ + RhB → degradation products
(8)
Conclusions
We have investigated the hybrid photocatalytic ZnO/CuO
nanomaterials for RhB degradation. The materials based on
were successfully fabricated by sol-gel method and characterized by XRD, EDX, SEM, TEM, UV-Vis-DRS, FTIR,
and zeta potential. Cu was doped into ZnO in both ways:
Cu replaced Zn site in wurtzite structure of ZnO to form
the Zn1−xCuxO structure and build up CuO lattice for forming the Z
n1−xCuxO/CuO nanocomposites as the Cu content
increases; the ZnO/CuO nanomaterials were in sphere shape,
the average size is about 30 nm, and the bandgap energy
decreased with the increase in Cu content. The Zn45Cu
was the best photocatalyst for the RhB degradation under
the solar light; the RhB degradation efficiencies gradually
increased with increasing the catalyst dose and decreased
significantly when increasing initial RhB dye; the photocatalytic activity of Zn45Cu nanoparticles is relatively stable after 3 regenerations. The degradation kinetic followed
pseudo-first-order model. The RhB degradation using ZnO/
CuO nanomaterials was mainly controlled by photocatalytical mechanism in the mainly activated reaction of hydroxyl
radicals.
Author contribution Thi Thao Truong: investigation, material synthesis, analyze, data treatment, writing, editing, and supervision; Truong
Tho Pham: methodology, analyze, data treatment; Thi Thuy Trang
Truong: analyze, data treatment; Tien Duc Pham: conceptualization,
writing, reviewing, and editing. All authors read and approved the final
manuscript.
Availability of data and materials
All data and materials in this study are included in this article.
Declarations
Ethical approval Not applicable.
Consent to publish Not applicable.
Competing interests The authors declare no competing interests.
References
Acedo-Mendoza AG et al (2020) Photodegradation of methylene blue
and methyl orange with CuO supported on ZnO photocatalysts:
the effect of copper loading and reaction temperature. Mater Sci
Semicond Process 119(June)
Andrade GRS et al (2017) Star-shaped ZnO/Ag hybrid nanostructures
for enhanced photocatalysis and antibacterial activity. Appl Surf
Sci 399:573–582. https://doi.org/10.1016/j.apsusc.2016.11.202
Anitha S, Muthukumaran S (2020) Structural, optical and antibacterial
investigation of La, Cu dual doped ZnO nanoparticles prepared
by co-precipitation method. Mater Sci Eng C 108:110387. https://
doi.org/10.1016/j.msec.2019.110387
Asikuzun E, Ozturk O, Arda L, Terzioglu C (2018) Preparation, growth
and characterization of nonvacuum Cu-doped ZnO thin films. J
Mol Struct 1165:1–7. https://doi.org/10.1016/j.molstruc.2018.03.
053
Belkhaoui C, Mzabi N, Smaoui H, Daniel P (2019) “Results in physics
enhancing the structural , optical and electrical properties of ZnO
nanopowders through ( Al + Mn ) doping.” Results in Physics
12(January): 1686–96. 10.1016/j.rinp.2019.01.085
Birtalan E et al (2011) Investigating rhodamine B-labeled peptoids: scopes and limitations of its applications. Biopolymers
96(5):694–701
Boon C et al (2018) A review of ZnO nanoparticles as solar photocatalysts : synthesis , mechanisms and applications. Renew Sust
Energ Rev 81(August 2017):536–551. https://doi.org/10.1016/j.
rser.2017.08.020
Chen C et al (2020) Self-assembly synthesis of CuO/ZnO hollow
microspheres and their photocatalytic performance under natural
sunlight. Vacuum 174:109198. https://doi.org/10.1016/j.vacuum.
2020.109198
Chou CM, Chang YC, Lin PS, Liu FK (2017) Growth of Cu-doped
ZnO nanowires or ZnO-CuO nanowires on the same brass foil
with high performance photocatalytic activity and stability. Mater
Chem Phys 201:18–25. https://doi.org/10.1016/j.matchemphys.
2017.08.023
Frederichi D et al (2021) Structured photocatalytic systems: photocatalytic coatings on low-cost structures for treatment of water
contaminated with micropollutants—a short review. Environ Sci
Pollut Res 28(19):23610–23633
Ghahramanifard et al (2018) Electrodeposition of Cu-doped p-type
ZnO nanorods; effect of Cu doping on structural, optical and
photoelectrocatalytic property of ZnO nanostructure. Superlattice Microst 114:1–14. https://d oi.o rg/1 0.1 016/j.s pmi.2 017.0 7.0 19
Harish S et al (2017) Controlled structural and compositional characteristic of visible light active ZnO/CuO photocatalyst for the
degradation of organic pollutant. Appl Surf Sci 418:103–112.
https://doi.org/10.1016/j.apsusc.2016.12.082
Huo C et al (2019) Tunable photoluminescence effect from ZnO films
of Ag-decorated localized surface plasmon resonance by varying
positions of Ag nanoparticles. Mater Res Bull 111:17–23. https://
doi.org/10.1016/j.materresbull.2018.10.037
Jiang J et al (2019) Insights into the synergetic effect for enhanced
UV/visible-light activated photodegradation activity via Cu-ZnO
photocatalyst. Appl Surf Sci 478:1037–1045. https://doi.org/10.
1016/j.apsusc.2019.02.019
Consent to participate Not applicable.
13
Kadam AN et al (2018) Facile synthesis of Ag-ZnO core–shell nanostructures with enhanced photocatalytic activity. J Ind Eng Chem
61:78–86. https://doi.org/10.1016/j.jiec.2017.12.003
Kamarulzaman N, Kasim MF, Chayed NF (2016) Elucidation of the
highest valence band and lowest conduction band shifts using XPS
for ZnO and Zn0.99Cu0.01O band gap changes. Results in Physics
6:217–230. https://doi.org/10.1016/j.rinp.2016.04.001
Koe WS et al 2019. “An overview of photocatalytic degradation: photocatalysts, mechanisms, and development of photocatalytic membrane.” Colloid and Interface Science Journal
Kolodziejczak-Radzimska et al (2014) Zinc oxide-from synthesis to
application: a review. Materials 7(4):2833–2881
Kumaresan N et al (2020) Visible light driven photocatalytic activity
of ZnO/CuO nanocomposites coupled with RGO heterostructures
synthesized by solid-state method for RhB dye degradation. Arab
J Chem 13(2):3910–3928. https://doi.org/10.1016/j.arabjc.2019.
03.002
Kumari V et al (2020) Synthesis and characterization of heterogeneous
ZnO/CuO hierarchical nanostructures for photocatalytic degradation of organic pollutant. Adv Powder Technol 31(7):2658–2668.
https://doi.org/10.1016/j.apt.2020.04.033
Lavín A, Sivasamy R, Mosquera E, Morel MJ (2019) High proportion ZnO/CuO nanocomposites: synthesis, structural and optical properties, and their photocatalytic behavior. Surf Interfaces
17(July):100367. https://doi.org/10.1016/j.surfin.2019.100367
Liu RS et al (2008) Band overlap via chemical pressure control in
double perovskite (Sr2-XCax)FeMoO6 (0 ≤ x ≤ 2.0) with TMR
effect. Curr Appl Phys 8(1):110–113
Lu P et al (2017) Abnormal room temperature ferromagnetism in CuO/
ZnO nanocomposites via hydrothermal method. Appl Surf Sci
399:396–402. https://doi.org/10.1016/j.apsusc.2016.12.113
Maleki A et al (2015) Photocatalytic degradation of humic substances in aqueous solution using Cu-doped ZnO nanoparticles under natural sunlight irradiation. Environ Sci Pollut Res
22(21):16875–16880
Mamba G et al (2018) Evidence for the degradation of an emerging
pollutant by a mechanism involving iso-energetic charge transfer
under visible light. Appl Catal B Environ 233(January):175–183.
https://doi.org/10.1016/j.apcatb.2018.03.109
Manohar A, Geleta DD, Krishnamoorthi C, Lee J (2020) Synthesis,
characterization and magnetic hyperthermia properties of nearly
monodisperse CoFe2O4 nanoparticles. Ceram Int 46(18):28035–
28041. https://doi.org/10.1016/j.ceramint.2020.07.298
Mardikar et al (2020) “Sunlight driven highly efficient degradation of
methylene blue by CuO-ZnO nanoflowers.” J Environ Chem Eng
8(2). 10.1016/j.jece.2018.11.033
Mel’nik IV, Stolyarchuk NV, Zub YL, Dabrowski A (2006) Polysiloxane xerogels containing arch-fixed urea groups. Russ J Appl
Chem 79(6):981–986
Osotsi MI et al (2018) Synthesis of ZnWO4−x nanorods with oxygen
vacancy for efficient photocatalytic degradation of tetracycline.
Prog Nat Sci: Mater Int 28(4):408–415
Patil VL et al (2019) Construction of Cu doped ZnO nanorods by
chemical method for low temperature detection of NO2 gas. Sensors Actuators A Phys 299:111611. https://doi.org/10.1016/j.sna.
2019.111611
Pirhashemi M et al (2018) Journal of Industrial and Engineering Chemistry Review on the Criteria Anticipated for the Fabrication of
Highly Ef Fi Cient ZnO-Based Visible-Light-Driven Photocatalysts. J Ind Eng Chem 62:1–25. https://doi.org/10.1016/j.jiec.
2018.01.012
Raizada P et al (2019) Photocatalytic water decontamination using
graphene and ZnO coupled photocatalysts : a review. Mater Sci
Energy Technol 2(3):509–525. https://doi.org/10.1016/j.mset.
2019.04.007
13
Environmental Science and Pollution Research
Raja K et al (2019) Biogenic ZnO and Cu nanoparticles to improve
seed germination quality in blackgram (Vigna Mungo). Mater
Lett 235:164–167. https://doi.org/10.1016/j.matlet.2018.10.038
Ramasamy B et al (2021) Novel organic assisted Ag-ZnO photocatalyst
for atenolol and acetaminophen photocatalytic degradation under
visible radiation: performance and reaction mechanism. Environ
Sci Pollut Res 28(29):39637–39647
Ramya E, Veeramohan Rao M, Jyothi L, Narayana Rao D (2018)
Photoluminescence and nonlinear optical properties of transition
metal (Ag, Ni, Mn) doped ZnO nanoparticles. J Nanosci Nanotechnol 18(10):7072–7077
Rani L et al (2021) An extensive review on the consequences of
chemical pesticides on human health and environment. J Clean
Prod 283:124657. https://d oi.o rg/1 0.1 016/j.j clepr o.2 020.
124657
Rooydell R et al (2017) Cu doped ZnO nanorods with controllable cu
content by using single metal organic precursors and their photocatalytic and luminescence properties. J Alloys Compd 691:936–
945. https://doi.org/10.1016/j.jallcom.2016.08.324
Ruan S et al (2020) A Z-scheme mechanism of the Novel ZnO/CuO
n-n Heterojunction for photocatalytic degradation of acid orange
7. Mater Sci Semicond Process 107(June 2019):104835. https://
doi.org/10.1016/j.mssp.2019.104835
Sahu K, Bisht A, Kuriakose S, Mohapatra S (2020) Two-dimensional
CuO-ZnO nanohybrids with enhanced photocatalytic performance
for removal of pollutants. J Phys Chem Solids 137:109223. https://
doi.org/10.1016/j.jpcs.2019.109223
Sakib AAM et al (2019) Synthesis of CuO/ZnO nanocomposites and
their application in photodegradation of toxic textile dye. J Compos Sci 3(3):91
Senasu T, Chankhanittha T, Hemavibool K, Nanan S (2020) “Visiblelight-responsive photocatalyst based on ZnO/CdS nanocomposite
for photodegradation of reactive red azo dye and ofloxacin antibiotic.” Materials Science in Semiconductor Processing (November): 105558. https://doi.org/10.1016/j.mssp.2020.105558
Sharma M et al (2020) Solar light assisted degradation of dyes and
adsorption of heavy metal ions from water by CuO–ZnO tetrapodal hybrid nanocomposite. Mater Today Chem 17:100336. https://
doi.org/10.1016/j.mtchem.2020.100336
Shashanka R, Esgin H, Yilmaz VM, Caglar Y (2020) Fabrication and
characterization of green synthesized ZnO Nanoparticle based
dye-sensitized solar cells. J Sci: Adv Mater Devices 5(2):185–191.
https://doi.org/10.1016/j.jsamd.2020.04.005
Shukla P, Shukla JK (2018) Facile sol-gel synthesis and enhanced
photocatalytic activity of the V2O5-ZnO nanoflakes. J Sci: Adv
Mater Devices 3(4):452–455. https://doi.org/10.1016/j.jsamd.
2018.09.005
Siddiqui H et al (2018) Studies of Structural, optical, and electrical
properties associated with defects in sodium-doped copper oxide
(CuO/Na) nanostructures. J Mater Sci 53(12):8826–8843. https://
doi.org/10.1007/s10853-018-2179-6
Singh J, Soni RK (2020) Controlled synthesis of CuO decorated
defect enriched ZnO nanoflakes for improved sunlight-induced
photocatalytic degradation of organic pollutants. Appl Surf Sci
521(December 2019):146420. https://doi.org/10.1016/j.apsusc.
2020.146420
Souza RP et al (2017) Solar photocatalytic degradation of textile
effluent with TiO2, ZnO, and Nb2O5 catalysts: assessment
of photocatalytic activity and mineralization. Environ Sci
Pollut Res 24(14):12691–12699. https://d oi.o rg/1 0.1 007/
s11356-017-8408-8
Sulistina DR, Martini S (2020) The effect of rhodamine b on the cerebellum and brainstem tissue of Rattus norvegicus. J Public Health
Res 9(2):101–104
Ungula J et al (2017) Effect of annealing on the structural, morphological and optical properties of Ga-Doped ZnO nanoparticles by
Environmental Science and Pollution Research
reflux precipitation method. Results Phys 7:2022–2027. https://
doi.org/10.1016/j.rinp.2017.06.019
Vaiano V et al (2018) Cu-Doped ZnO as efficient photocatalyst for the
oxidation of arsenite to arsenate under visible light. Appl Catal
B Environ 238:471–479. https://doi.org/10.1016/j.apcatb.2018.
07.026
Vankatesh N et al (2021) Sunlight-driven enhanced photocatalytic
activity of bandgap narrowing Sn-doped ZnO nanoparticles.
Environ Sci Pollut Res 28(13):16792–16803
Venkatesh N et al (2020) Visible light–driven photocatalytic dye degradation under natural sunlight using Sn-doped CdS nanoparticles.
Environ Sci Pollut Res 27(34):43212–43222
Xu JH et al (2009) Low-temperature synthesis of BiFeO3 nanopowders
via a sol-gel method. J Alloys Compd 472(1–2):473–477
Yen Doan TH, et al. (2020) “Adsorptive removal of rhodamine B
using novel adsorbent-based surfactant-modified alpha alumina
nanoparticles.” Journal of Analytical Methods in Chemistry
2020
Yu J et al (2019) Duality in the mechanism of hexagonal ZnO/CuxO
nanowires inducing sulfamethazine degradation under solar or
visible light. Catalysts 9(11)
Zhai B-G, Huang YM (2016) A review on recent progress in ZnO
based photocatalysts. Mater 1(1):22–36 http://www.lcst-cn.org/
Articles/005.pdf
Publisher’s note Springer Nature remains neutral with regard to
jurisdictional claims in published maps and institutional affiliations.
13