báo cáo hóa học:" Cyclic changes in gene expression induced by Peg-interferon alfa-2b plus ribavirin in peripheral blood " pot
Bạn đang xem bản rút gọn của tài liệu. Xem và tải ngay bản đầy đủ của tài liệu tại đây (790.13 KB, 15 trang )
BioMed Central
Page 1 of 15
(page number not for citation purposes)
Journal of Translational Medicine
Open Access
Research
Cyclic changes in gene expression induced by Peg-interferon alfa-2b
plus ribavirin in peripheral blood monocytes (PBMC) of hepatitis C
patients during the first 10 weeks of treatment
Milton W Taylor*
1
, Takuma Tsukahara
1
, Jeanette N McClintick
2
,
Howard J Edenberg
2
and Paul Kwo
3
Address:
1
Department of Biology, Indiana University, Bloomington, IN. 47401, USA,
2
Department of Biochemistry and Molecular Biology and
Center for Medical Genomics, Indiana University School of Medicine, Indianapolis, IN 46202, USA and
3
Department of Medicine, Hepatology
Unit, Indiana University School of Medicine, Indianapolis, IN 46202, USA
Email: Milton W Taylor* - ; Takuma Tsukahara - ; Jeanette N McClintick - ;
Howard J Edenberg - ; Paul Kwo -
* Corresponding author
Abstract
Background and Aims: This study determined the kinetics of gene expression during the first 10 weeks
of therapy with Pegylated-interferon-alfa2b (PegIntron™) and ribavirin (administered by weight) in HCV
patients and compared it with the recently completed Virahep C study [1,2] in which Peginterferon-alfa2a
(Pegasys™) and ribavirin were administered.
Methods: RNA was isolated from peripheral blood monocytes (PBMC) from twenty treatment-naïve
patients just before treatment (day 1) and at days 3, 6, 10, 13, 27, 42 and 70 days after treatment. Gene
expression at each time was measured using Affymetrix microarrays and compared to that of day 1.
Results: The expression of many genes differed significantly (p ≤ 0.001 and changed at least 1.5-fold) at
days 3 (290 probes) and 10 (255 probes), but the number dropped at days 6 (165) and 13 (142). Most
genes continued to be up regulated throughout the trial period. A second group of genes, including
CXCL10, CMKLR1 (chemokine receptor 1), TRAIL, IL1Rα and genes associated with complement and lipid
metabolism, was transiently induced early in treatment. CDKN1C (cyclin kinase inhibitor 1) was induced
early but repressed at later times. Genes induced at later times were mostly related to blood chemistry
and oxygen transport. By week 10, 11 of the patients demonstrated a positive response to therapy, and
the final sustained viral response (SVR) was 35%. The levels of gene induction or decrease was very similar
to that previously reported with Pegasys/ribavirin treatment.
Conclusion: The response to Pegintron/ribavirin was similar to that reported for Pegasys/ribavirin
despite some differences in the amount administered. We did not detect major differences at the genomic
level between patients responding to treatment or non-responders, perhaps because of limited power.
Gene induction occurred in a cyclic fashion, peaking right after administration of interferon and declining
between administrations of the drug. Our data suggest that more than once a week dosing might be
desirable early during treatment to maintain high levels of response as measured by gene expression.
Published: 5 November 2008
Journal of Translational Medicine 2008, 6:66 doi:10.1186/1479-5876-6-66
Received: 16 September 2008
Accepted: 5 November 2008
This article is available from: />© 2008 Taylor et al; licensee BioMed Central Ltd.
This is an Open Access article distributed under the terms of the Creative Commons Attribution License ( />),
which permits unrestricted use, distribution, and reproduction in any medium, provided the original work is properly cited.
Journal of Translational Medicine 2008, 6:66 />Page 2 of 15
(page number not for citation purposes)
Background
Hepatitis C virus (HCV) infection is a significant global
public health problem, affecting approximately 200 mil-
lion individuals in the world and over 4 million in the
United States alone, where it is the most prevalent blood-
borne infection [3]. It is currently the leading indication
for a liver transplant and is responsible for 8,000–10,000
deaths annually. Interferon (IFN) has formed the back-
bone of therapy against HCV, first as monotherapy, then
in combination with the nucleoside analogue ribavirin
[4]. Current standard of care for chronic HCV infection
consists of a regimen of pegylated interferon-α in combi-
nation with ribavirin. The addition of the polyethylene
glycol (PEG) moiety (pegylation) increases the half-life of
the IFN molecule and has facilitated once per week dosing
instead of the two or three doses per week previously
required with non-pegylated forms of IFN [5,6]. The com-
bination of pegylated IFN-α and ribavirin successfully
eradicates the virus from 50–60% of those treated [7,8].
Two different pegylated molecules of IFN have been
approved for clinical use in the U.S. The size and position
of the PEG moiety differs between pegylated-interferon-α-
2a (Pegasys™) and Pegylated-interferon-α-2b (PegIn-
tron™) [5,9,10]. Although pegylation improves the phar-
macokinetic properties of the core IFN protein [11], it
decreases the in vitro biological activity [12,13]. PegIn-
tron™ has higher in vitro anti-viral activity than Pegasys™
[11,14,15] (Taylor, unpublished data).
Type I IFNs do not directly inactivate the virus, but exert
their effects through binding to specific receptors on the
cell surface, IFNAR1 and IFNAR2 [16]. This results in a
cascade of gene activation through the Jak-STAT pathway
[17-19] and perhaps other transcription pathways
[20,21]. Large number of genes are induced or down reg-
ulated by non-pegylated IFNα in vitro [22-25]. Previous
work [15] has shown very similar in vitro profiles of gene
induction in monocytes (PBMC) treated with either
pegylated or the non-pegylated version of IFNα. Virtually
all of the changes in gene expression were due to the IFN,
rather than the ribavirin [23]. We have recently reported
that the expression of many hundreds of genes are signif-
icantly modified, both up and down, in vivo following
treatment of hepatitis C patients with pegylated-IFNα-2a
(Pegasys™) and ribavirin [2]. Using a mathematical model
we identified a core set of genes that appear to be related
to the anti-viral effects. These include OAS2, MX1, MX2,
RIG1, genes associated with ubiquitination, and many
other genes previously shown to be associated with inter-
feron treatment [26].
In this report we analyze the response of patients to com-
bination treatment with pegylated-interferon-α
2b
(PegIn-
tron™) and ribavirin during the first 10 weeks of
treatment. Unlike the previous report from the Virahep C
study [2], which used a constant dose of 180 ug of
pegylated-interferon-α-2a, in the present study the PegIn-
tron™ was administered in an amount related to the body
weight of the patients. Blood samples were collected
before treatment initiation (day 1) and at days 3, 6, 10,
13, 27, 42 and 70 after treatment. Interferon injections
were weekly at day 1, 7, 14 etc. The selection of days was
based on times just before interferon injection (days 6,13,
27, 42 and 70) in order to analyze whether there was a
trough in gene expression at the end of the weekly period.
Affymetrix microarrays were used to detect genes up- or
down- regulated during treatment. Viral assays for the
presence of HCV in serum were performed at the same
time points. In this study we report that changes in gene
expression levels are high 3 days after IFN injection and
return toward baseline before the next injection; the
return toward baseline is accompanied in many cases by a
slight increase in virus titer. This pattern continues for the
first few weeks. Genes induced by the treatment fall into
three classes, genes that are up regulated throughout the
treatment, immediate expressed genes with only transient
expression, and late genes in which expression is elevated
only after day 27. Fifty percent of the patients showed an
antiviral response during the first 10 weeks, but the final
SVR was 35%.
Materials and methods
Subjects
Twenty (16 M, 4 F) genotype 1 hepatitis C patients who
gave informed consent were entered into this trial. All sub-
jects were previously untreated, and had no other cause of
chronic liver disease, ALT levels above the upper limit of
normal, compensated liver disease with minimal hemato-
logical parameters including hemoglobin values of 12
gm/dL for females and 13 gm/dL for males, WBC > 3,000/
mm
3
, neutrophil count > 1,500/mm
3
, platelets > 70,000/
mm
3
and no evidence of decompensation in those with
cirrhosis. All patients had liver biopsies within 3 years of
enrolling, with fibrosis graded by the Metavir scoring sys-
tem. Patients were excluded if they had decompensated
cirrhosis, serum α-fetoprotein concentration above 50 ng/
L, HIV infection, previous organ transplantation, other
causes of liver disease, pre-existing psychiatric disease, sei-
zure disorders, cardiovascular disease, haemoglobinopa-
thies, haemophilia, poorly controlled diabetes, or
autoimmune-type disease, or if they were unable to use
contraception. Table 1 presents the demographics of the
population used in this study. This study was approved by
the institutional review board.
Patients received PegIntron™ at 1.5 μg/kg (based upon
weight at initial visit) administered subcutaneously once
a week for 10 weeks (days 1, 7, 14, 21, 28 ), plus ribavi-
rin (13 ± 2 mg/kg/day). Patients had blood drawn for
Journal of Translational Medicine 2008, 6:66 />Page 3 of 15
(page number not for citation purposes)
analysis on day 1 prior to first injection of interferon (base
line) and at days 3, 6, 10, 13, 27, 42 and 70.
HCV-RNA Serum Determinations
Serum samples were collected before treatment initiation
(day 1) and at days 3, 6, 10, 13, 28, 42, 70 and weeks 12,
24, 48 and 72, for viral assays. HCV-RNA was determined
by qRT-PCR (TaqMan
®
, Schering-Plough Research Insti-
tute, Union, NJ) with a lower limit of detection of 29 IU/
ml.
Peripheral Blood Mononuclear Cell (PBMC) Preparation
Blood was collected in sodium heparin-CPT tubes, diluted
with an equal volume (8 ml) of phosphate buffered saline
(PBS), carefully layered over a 10 ml Ficoll-Hypaque gra-
dient (Amersham/Pharmacia, Piscataway, NJ) and centri-
fuged at 800 rpm for 20 minutes at room temperature.
The buffy coat layer was transferred to a 15 ml RNAse-free
tube, diluted with PBS, and centrifuged at 100 × g for 15
minutes at room temperature. The supernatants were dis-
carded and the PBMC were retained.
RNA Extraction
The PBMC were lysed in 1 ml of TRI reagent (Molecular
Research Center Inc, Cincinnati, OH). The lysate was
mixed with 1-Bromo-3-chloropropane (BCP)-phase sepa-
ration agent for 1 minute, and incubated at room temper-
ature for 15 minutes. After centrifugation for 15 minutes
at 12,000 rpm and 4°C, RNA was precipitated from the
supernatant overnight at -20°C with an equal volume of
isopropanol and 1/10 volume of 7.5 M ammonium ace-
tate. The precipitate was washed twice with 75% ethanol,
and then with 95% ethanol. RNA was briefly air-dried and
then resuspended and further purified using RNeasy col-
umns (Qiagen; Valencia, CA). The amount and quality of
RNA were determined by spectrophotometry and by elec-
trophoresis through 1% agarose with ethidium bromide.
RNA was further analyzed by the Agilent Bioanalyzer;
samples that did not show two clear bands of ribosomal
RNA were discarded.
RNA Labeling, Hybridization and Scanning
Preparation of cDNA, cRNA, and labeling were carried out
according to the protocols recommended by Affymetrix in
the GeneChip
®
Expression Analysis Technical Manual
(Affymetrix, Santa Clara, CA), as previously described [2].
Hybridization was to Affymetrix GeneChip
®
Human
Genome U133A microarrays, which measure approxi-
mately 22,000 genes. The microarrays were scanned using
a dedicated Affymetrix Model 3000 7G scanner controlled
by GCOS software.
Statistical Analysis
The average intensity on each array was normalized by
global scaling to a target intensity of 1000. Data were
extracted using the Affymetrix Microarray Suite 5 (MAS5)
algorithm. To avoid analyzing genes that were not reliably
detected, the MAS5 data were filtered to eliminate any
gene that was not called present in at least 50% of the
samples in at least one group [27]. If a probeset was not
reliably detected on day 1 but was later, it is noted as
"turned on" and if it was detected on day 1 but not later it
is noted as "turned off;" the exact fold change for such
genes are not reliable because the signal for a gene that is
Table 1: Pretreatment characteristics of the patients
Patient ID Age Weight (kg) Genotype Gender Fibrosis Score Metavir ALT (IU/L) Day 1 HCV RNA level (IU/Ml)
149 76 1a 1 4 74 1.7E+06
252 92 1a 0 0 20 7.0E+05
352 92 1a 1 4 57 3.4E+06
438 90 1a 1 0 52 1.1E+07
556 80 1a 1 2 68 3.5E+06
6 47 106 1a 1 3 146 1.1E+07
7 44 65 1b 1 2 127 1.1E+07
8 42 112 1a 1 1 67 7.2E+06
952 78 1a 1 4 71 2.3E+06
10 57 76 1b 0 2 68 7.1E+06
11 59 70 1b 0 3 62 2.4E+06
12 56 109 1a 1 4 74 5.8E+06
13 49 116 1a 1 2 44 5.8E+06
14 53 90 1b 1 4 98 3.7E+05
15 51 61 1a 0 3 73 1.8E+06
16 50 78 1a 1 3 99 1.6E+06
17 60 106 1a 1 2 37 4.1E+05
18 45 114 1a 1 4 161 9.0E+05
19 47 74 1b 1 3 117 4.0E+05
20 61 83 1b 1 2 181 8.1E+05
Journal of Translational Medicine 2008, 6:66 />Page 4 of 15
(page number not for citation purposes)
not detected is largely background. Fold changes for each
gene were calculated using the ratio of the MAS5 signals of
the post treatment time to the baseline (pre-treatment). If
the signal for the post-treatment time point was greater
than the baseline the fold change was calculated as +aver-
age(post-treatment)/average(baseline), otherwise the fold
change was calculated as -average(baseline)/average(post-
treatment). Genes were considered significant if the
paired t-test p-value of log(signal) ≤ 0.001 and the fold
change was at least 1.5.
Gene expression as a function of time was analyzed using
Edge />[28]; values are cal-
culated on the log transform, but are plotted as percent of
maximum signal values with gnuplot
plot.info/ to show wider range of values. The 90 genes
most significant across all time points (by 1-way ANOVA)
were clustered using Pearsons dissimilarity and average
linkage, using Partek Genomics Suite (Partek Inc. St.
Louis, MO); arrays were ordered by day to show the pat-
tern of expression across time.
Results
Of the 20 patients enrolled, 19 were European American
and one was African American. Sixteen were male. All
were genotype 1, 14 with genotype 1A and 6 with geno-
type 1B. The baseline features of the 20 patients in this
study are shown in Table 1. In this cohort, 11/20 had
advanced hepatic fibrosis (Metavir stage 3–4), with 17/20
having high viral load (> 600,000 IU/mL). The overall
sustained viral response rate (SVR) at the end of treatment
(72 weeks) was 35%; i.e. 7/20 individuals had undetecta-
ble virus at 72 weeks. Table 2 presents virus titers with
time. By week 12 there were 11/20 patients who cleared
virus, however one withdrew from treatment because of
severe side effects, and 2 relapsed by the end of treatment.
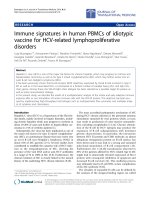
Changes in Global Gene Expression
Gene expression in PBMC changed dramatically and rap-
idly during PEG-interferon-α2b (PegIntron™)/ribavirin
therapy, with major changes being evident at all days after
the initial administration of the drugs (Table 3, Figure 1).
There was no significant difference in response between
patients with genotype 1A and 1B, nor between respond-
ers and non-responders, so all patients were analyzed
together. 973 genes were significantly (p ≤ 0.001; False
Discovery Rate [29] 1.2%) induced or down regulated on
day 3; the number induced was approximately the same as
the number down-regulated, as was seen in our earlier
study [2]. The number of differentially expressed genes
varied with time (Table 3, Figure 1); it was high on days 3
and 10 (mid-way between injections) and much lower on
days 6, 13 and 42 (just before subsequent injections)
(Table 3, Figure 1). The number of genes with altered
expression was high again, particularly for down regulated
genes, at day 70. Half of the up-regulated genes but only
16% of the down-regulated genes showed at least 1.5-fold
change (Table 3). For our subsequent analyses we focused
on the genes with more robust changes (p = 0.001 and
absolute fold-change ≥ 1.5).
There were 69 genes that showed at least 1.5-fold differ-
ences in expression at either 6 or all 7 time points: 59 up-
regulated and 10 down-regulated (Table 4). Many of these
up regulated genes have previously been shown to be reg-
ulated by interferon [2,25,26]. A full list of all genes
induced or down regulated at p ≤ 0.001 at any one day
compared to day 1 is presented in Supplementary Table 1.
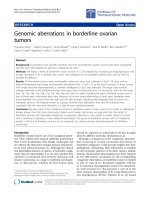
There is a strong pattern of gene expression as a function
of time, as demonstrated by hierarchical clustering of the
90 genes that differed most (Figure 2). There is a clearly
visible, alternating pattern of increases and decreases that
decays over time. The patterns of gene expression can be
divided into four groups. The top cluster are genes that are
decreased as a result of treatment. These include genes
associated with protein synthesis including eukaryotic ini-
tiation and elongation factors (EIF4B, EEI2, EIF3S5) and
genes involved in ribosomal proteins (RPL3). The major-
ity of genes fall into a second group, highly induced at
days 3 and 10 but showing a decrease at day 6 and 13; the
alternation decreases with time but is still high at day 70.
This includes most of the well characterized IFN inducible
genes, including MX1, MX2, OAS1, OAS2, OAL, RIG1
(DDX58) and most interferon stimulated genes (ISGs). A
third group are transiently induced genes, i.e. genes
induced at day 3 and then returning to base line at later
times (Table 5); many have been described as important
in the interferon antiviral response and include CXCL10,
IL1RA (IL1RN), JAK2, TNFSF10 (TRAIL), as well as
CDKN1C, CXCL10, SMD4A. The last two genes at the bot-
tom of the cluster array represent genes that are induced
late. As is obvious for GYPA (glycophorin A), induction
for such genes begins around day 27 and proceeds
through day 70. Most of the genes in this latter group are
related to blood chemistry, including hemoglobin com-
plex formation, heme binding and oxygen transport
(Table 6), which may reflect secondary response to long
term treatment with ribavirin. A more complete list of
genes in each category is presented in the accompanying
Tables 4, 5 and 6.
To further examine the variation of gene expression with
time, we used Edge software [28], which tests for changes
in gene expression over time vs. the null hypothesis that
the gene was expressed at a constant level. Among the 518
gene probes that were significantly modulated (absolute
fold change ≥ 1.5, p ≤ 0.001) at any one time point in the
study (Supplementary Table 1) 90% were shown to be dif-
ferentially regulated over time (p ≤ 0.001; False Discovery
Journal of Translational Medicine 2008, 6:66 />Page 5 of 15
(page number not for citation purposes)
Rate ≤ 0.001) in a cyclic fashion. The ten most differen-
tially expressed of these genes are plotted in Figure 3.
These same genes were previously selected by an unbiased
mathematical model as being involved in interferon anti-
HCV activity [26].
Comparison with previous studies
To compare the level of induction or down regulation
between this study and a previous study (Virahep C; [2])
performed with Peg-intron, we chose twenty patients
from the Virahep C study for whom we had data from day
3 (note that day 3 in Virahep C was the fourth day after
interferon injection, which was day 0 in that study). The
top 20 genes in terms of fold change are shown in Table
7. All genes induced in both trials are presented in Supple-
mentary Table 2. Note that in the Virahep C study the dose
of Peginterferon-alfa2a (Pegasys™) was 180 ug; in the
present study the dose of Pegylated-interferon-alfa2b
(PegIntron™) was lower: 1.5 ug/kg, for an average of 133
ug (standard deviation 25.6, maximum 174).
Discussion
The aim of this study was to examine the effects of Peg
interferon alfa-2b (PegIntron™, administered at 1.5 ug/kg)
Table 2: Viral titer with time.
Patient
ID
Day 0
HCV
RNA
level
(IU/Ml)
Day 3 Day 7 Day 10 Day 13 Day 27 Week
6
Week
10
Viral
Respon
se*
Week
12
Week
24
Week
48
Week
72
Final
Respon
se
1 1.7E+0
6
3.5E+0
5
3.7E+0
5
1.0E+0
5
2.3E+0
5
9.6E+0
4
8.3E+0
4
5.3E+0
3
NR 2.0E+0
3
00NRNR
2 7.0E+0
5
1.3E+0
5
9.2E+0
4
1.5E+0
3
3.8E+0
3
000R0000R
3 3.4E+0
6
1.5E+0
6
2.8E+0
6
1.1E+0
6
1.9E+0
6
1.6E+0
6
1.9E+0
6
6.3E+0
5
NR 3.8E+0
5
NR NR
4 1.1E+0
7
3.5E+0
5
6.1E+0
5
3.6E+0
4
1.7E+0
5
9.0E+0
3
5.7E+0
2
0R0000R
5 3.5E+0
6
2.9E+0
6
1.6E+0
6
4.9E+0
5
1.4E+0
6
6.9E+0
5
4.7E+0
5
2.0E+0
5
NR 1.7E+0
5
NR NR
6 1.1E+0
7
4.0E+0
6
5.6E+0
6
3.9E+0
6
6.3E+0
6
2.3E+0
6
1.0E+0
6
2.2E+0
5
NR 7.5E+0
5
NR NR
7 5.8E+0
6
1.3E+0
5
9.9E+0
4
1.4E+0
4
7.3E+0
4
1.3E+0
3
1.5E+0
2
0R0000R
8 1.1E+0
7
1.9E+0
5
5.8E+0
5
2.2E+0
4
no
sample
2.6E+0
3
8.7E+0
1
0R0000R
9 7.2E+0
6
8.8E+0
3
2.2E+0
5
1.9E+0
3
4.4E+0
3
000R0000R
10 2.3E+0
6
1.7E+0
6
5.3E+0
6
6.1E+0
5
1.0E+0
6
5.5E+0
5
3.6E+0
5
8.0E+0
5
NR 3.1E+0
5
NR NR
11 7.1E+0
6
1.9E+0
6
2.7E+0
6
2.0E+0
6
5.8E+0
6
1.9E+0
6
1.9E+0
6
1.4E+0
6
NR 6.7E+0
5
NR NR
12 2.4E+0
6
1.7E+0
7
3.3E+0
6
1.3E+0
6
2.0E+0
6
7.3E+0
5
5.4E+0
5
1.0E+0
5
NR 6.6E+0
4
NR NR
13 5.8E+0
6
9.9E+0
5
9.2E+0
5
1.1E+0
5
1.9E+0
5
1.4E+0
5
7.4E+0
3
1.5E+0
2
R0000R
14 3.7E+0
5
1.0E+0
5
2.3E+0
5
7.0E+0
4
1.2E+0
5
7.0E+0
3
3.9E+0
2
1.6E+0
2
R0001.2E+0
6
NR
15 1.8E+0
6
3.8E+0
5
1.0E+0
6
4.2E+0
5
8.0E+0
5
1.9E+0
5
2.3E+0
4
2.0E+0
3
R 3.6E+0
3
NR NR
16 1.6E+0
6
2.1E+0
6
3.9E+0
6
8.0E+0
5
5.8E+0
6
5.4E+0
6
2.1E+0
6
1.3E+0
6
NR 7.7E+0
4
NR NR
17 4.1E+0
5
1.2E+0
5
1.2E+0
6
1.3E+0
5
6.1E+0
5
3.1E+0
4
7.5E+0
3
4.5E+0
1
R0000R
18 9.0E+0
5
1.5E+0
6
6.2E+0
6
4.3E+0
5
1.4E+0
6
3.2E+0
5
3.3E+0
5
2.5E+0
5
NR 4.8E+0
4
NR NR
19 4.0E+0
5
8.7E+0
4
6.9E+0
5
3.1E+0
4
3.7E+0
4
1.5E+0
3
1.0E+0
3
0 R 0 0 0 6.3E+0
6
NR
20 8.1E+0
5
3.3E+0
3
1.9E+0
3
3.8E+0
1
2.7E+0
2
000R0WWWwithdr
ew
*R = responder, NR = non-responder.
W = withdrew
Journal of Translational Medicine 2008, 6:66 />Page 6 of 15
(page number not for citation purposes)
plus ribavirin on gene expression as a function of time in
a cohort of patients infected with HCV genotype 1. The
number of genes modified and the signal values for each
individual gene induced or down regulated as a result of
interferon treatment are remarkably similar between this
study and others [2,30,31]. Virtually all genes identified as
being important in the interferon response were induced
approximately equally in this study and the Virahep C
clinical trial [2,23], despite the different interferon used
(PegIntron™ here vs. Pegasys™ in Virahep C) and the dif-
ference in dose (Table 7 and Supplementary Table 2). The
few apparent differences were on the borderline of being
significant or close to the 1.5 fold cutoff we chose. The
kinetics of gene induction was also very similar, with most
genes being induced early and elevated throughout the
trial period. This was true despite several differences
between the studies. Virahep C study used peg interferon
α-2a (Pegasys™), whereas here we used peg interferon α-
2b (PegIntron™). Another difference was the dose of inter-
feron used; the Virahep C study used a constant amount
(180 μg/injection), whereas here we adjusted dose based
upon the initial weight of the patient (1.5 μg/kg). A third
difference was that subjects for the Virahep C gene expres-
sion study were selected based on their viral titer response
during the first 28 days of treatment, to allow comparison
among fast responders, slow responders and non-
responders. In the present study, patients were not
selected for response, but rather all subjects were ana-
lyzed, and only 3 subjects in the current study would have
met the Virahep C criteria of rapid responders; this greatly
reduced our power to detect differences in gene expression
related to response. Considering that these trials were
done a few years apart, and with different populations,
there was excellent agreement in the changes in gene
expression. Some of the small differences seen are due to
heterogeneity within the populations, and are apparent
even at day 1, before initiation of treatment. For instance,
the mean weight of this 20 person cohort was 88.4 kg
which correlates with the those in the Virahep C cohort
having intermediate or poor response, and 11/20 individ-
uals had bridging fibrosis or cirrhosis. In addition, there
was just one African American in this cohort.
As can be seen from Figure 1 and Table 3, and Supplemen-
tary table 1 a large number of genes are initially induced
following treatment. In the earlier study, the peak was at
day 1 after treatment [2], however this time point was not
included in the present study; thus in the present study the
peak was observed at the earliest time point after injec-
tion, day 3. In general, there was very good agreement in
the fold increase in gene expression at day 3 (Table 7 and
Supplementary Table 2). As in the case of Virahep C, there
is a decline in both the number of genes induced and the
extent of gene elevation before the next injection of inter-
feron, at day 6 here and day 7 in the Virahep C study. At
that time there is a small increase in viral titer. This pattern
appears to be repeated until about a month into the study
(Table 3, Figures 1, 2 and 3), which might suggest that
interferon treatment more frequently than once a week
would be more efficacious in early stages of treatment.
Among the major functional categories of genes induced
at day 3 (based on Gene Ontology categories and KEGG
pathways) are innate immune response, transcription fac-
tors, and chemotaxis. Many of these genes have previously
been reported to be induced primarily by IFN-gamma,
suggesting low amounts of IFN-gamma may be induced,
although we could not detect IFN-gamma in our arrays.
Table 3: Number of probe sets that significantly differed in expression (p ≤ 0.001).
Fold Change Expected* Day 3 Day 6 Day 10 Day 13 Day 27 Day 42 Day 70
NA** 11 973 478 725 471 716 452 920
≥ 1.5 -† 290 165 255 142 194 157 289
%≥ 1.5 30% 35% 35% 30% 27% 35% 31%
Up regulated
Fold Change Expected* Day 3 Day 6 Day 10 Day 13 Day 27 Day 42 Day 70
NA** -† 472 237 344 229 340 234 406
≥ 1.5 -† 235 96 294 102 129 103 206
%≥ 1.5 50% 41% 85% 45% 38% 44% 51%
Down regulated
Fold Change Expected* Day 3 Day 6 Day 10 Day 13 Day 27 Day 42 Day 70
NA** -† 501 241 381 242 376 218 514
≤ -1.5 -† 55 32 61 40 65 54 83
%≥ 1.5 11% 13% 16% 17% 17% 25% 16%
* Expected for normal distribution
** Not applicable; No fold change cutoff applied
† Not applicable
Journal of Translational Medicine 2008, 6:66 />Page 7 of 15
(page number not for citation purposes)
We have divided the gene responses into four categories:
genes that are induced early and once induced are induced
throughout the trial period, genes transiently induced,
those that appear late and down regulated genes (Tables
4, 5, 6). Most of these genes fall into a similar temporal
category in the previous study [2]. Most of the genes that
are induced (or down regulated) throughout the studied
period (up to 10 weeks; Table 4 and Supplementary Table
1) were previously identified as being involved in the
interferon response [2,22-25,32]. Among gene functions
significantly altered by IFN are genes involved in the
immune response including inflammation, genes previ-
ously reported to be involved in response to virus infec-
tion and transcription factors (DNA and RNA binding
proteins).
Among the genes transiently expressed is CXCL10. It has
been proposed previously that the levels of this gene are
related to the final outcome of treatment [33,34]. How-
ever both in this trial and in the Virahep C trial, this gene
is only expressed at enhanced levels for the first few days
after initiation of IFN treatment, and by day 13 is back to
baseline levels. We have not found a correlation between
CXCL10 expression and response to treatment. Protein
levels (ELISA data not shown) follow the mRNA levels.
IL1ra (IL1RN) has previously been reported to be tran-
siently expressed at the protein level following interferon
treatment [35], and, as can be seen from Table 5, this is
confirmed in the microarray data.
TNFSF10 (tumor necrosis factor (ligand) superfamily,
member 10, TRAIL), a gene associated with apoptosis in
transformed and tumor cells [36] and recently shown to
have direct anti-viral activity against dengue virus [37], is
induced early but only transiently. This gene was shown
to be induced at high levels during the early stages of treat-
The number of genes significantly upregulated or down-regulated (p = 0.001) at each time pointFigure 1
The number of genes significantly upregulated or down-regulated (p ≤ 0.001) at each time point.
Journal of Translational Medicine 2008, 6:66 />Page 8 of 15
(page number not for citation purposes)
Table 4: Genes differentially expressed (1.5-fold) at ≥ 6 time points
Symbol Day 3 Day 6 Day 10 Day 13 Day 27 Day 42 Day 70 Description
Up regulated
Gene name Other name/function
AGRN 2.1 1.7 2.1 1.9 1.6 1.7 2.1 agrin
APOBEC3A 2.9 2.0 2.7 1.9 1.9 1.8 2.0 apolipoprotein B mRNA editing enzyme, catalytic
polypeptide-like 3A
CHMP5 2.8 1.9 2.6 2.0 1.9 1.8 1.9 chromatin modifying protein 5
DDX58 2.8 1.8 2.6 1.7 1.8 1.6 1.7 RNA helicase RIG-I
EIF2AK2 2.6 1.9 2.6 2.2 2.0 2.0 2.4 Eukaryotic translation initiation factor 2-alpha kinase 2
FLJ11286 1.8 1.5 1.8 1.6 1.5 1.6 1.6 C19orf66
FLJ20035 3.8 3.0 3.6 2.7 2.5 2.6 2.7 DDX60
H1F0 3.1 1.6 2.1 1.8 1.9 2.1 2.5 H1 histone family, member 0
HERC5 4.5 2.1 4.1 2.5 2.6 2.5 2.7 Ubiquitin ligase/mediates ISGylation of protein targets
HERC6 5.9 4.1 5.7 4.1 4.1 4.2 4.2 Ubiquitin ligase
HIST1H1C 2.6 1.6 2.4 1.7 2.6 2.4 3.2 histone cluster 1, H1c
HIST1H2AE 2.4 2.0 3.3 2.1 2.5 2.6 3.8 histone cluster 1, H2ae
HIST1H2BC 2.5 2.0 2.7 1.9 2.0 2.2 2.8 histone cluster 1, H2bg///histone cluster 1, H2bc
HIST1H2BD 2.1 1.7 2.3 1.6 1.7 1.6 2.2 histone cluster 1, H2bd
HIST1H2BF 2.4 1.9 2.5 1.8 1.9 1.5 2.2 histone cluster 1, H2bf
HIST1H2BG 4.3 2.8 3.6 3.5 3.3 2.4 3.4 histone cluster 1, H2bg
HIST1H2BI 2.4 1.9 2.5 1.9 2.0 1.5 2.2 histone cluster 1, H2bi
HIST2H2AA3 3.1 1.8 2.8 1.8 2.1 2.1 2.8 histone cluster 2, H2aa3///histone cluster 2, H2aa4
IFI27 73.3 70.3 98.0 93.5 94.8 97.4 107.7 interferon, alpha-inducible protein 27 (ISG12, P27)
IFI35 3.2 2.0 2.9 2.0 1.8 1.9 1.9 interferon-induced protein 35
IFI44 7.1 4.8 6.5 4.8 4.5 5.2 5.0 Interferon-induced protein 44, p44
IFI44L 10.1 8.2 9.7 7.6 7.5 8.0 8.4 interferon-induced protein 44-like
IFIH1 3.3 2.0 3.3 2.4 2.1 2.3 2.2 interferon induced with helicase C domain 1
IFIT1 12.2 4.1 9.9 6.0 4.8 5.6 4.8 interferon-induced protein with tetratricopeptide
repeats 1
IFIT3 7.1 3.3 6.8 3.8 3.4 3.5 3.9 interferon-induced protein with tetratricopeptide
repeats 3
IFIT5 2.7 1.9 2.7 2.4 2.0 2.2 1.8 interferon-induced protein with tetratricopeptide
repeats 5
IFITM1 2.0 1.6 1.9 1.7 1.7 1.7 1.7 interferon induced transmembrane protein 1 (9–27)
IFITM3 2.2 1.8 2.1 1.8 1.7 1.8 2.0 interferon induced transmembrane protein 3 (1-8U)
IRF7 3.7 2.4 3.3 2.5 2.2 2.5 2.4 interferon regulatory factor 7
ISG15 6.8 3.8 6.6 4.0 3.9 4.4 4.2 ISG15 ubiquitin-like modifier
ISG20 2.5 1.8 2.6 1.8 1.7 1.6 1.7 interferon stimulated exonuclease gene 20kDa
LAMP3 6.0 3.1 6.7 3.3 3.8 3.9 4.4 lysosomal-associated membrane protein 3
LGALS3BP 4.0 2.2 4.0 2.8 2.6 3.0 3.1 lectin, galactoside-binding, soluble, 3 binding protein
LOC26010 4.3 2.5 4.2 3.0 3.0 3.1 3.3 viral DNA polymerase-transactivated protein 6
LOC391020 2.7 2.0 2.7 2.2 2.1 2.2 2.5 interferon induced transmembrane protein pseudogene
LY6E 4.1 2.7 4.0 3.1 2.8 3.0 3.4 lymphocyte antigen 6 complex, locus E
MX1 5.0 3.5 4.9 3.8 3.7 3.9 4.1 myxovirus (influenza virus) resistance 1, interferon-
inducible protein p78 (mouse)
MX2 3.1 2.1 2.9 2.2 2.2 2.3 2.4 myxovirus (influenza virus) resistance 2 (mouse)
N4BP1 1.5 1.5 1.7 1.6 1.6 1.7 1.6 Nedd4 binding protein 1
OAS1 4.3 2.4 3.8 2.5 2.1 2.3 2.3 2',5'-oligoadenylate synthetase 1, 40/46kDa
OAS2 3.5 2.4 3.4 2.9 2.4 2.5 2.5 2'-5'-oligoadenylate synthetase 2, 69/71kDa
OAS3 4.5 2.6 3.8 2.7 2.3 2.5 2.8 2'-5'-oligoadenylate synthetase 3, 100kDa
OASL 4.6 2.1 4.1 2.7 2.2 2.5 2.6 2'-5'-oligoadenylate synthetase-like
PARP12 2.4 1.8 2.3 1.8 1.8 1.9 1.9 poly (ADP-ribose) polymerase family, member 12
PHF11 1.8 1.6 1.8 1.6 1.7 1.7 1.7 PHD finger protein 11
PLSCR1 3.1 1.9 2.8 2.1 2.1 2.1 2.4 phospholipid scramblase 1
RNASE2 2.9 1.9 2.3 1.8 1.7 1.7 1.9 ribonuclease, RNase A family, 2
(liver, eosinophil-derived neurotoxin)
RSAD2 12.8 5.3 11.6 6.8 6.4 6.4 6.6 radical S-adenosyl methionine domain containing 2
SAMD9 3.8 2.1 3.3 2.6 2.1 2.1 2.0 sterile alpha motif domain containing 9
SERPING1 4.9 1.9 4.1 2.3 1.9 2.0 2.1 serpin peptidase inhibitor, clade G (C1 inhibitor),
member 1, (angioedema, hereditary)
SIGLEC1 27.1 16.5 23.1 17.0 13.7 18.2 20.9 sialic acid binding Ig-like lectin 1, sialoadhesin
Journal of Translational Medicine 2008, 6:66 />Page 9 of 15
(page number not for citation purposes)
ment in our previous study [2]. It is possible that it has
direct anti-hepatitis C activity. TNFAIP6 (TSG6) is also
induced early; its gene product has been show to have
anti-inflammatory activity and may inhibit TNF activity
by a feed back loop [38,39].
AIM2 has been identified as part of a cluster of homolo-
gous genes (MNDA, IFI16 and AIM2) on human chromo-
some 1 [40] referred to as IFI or HIN-200 genes. It has
been suggested that AIM2 functions as a tumor suppressor
gene [41], however, over expression of AIM2 in another
study did not induce a tumor suppressor phenotype [42].
AIM2 has homology to IFI16. However, whereas IFI16 is
induced and highly expressed throughout the treatment
period, AIM2 is not, indicating that the regulation of this
gene differs from that of other HIN-200 family members.
TLR1 and FLN29 (TRAFD1), regulators of toll like recep-
tor signaling [43], are both transiently induced. TLR1 is
involved in recognition of viral antigens, and is found on
the surface of most immune cells. On the other hand,
TLR7 is induced through out the 10 week period.
CDKN1C (cyclin dependent kinase inhibitor 1C, alias
p57, Kip2) behaves differently from all the other genes.
The mRNA for this gene is elevated early, both in this trial
and in the Virahep C trial, but is severely repressed at later
times rather than returning to base line. This gene product
is an inhibitor of several G1 cyclin/CdK complexes and a
negative regulator of cell proliferation. CDKN1C plays a
role in cell proliferation, differentiation, apoptosis,
tumorgenesis and developmental changes. It has been
reported that the CDKN1C protein physically interacts
with and inhibits the c-Jun NH2-terminal kinase/stress
activated protein kinase (JNK/SAPK) [44]. It has also been
reported to bind to the proliferating cell nuclear antigen
(PCNA), and thus control the cell cycle [45]. This is the
first report that this gene is regulated by interferon or rib-
avirin. Its role in the interferon/ribavirin response is
unknown.
Late Gene Induction
One area very rarely studied is the change in profile of
gene induction after a few weeks of treatment with IFN
and ribavirin. Most of the late genes probably represent
secondary or tertiary events, and include genes involved in
hemopoiesis, hemoglobin complex formation, and oxy-
gen transport and binding. Genes for the synthesis of
hemoglobin delta and gamma are enhanced. There is no
enhanced synthesis of HBA or HBB, both of which are
expressed at high levels. Carbonic anhydrase, which has
been associated previously with erythrocytes [46], is also
highly induced late in treatment. We noted that this gene
was also induced late in patients in the Virahep C study.
Its importance in blood chemistry or response to inter-
feron is unknown. Glycophorins A (GYPA) and B (GYPB)
are major sialoglycoproteins of the human erythrocyte
membrane which bear the antigenic determinants for the
MN and Ss blood groups [47]. The enhanced synthesis of
these genes also indicates changes in the synthesis of
erythrocytes. These changes may reflect the side effects of
interferon or more likely ribavirin therapy. The major
clinical side effect of ribavirin is a hemolytic anemia
[48,49], and thus the changes in expression of these genes
may represent compensatory responses.
SP100 1.9 1.7 1.9 1.6 1.6 1.5 1.8 SP100 nuclear antigen
SP110 1.9 1.5 1.9 1.5 1.5 1.5 1.6 SP110 nuclear body protein
USP18 7.4 4.9 7.5 5.1 4.5 5.3 5.5 ubiquitin specific peptidase 18
XAF1 4.3 3.3 3.8 2.9 2.9 2.5 3.1 XIAP associated factor-1
ZBP1 3.0 2.2 3.0 2.2 2.1 2.2 2.2 Z-DNA binding protein 1
ZCCHC2 2.3 1.9 2.2 1.7 1.8 1.8 1.8 zinc finger, CCHC domain containing 2
cDNA CSODK002YF13 3.3 2.6 3.4 2.6 2.5 2.7 2.8 Full-length cDNA clone CS0DK002YF13 of HeLa cells
Cot 25-normalized of Homo sapiens (human)
cDNA FLJ11754 3.1 2.4 3.1 2.3 2.6 2.6 2.6 CDNA FLJ11754 fis, clone HEMBA1005588
Down regulated
ALDH1A1 -1.5 -1.7 -1.7 -2.0 -2.5 -2.5 -2.6 aldehyde dehydrogenase 1 family, member A1
CDKN1C 1.9 -2.1 -1.1 -1.7 -1.7 -1.7 -1.7 cyclin-dependent kinase inhibitor 1C (p57, Kip2)
EIF3EIP -2.0 -1.6 -2.0 -1.8 -1.6 -1.6 -1.7 eukaryotic translation initiation factor 3, subunit E
interacting protein
EIF4B -2.0 -1.5 -2.0 -1.6 -1.5 -1.9 -1.8 eukaryotic translation initiation factor 4B
FCER1A -1.5 -1.7 -2.1 -2.2 -2.4 -3.0 -2.8 Fc fragment of IgE, high affinity I, receptor for; alpha
polypeptide
INSR -1.5 -1.6 -1.6 -1.9 -2.0 -2.0 -1.6 insulin receptor
LTA4H -1.7 -1.7 -2.0 -1.7 -1.6 -1.6 -1.6 leukotriene A4 hydrolase
PAPSS2 -1.7 -1.7 -1.8 -1.6 -1.6 -1.3 -1.6 3'-phosphoadenosine 5'-phosphosulfate synthase 2
PID1 -2.0 -1.8 -2.3 -1.8 -1.8 -1.9 -1.9 phosphotyrosine interaction domain containing 1
RTN1 -2.2 -1.9 -2.3 -2.0 -2.0 -2.0 -2.3 reticulon 1
Values in italics are not significant.
Table 4: Genes differentially expressed (1.5-fold) at ≥ 6 time points (Continued)
Journal of Translational Medicine 2008, 6:66 />Page 10 of 15
(page number not for citation purposes)
Patient Variation
In both this study, and our previous one [2], we noted
considerable variability in the initial levels of gene expres-
sion among subjects. Thus both studies were designed to
examine the changes from this baseline; such a design
allowed robust detection of the effects of interferon, and
as noted above most changes were consistent between the
two studies (Table 7) The clinical results of this trial are
Table 5: Transiently induced genes
Symbol Fold Change Description
ABCA1 1.8 ATP-binding cassette, sub-family A (ABC1), member 1
ABCC3 1.7 ATP-binding cassette, sub-family C (CFTR/MRP), member 3
AIM2 1.6 Related to IFI16
ARRB1 1.7 arrestin, beta 1
C1QA 1.6 complement component 1, q subcomponent, A chain
C1QB 2.0 complement component 1, q subcomponent, B chain
CALML4 1.8 calmodulin-like 4
CDKN1C 2.2 cyclin-dependent kinase inhibitor 1C (p57, Kip2)
CMKLR1 2.0 chemokine-like receptor 1, chimerin
CTSL1 2.4 cathepsin L1 (lysosomal cysteine proteinase)
CUTL1 1.5 cut-like 1, CCAAT displacement protein (Drosophila)
CXCL10 4.0 chemokine (C-X-C motif) ligand 10
FAM46A 1.6 family with sequence similarity 46, member A
FFAR2 (GPR43) 2.7 free fatty acid receptor 2.
hCG_1776259 1.9 hypothetical protein FLJ23556 (unknown function)
IL1RN 2.1 interleukin 1 receptor antagonist
JAK2 1.7 Janus kinase 2 (a protein tyrosine kinase)
LILRA3 1.6 leukocyte immunoglobulin-like receptor, subfamily A (without TM domain), member 3
MARCKS 2.4 myristoylated alanine-rich protein kinase C substrate
RHOB 1.7 ras homolog gene family, member B
RRAS 1.9 related RAS viral (r-ras) oncogene homolog
SAMD4A 2.6 sterile alpha motif domain containing 4A
SLC31A2 1.7 solute carrier family 31 (copper transporters), member 2
TCN2 2.2 transcobalamin II; macrocytic anemia
TLR1 1.6 toll-like receptor 1
TNFAIP6 (TSG-6) 2.1 tumor necrosis factor, alpha-induced protein 6
TNFSF10 (TRAIL) 2.3 tumor necrosis factor (ligand) superfamily, member 10
TRAFD1 (FLN29) 2.0 TRAF-type zinc finger domain containing 1
VDR 1.6 vitamin D (1,25- dihydroxyvitamin D3) receptor
Genes are significantly induced at day 3 but either not induced at any other time point, or day 3 fold change is at least 20% higher than other days.
Table 6: Genes induced late
Symbol Day 3 Day 6 Day 10 Day 13 Day 27 Day 42 Day 70 Description
CA1 -1.4 1.1 3.8 8.9 13.9 15.2 21.2 carbonic anhydrase I
FKBP8 1.2 -1.1 1.4 2.7 2.1 2.7 3.5 FK506 binding protein 8, 38kDa
GYPA 1.5 1.3 4.5 8.4 14.7 15.5 17.3 glycophorin A (MNS blood group)
GYPB -1.1 -1.1 1.7 2.9 4.8 4.4 5.0 glycophorin B (MNS blood group)
GYPB 1.2 -1.0 2.4 4.5 6.0 6.5 7.5 glycophorin B (MNS blood group)
GYPB///GYPE -1.1 -1.0 1.5 2.7 3.2 3.3 3.7 glycophorin B (MNS blood group)///glycophorin E
HBD -1.1 -1.0 2.8 4.8 7.6 7.0 9.4 hemoglobin, delta
HBG1///HBG2 -1.2 -1.2 1.6 2.5 4.7 4.7 6.5 hemoglobin, gamma A///hemoglobin, gamma G
HBG2 -1.2 -1.3 1.8 2.5 5.0 5.0 6.8 hemoglobin, gamma G
HIST1H3H 1.5 1.5 2.0 1.4 1.8 1.9 2.8 histone cluster 1, H3h
LCN2 1.8 1.3 2.6 1.9 1.8 1.8 2.8 lipocalin 2 (oncogene 24p3)
MYL4 1.0 1.1 1.4 1.9 2.5 2.5 3.2 myosin, light chain 4, alkali; atrial, embryonic
MYL4 -1.0 -1.1 1.4 2.2 2.9 3.2 3.7 myosin, light chain 4, alkali; atrial, embryonic
SLC14A1 -1.2 1.1 1.2 1.9 1.9 2.1 2.2 solute carrier family 14
(urea transporter), member 1 (Kidd blood group)
TAL1 1.1 -1.3 1.4 1.6 2.1 1.9 2.7 T-cell acute lymphocytic leukemia 1
TRIM58 1.7 -1.1 2.5 2.6 4.0 3.3 4.2 tripartite motif-containing 58
Values in italics not significant when compared to base line.
Journal of Translational Medicine 2008, 6:66 />Page 11 of 15
(page number not for citation purposes)
To illustrate the pattern of expression across time-points, data from the top 90 genes (by p-value) across all time points were clustered by Pearson DissimilarityFigure 2
To illustrate the pattern of expression across time-points, data from the top 90 genes (by p-value) across all
time points were clustered by Pearson Dissimilarity. Arrays (horizontal axis) are arranged in the order of time point
(day) and within each time point by Non-Responder(NR) and Responder (R) as determined by viral titer at week 72 (final
response in table 2). Expression values were normalized after clustering.
Journal of Translational Medicine 2008, 6:66 />Page 12 of 15
(page number not for citation purposes)
similar to previously reported trials in genotype I naïve
patients [1,2,7,8,50]. The sustained viral response rate
(SVR) was approximately 35%. Only three patients
showed a rapid response to interferon/ribavirin therapy,
with an immediate decrease in viral titer. Ten patients
showed no decrease in virus titer, and 7 showed a biphasic
decrease. However the rate of initial viral decrease for the
7 patients with a biphasic curve was not predictive of final
response in this small study. Two patients showed a return
of virus at week 42 although one had cleared at week 10
the other by week 12. Perhaps HCV can normally interfere
with the interferon response through binding to RIG-I
[51,52] and the mutated virus is the exception and sensi-
tive to interferon treatment. This is supported by recent
work in which it has been shown there is more variability
in RNA sequence in virus from responders than in non-
responders[53]. The occurrence of relapsers could be due
to reversion of such " mutated" virus to wild type and res-
toration of resistance to treatment. The presence of
relapsers also indicates that virus is "hiding" in either the
liver or cells of the immune system or is present at non-
detectable levels in the serum.
Conclusion
We have used multiple time points to measure gene
expression. It is obvious from our data that a single meas-
urement might give misleading data on gene expression
and thus mechanism of action of the drug combination.
This can be seen in particular with genes that are only
transiently expressed, or that vary during treatment.
Because both this study and the earlier Virahep C study [2]
show a peak in the effects of interferon within the first 3
days after interferon, and a decline toward baseline before
the next injection, it suggests that treatment more fre-
Gene expression profile over time of the 10 genes most differentially expressed, plotted as percentage of maximum signal with points were connected by natural cubic splinesFigure 3
Gene expression profile over time of the 10 genes most differentially expressed, plotted as percentage of max-
imum signal with points were connected by natural cubic splines.
Journal of Translational Medicine 2008, 6:66 />Page 13 of 15
(page number not for citation purposes)
quently than once a week, at least during the first month
of treatment, might be more efficacious. The effects of
more frequent treatment could be measured using the
responses of a few key genes as a function of time. How-
ever it is also possible that the receptor sites are down reg-
ulated and require some time to be reactivated [54] or
resynthesized. No major differences were found in gene
induction or down regulation patterns between this study
and that of Virahep C. Thus the location of the pegylation
and structure of the interferon does not appear to be
important in vivo, although it does alter the anti-viral
activity in vitro [14]. This could suggest that the receptor
sites for interferon are saturated in vivo, and that the activ-
ities once bound to the receptor are identical. It should be
noted that the patients treated in this study received lower
doses of interferon. We could find no relationship
between response to therapy and gene induction in this
trial, perhaps because of the very low number of rapid and
sustained responders.
Competing interests
Dr. Paul Kwo is a Scientific Advisor to Schering- Plough.
Authors' contributions
This Ms was written and data interpreted by MWT. TT was
employed as a bio-informaticist and together with JNM
performed statistical analysis. HJE as head of the Center
for Medical Genomics helped write the manuscript. PK
ran the clinical study.
Additional material
Acknowledgements
We wish to thank Mary Ferris for the preparation of cells and the extrac-
tion of RNA.
This research was supported from a grant from Integrated Therapeutics
(Schering Inc.) Microarrays were processed at the Center for Medical
Genomics which is supported in part by a grant from the Indiana Genomics
Initiative (INGEN, which is supported in part by The Lilly Endowment Inc.).
References
1. Conjeevaram HS, Fried MW, Jeffers LJ, Terrault NA, Wiley-Lucas TE,
Afdhal N, Brown RS, Belle SH, Hoofnagle JH, Kleiner DE, Howell CD:
Peginterferon and ribavirin treatment in African American
and Caucasian American patients with hepatitis C genotype
1. Gastroenterology 2006, 131:470-477.
Additional file 1
List of genes with significant differential expression for at least one
time point
Click here for file
[ />5876-6-66-S1.pdf]
Additional file 2
Comparison of fold changes for genes differentially expressed at day 3
for this study and the ViraHep C study
Click here for file
[ />5876-6-66-S2.pdf]
Table 7: Comparison of fold changes between Pegaysy and Peg-intron at day 3
Gene Symbol Probe Set ID Gene Title Pegasys
1
PegIntron
2
IFI27 202411_at interferon, alpha-inducible protein 27 46.6 73.3
SIGLEC1 219519_s_at sialic acid binding Ig-like lectin 1, sialoadhesin 15.7 27.1
CCL2 216598_s_at chemokine (C-C motif) ligand 2 15.1 13.4
RSAD2 213797_at radical S-adenosyl methionine domain containing 2 11.7 12.8
IFIT1 203153_at interferon-induced protein with tetratricopeptide repeats 1 11.3 12.2
HESX1 211267_at HESX homeobox 1 14.7 11.5
IFI44L 204439_at interferon-induced protein 44-like 6.5 10.1
USP18 219211_at ubiquitin specific peptidase 18///similar to ubiquitin specific peptidase 18 5.6 7.4
IFIT3 204747_at interferon-induced protein with tetratricopeptide repeats 3 7.6 7.1
IFI44 214059_at Interferon-induced protein 44 4.8 7.1
ISG15 205483_s_at ISG15 ubiquitin-like modifier 6.2 6.8
SIGLEC1 44673_at sialic acid binding Ig-like lectin 1, sialoadhesin 5.5 6.4
LAMP3 205569_at lysosomal-associated membrane protein 3 4.1 6.0
IFI44 214453_s_at interferon-induced protein 44 4.5 6.0
HERC6 219352_at hect domain and RLD 6 4.2 5.9
MX1 202086_at myxovirus (influenza virus) resistance 1, interferon-inducible protein p78 (mouse) 4.3 5.0
SERPING1 200986_at serpin peptidase inhibitor, clade G
(C1 inhibitor), member 1, (angioedema, hereditary)
4.0 4.9
OASL 205660_at 2'-5'-oligoadenylate synthetase-like 4.9 4.6
HERC5 219863_at hect domain and RLD 5 4.4 4.5
OAS3 218400_at 2'-5'-oligoadenylate synthetase 3, 100 kDa 4.1 4.5
1
Fold-changes in Virahep C study []
2
Fold-changes in this study.
Journal of Translational Medicine 2008, 6:66 />Page 14 of 15
(page number not for citation purposes)
2. Taylor MW, Tsukahara T, Brodsky L, Schaley J, Sanda C, Stephens MJ,
McClintick JN, Edenberg HJ, Li L, Tavis JE, et al.: Changes in gene
expression during pegylated interferon and ribavirin therapy
of chronic hepatitis C virus distinguish responders from non-
responders to antiviral therapy. J Virol 2007, 81:3391-3401.
3. Alter MJ: Epidemiology of hepatitis C virus infection. World J
Gastroenterol 2007, 13:2436-2441.
4. Fried MW, Shiffman ML, Reddy KR, Smith C, Marinos G, Goncales FL
Jr, Haussinger D, Diago M, Carosi G, Dhumeaux D, et al.: Peginter-
feron alfa-2a plus ribavirin for chronic hepatitis C virus infec-
tion. N Engl J Med 2002, 347:975-982.
5. Kozlowski A, Charles SA, Harris JM: Development of pegylated
interferons for the treatment of chronic hepatitis C. BioDrugs
2001, 15:419-429.
6. Kamal SM, Fehr J, Roesler B, Peters T, Rasenack JW: Peginterferon
alone or with ribavirin enhances HCV-specific CD4 T-helper
1 responses in patients with chronic hepatitis C. Gastroenterol-
ogy 2002, 123:1070-1083.
7. Zeuzem S, Herrmann E, Lee JH, Fricke J, Neumann AU, Modi M,
Colucci G, Roth WK: Viral kinetics in patients with chronic
hepatitis C treated with standard or peginterferon alpha2a.
Gastroenterology 2001, 120:1438-1447.
8. Manns MP, McHutchison JG, Gordon SC, Rustgi VK, Shiffman M, Rein-
dollar R, Goodman ZD, Koury K, Ling M, Albrecht JK: Peginter-
feron alfa-2b plus ribavirin compared with interferon alfa-2b
plus ribavirin for initial treatment of chronic hepatitis C: a
randomised trial. Lancet 2001, 358:958-965.
9. Shiffman ML: Pegylated interferons: what role will they play in
the treatment of chronic hepatitis C? Curr Gastroenterol Rep
2001, 3:30-37.
10. Glue P, Fang JW, Rouzier-Panis R, Raffanel C, Sabo R, Gupta SK, Salfi
M, Jacobs S: Pegylated interferon-alpha2b: pharmacokinetics,
pharmacodynamics, safety, and preliminary efficacy data.
Hepatitis C Intervention Therapy Group. Clin Pharmacol Ther
2000, 68:556-567.
11. Grace MJ, Lee S, Bradshaw S, Chapman J, Spond J, Cox S, Delorenzo
M, Brassard D, Wylie D, Cannon-Carlson S, et al.: Site of pegylation
and polyethylene glycol molecule size attenuate interferon-
alpha antiviral and antiproliferative activities through the
JAK/STAT signaling pathway. J Biol Chem 2005, 280:6327-6336.
12. Grace M, Youngster S, Gitlin G, Sydor W, Xie L, Westreich L, Jacobs
S, Brassard D, Bausch J, Bordens R: Structural and biologic char-
acterization of pegylated recombinant IFN-alpha2b. J Inter-
feron Cytokine Res 2001, 21:1103-1115.
13. Certa U, Wilhelm-Seiler M, Foser S, Broger C, Neeb M: Expression
modes of interferon-alpha inducible genes in sensitive and
resistant human melanoma cells stimulated with regular and
pegylated interferon-alpha. Gene 2003, 315:79-86.
14. Grace MJ, Cutler D: Pegylating IFNs at his-34 improves the in
vitro antiviral activity through the JAK/STAT pathway. Antivir
Chem Chemother 2004, 15:287-297.
15. Brassard DL, Delorenzo MM, Cox S, Leaman DW, Sun Y, Ding W,
Gavor S, Spond J, Goodsaid F, Bordens R, Grace MJ: Regulation of
gene expression by pegylated IFN-alpha2b and IFN-alpha2b
in human peripheral blood mononuclear cells. J Interferon
Cytokine Res 2004, 24:455-469.
16. Kim SH, Cohen B, Novick D, Rubinstein M: Mammalian type I
interferon receptors consists of two subunits: IFNaR1 and
IFNaR2. Gene 1997, 196:279-286.
17. Schindler C: Cytokines and JAK-STAT signaling. Exp Cell Res
1999, 253:7-14.
18. Brierley MM, Fish EN: Review: IFN-alpha/beta receptor interac-
tions to biologic outcomes: understanding the circuitry. J
Interferon Cytokine Res 2002, 22:835-845.
19. Brierley MM, Fish EN: Stats: multifaceted regulators of tran-
scription. J Interferon Cytokine Res 2005, 25:733-744.
20. van Boxel-Dezaire AH, Rani MR, Stark GR: Complex modulation
of cell type-specific signaling in response to type I interfer-
ons. Immunity 2006,
25:361-372.
21. van Boxel-Dezaire AH, Stark GR: Cell type-specific signaling in
response to interferon-gamma. Curr Top Microbiol Immunol 2007,
316:119-154.
22. Der SD, Zhou A, Williams BR, Silverman RH: Identification of
genes differentially regulated by interferon alpha, beta, or
gamma using oligonucleotide arrays. Proc Natl Acad Sci USA
1998, 95:15623-15628.
23. Taylor MW, Grosse WM, Schaley JE, Sanda C, Wu X, Chien SC, Smith
F, Wu TG, Stephens M, Ferris MW, et al.: Global effect of PEG-
IFN-alpha and ribavirin on gene expression in PBMC in vitro.
J Interferon Cytokine Res 2004, 24:107-118.
24. Tan H, Derrick J, Hong J, Sanda C, Grosse WM, Edenberg HJ, Taylor
M, Seiwert S, Blatt LM: Global transcriptional profiling combi-
nation of type I and type II demonstrates the interferon
enhances antiviral and immune responses at clinically rele-
vant doses. J Interferon Cytokine Res 2005, 25(10):632-649.
25. Sanda C, Weitzel P, Tsukahara T, Schaley J, Edenberg HJ, Stephens
MA, McClintick JN, Blatt LM, Li L, Brodsky L, Taylor MW: Differen-
tial Gene Induction by Type I and Type II Interferons and
Their Combination. J Interferon Cytokine Res 2006, 26:462-472.
26. Brodsky LI, Wahed AS, Li J, Tavis JE, Tsukahara T, Taylor MW: A
novel unsupervised method to identify genes important in
the anti-viral response: application to interferon/ribavirin in
hepatitis C patients. PLoS ONE 2007, 2:e584.
27. McClintick JN, Edenberg HJ: Effect of filtering by Present call on
analysis of microarray experiments. BMC Bioinformatics 2006,
7:49.
28. Storey JD, Xiao W, Leek JT, Tompkins RG, Davis RW: Significance
analysis of time course microarray experiments. Proc Natl
Acad Sci USA 2005, 102:12837-12842.
29. Benjamini YaHY: Controlling the false discovery rate: A practi-
cal andpowerful approach to multiple testing. Journal of the
Royal Statistical Society B 1995, 57:289-300.
30. Su AI, Pezacki JP, Wodicka L, Brideau AD, Supekova L, Thimme R,
Wieland S, Bukh J, Purcell RH, Schultz PG, Chisari FV:
Genomic
analysis of the host response to hepatitis C virus infection.
Proc Natl Acad Sci USA 2002, 99:15669-15674.
31. Ji X, Cheung R, Cooper S, Li Q, Greenberg HB, He XS: Interferon
alfa regulated gene expression in patients initiating inter-
feron treatment for chronic hepatitis C. Hepatology 2003,
37:610-621.
32. de Veer MJ, Holko M, Frevel M, Walker E, Der S, Paranjape JM, Sil-
verman RH, Williams BR: Functional classification of interferon-
stimulated genes identified using microarrays. J Leukoc Biol
2001, 69:912-920.
33. Lagging M, Romero AI, Westin J, Norkrans G, Dhillon AP, Pawlotsky
JM, Zeuzem S, von Wagner M, Negro F, Schalm SW, et al.: IP-10 pre-
dicts viral response and therapeutic outcome in difficult-to-
treat patients with HCV genotype 1 infection. Hepatology
2006, 44:1617-1625.
34. Romero AI, Lagging M, Westin J, Dhillon AP, Dustin LB, Pawlotsky JM,
Neumann AU, Ferrari C, Missale G, Haagmans BL, et al.: Interferon
(IFN)-gamma-inducible protein-10: association with histo-
logical results, viral kinetics, and outcome during treatment
with pegylated IFN-alpha 2a and ribavirin for chronic hepati-
tis C virus infection. J Infect Dis 2006, 194:895-903.
35. Cotler SJ, Craft T, Ferris M, Morrisey M, McCone J, Reddy KR, Con-
rad A, Jensen DM, Albrecht J, Taylor MW: Induction of IL-1Ra in
resistant and responsive hepatitis C patients following treat-
ment with IFN-con1. J Interferon Cytokine Res 2002, 22:549-554.
36. Gibellini D, Re MC, Ponti C, Maldini C, Celeghini C, Cappellini A, La
Placa M, Zauli G: HIV-1 Tat protects CD4+ Jurkat T lymphob-
lastoid cells from apoptosis mediated by TNF-related apop-
tosis-inducing ligand. Cell Immunol 2001, 207:89-99.
37. Warke RV, Martin KJ, Giaya K, Shaw SK, Rothman AL, Bosch I:
TRAIL is a novel antiviral protein against dengue virus. J Virol
2008, 82:555-564.
38. Wisniewski HG, Vilcek J: TSG-6: an IL-1/TNF-inducible protein
with anti-inflammatory activity. Cytokine Growth Factor Rev 1997,
8:143-156.
39. Milner CM, Day AJ: TSG-6: a multifunctional protein associ-
ated with inflammation. J Cell Sci 2003, 116:1863-1873.
40. Landolfo S, Gariglio M, Gribaudo G, Lembo D: The Ifi 200 genes:
an emerging family of IFN-inducible genes. Biochimie 1998,
80:721-728.
41. Chen IF, Ou-Yang F, Hung JY, Liu JC, Wang H, Wang SC, Hou MF,
Hortobagyi GN, Hung MC: AIM2 suppresses human breast can-
cer cell proliferation in vitro and mammary tumor growth in
a mouse model. Mol Cancer Ther 2006, 5:1-7.
42. Cresswell KS, Clarke CJ, Jackson JT, Darcy PK, Trapani JA, Johnstone
RW: Biochemical and growth regulatory activities of the
HIN-200 family member and putative tumor suppressor
protein, AIM2. Biochem Biophys Res Commun 2005, 326:417-424.
Publish with BioMed Central and every
scientist can read your work free of charge
"BioMed Central will be the most significant development for
disseminating the results of biomedical research in our lifetime."
Sir Paul Nurse, Cancer Research UK
Your research papers will be:
available free of charge to the entire biomedical community
peer reviewed and published immediately upon acceptance
cited in PubMed and archived on PubMed Central
yours — you keep the copyright
Submit your manuscript here:
/>BioMedcentral
Journal of Translational Medicine 2008, 6:66 />Page 15 of 15
(page number not for citation purposes)
43. Mashima R, Saeki K, Aki D, Minoda Y, Takaki H, Sanada T, Kobayashi
T, Aburatani H, Yamanashi Y, Yoshimura A: FLN29, a novel inter-
feron- and LPS-inducible gene acting as a negative regulator
of toll-like receptor signaling. J Biol Chem 2005,
280:41289-41297.
44. Chang TS, Kim MJ, Ryoo K, Park J, Eom SJ, Shim J, Nakayama KI,
Nakayama K, Tomita M, Takahashi K, et al.: p57KIP2 modulates
stress-activated signaling by inhibiting c-Jun NH2-terminal
kinase/stress-activated protein Kinase. J Biol Chem 2003,
278:48092-48098.
45. Watanabe H, Pan ZQ, Schreiber-Agus N, DePinho RA, Hurwitz J,
Xiong Y: Suppression of cell transformation by the cyclin-
dependent kinase inhibitor p57KIP2 requires binding to pro-
liferating cell nuclear antigen. Proc Natl Acad Sci USA 1998,
95:1392-1397.
46. Lodish HF, Berk A, Zipursky SL, Matsudaira P, Baltimore D, Darnell
JE: Molecular Cell Biology New York: W.H. Freeman and Company;
2000.
47. Dean L: Blood Groups and Red Cell Antigens. NCBI 2006.
48. Saito H, Tada S, Ebinuma H, Ishii H, Kashiwazaki K, Takahashi M, Tsu-
kada N, Nishida J, Tanaka S, Shiozaki H, Hibi T: Role of erythro-
cytes as a reservoir for ribavirin and relationship with
adverse reactions in the early phase of interferon combina-
tion therapy for chronic hepatitis C virus infections. J Clin
Microbiol 2006, 44:3562-3568.
49. Russmann S, Grattagliano I, Portincasa P, Palmieri VO, Palasciano G:
Ribavirin-induced anemia: mechanisms, risk factors and
related targets for future research. Curr Med Chem 2006,
13:3351-3357.
50. Reddy KR, Wright TL, Pockros PJ, Shiffman M, Everson G, Reindollar
R, Fried MW, Purdum PP 3rd, Jensen D, Smith C, et al.: Efficacy and
safety of pegylated (40-kd) interferon alpha-2a compared
with interferon alpha-2a in noncirrhotic patients with
chronic hepatitis C. Hepatology 2001, 33:433-438.
51. Tasaka M, Sakamoto N, Itakura Y, Nakagawa M, Itsui Y, Sekine-Osa-
jima Y, Nishimura-Sakurai Y, Chen CH, Yoneyama M, Fujita T, et al.:
Hepatitis C virus non-structural proteins responsible for sup-
pression of the RIG-I/Cardif-induced interferon response. J
Gen Virol 2007, 88:3323-3333.
52. Johnson CL, Owen DM, Gale M Jr: Functional and therapeutic
analysis of hepatitis C virus NS3.4A protease control of anti-
viral immune defense.
J Biol Chem 2007, 282:10792-10803.
53. Donlin MJ, Cannon NA, Yao E, Li J, Wahed A, Taylor MW, Belle SH,
Di Bisceglie AM, Aurora R, Tavis JE: Pretreatment sequence
diversity differences in the full-length hepatitis C virus open
reading frame correlate with early response to therapy. J
Virol 2007, 81:8211-8224.
54. Ito K, Tanaka H, Ito T, Sultana TA, Kyo T, Imanaka F, Ohmoto Y,
Kimura A: Initial expression of interferon alpha receptor 2
(IFNAR2) on CD34-positive cells and its down-regulation
correlate with clinical response to interferon therapy in
chronic myelogenous leukemia. Eur J Haematol 2004,
73:191-205.