báo cáo hóa học:" Effective transvascular delivery of nanoparticles across the blood-brain tumor barrier into malignant glioma cells" docx
Bạn đang xem bản rút gọn của tài liệu. Xem và tải ngay bản đầy đủ của tài liệu tại đây (3.67 MB, 15 trang )
BioMed Central
Page 1 of 15
(page number not for citation purposes)
Journal of Translational Medicine
Open Access
Research
Effective transvascular delivery of nanoparticles across the
blood-brain tumor barrier into malignant glioma cells
Hemant Sarin*
1,2
, Ariel S Kanevsky
2
, Haitao Wu
3
, Kyle R Brimacombe
4
,
Steve H Fung
5
, Alioscka A Sousa
1
, Sungyoung Auh
6
, Colin M Wilson
3
,
Kamal Sharma
7,8
, Maria A Aronova
1
, Richard D Leapman
1
, Gary L Griffiths
3
and Matthew D Hall
4
Address:
1
National Institute of Biomedical Imaging and Bioengineering, National Institutes of Health, Bethesda, Maryland 20892, USA,
2
Diagnostic Radiology Department, Clinical Center, National Institutes of Health, Bethesda, Maryland 20892, USA,
3
Imaging Probe Development
Center, National Heart, Lung, and Blood Institute, National Institutes of Health, Bethesda, Maryland 20892, USA,
4
Laboratory of Cell Biology,
National Cancer Institute, National Institutes of Health, Bethesda, Maryland 20892, USA,
5
Neuroradiology Department, Massachusetts General
Hospital, Boston, Massachusetts 02114, USA,
6
Biostatistics, National Institute of Neurological Disorders and Stroke, National Institutes of Health,
Bethesda, Maryland 20892, USA,
7
Metabolism Branch, National Cancer Institute, National Institutes of Health, Bethesda, Maryland 20892, USA
and
8
Division of Biologic Drug Products, Office of Oncology Products, Center for Drug Evaluation and Research, U.S. Food & Drug
Administration, Silver Spring, Maryland 20993, USA
Email: Hemant Sarin* - ; Ariel S Kanevsky - ; Haitao Wu - ;
Kyle R Brimacombe - ; Steve H Fung - ; Alioscka A Sousa - ;
Sungyoung Auh - ; Colin M Wilson - ; Kamal Sharma - ;
Maria A Aronova - ; Richard D Leapman - ; Gary L Griffiths - ;
Matthew D Hall -
* Corresponding author
Abstract
Background: Effective transvascular delivery of nanoparticle-based chemotherapeutics across the
blood-brain tumor barrier of malignant gliomas remains a challenge. This is due to our limited
understanding of nanoparticle properties in relation to the physiologic size of pores within the
blood-brain tumor barrier. Polyamidoamine dendrimers are particularly small multigenerational
nanoparticles with uniform sizes within each generation. Dendrimer sizes increase by only 1 to 2
nm with each successive generation. Using functionalized polyamidoamine dendrimer generations
1 through 8, we investigated how nanoparticle size influences particle accumulation within
malignant glioma cells.
Methods: Magnetic resonance and fluorescence imaging probes were conjugated to the
dendrimer terminal amines. Functionalized dendrimers were administered intravenously to
rodents with orthotopically grown malignant gliomas. Transvascular transport and accumulation of
the nanoparticles in brain tumor tissue was measured in vivo with dynamic contrast-enhanced
magnetic resonance imaging. Localization of the nanoparticles within glioma cells was confirmed ex
vivo with fluorescence imaging.
Results: We found that the intravenously administered functionalized dendrimers less than
approximately 11.7 to 11.9 nm in diameter were able to traverse pores of the blood-brain tumor
barrier of RG-2 malignant gliomas, while larger ones could not. Of the permeable functionalized
Published: 18 December 2008
Journal of Translational Medicine 2008, 6:80 doi:10.1186/1479-5876-6-80
Received: 20 October 2008
Accepted: 18 December 2008
This article is available from: />© 2008 Sarin et al; licensee BioMed Central Ltd.
This is an Open Access article distributed under the terms of the Creative Commons Attribution License ( />),
which permits unrestricted use, distribution, and reproduction in any medium, provided the original work is properly cited.
Journal of Translational Medicine 2008, 6:80 />Page 2 of 15
(page number not for citation purposes)
dendrimer generations, those that possessed long blood half-lives could accumulate within glioma
cells.
Conclusion: The therapeutically relevant upper limit of blood-brain tumor barrier pore size is
approximately 11.7 to 11.9 nm. Therefore, effective transvascular drug delivery into malignant
glioma cells can be accomplished by using nanoparticles that are smaller than 11.7 to 11.9 nm in
diameter and possess long blood half-lives.
Background
Progress towards the effective clinical treatment of malig-
nant gliomas has been hampered due to ineffective drug
delivery across the blood-brain tumor barrier (BBTB), in
addition to the inability to simultaneously image drug
permeation through tumor tissue [1-3]. The current para-
digm for treating malignant gliomas is the placement of
implantable 1,3-bis (2-chloroethyl)-1-nitrosourea
(BCNU, also called carmustine) wafers in the tumor resec-
tion cavity followed by administration of oral temozolo-
mide, an alkylating agent, with concurrent radiation [4-7].
BCNU, a low molecular weight nitrosourea, is able to
cross the BBTB, but is unable to accumulate within malig-
nant glioma cells at therapeutic levels due to a short blood
half-life [8]. Intra-operative placement of polymeric
wafers impregnated with BCNU along the tumor resection
cavity has resulted in improved patient outcomes, and sig-
nificantly decreased toxicity compared to that associated
with intravenous BCNU treatment [9,10]. Since this local
method of BCNU delivery circumvents the BBTB and
allows for sustained release of BCNU from the polymer,
there are higher steady-state BCNU concentrations within
the tumor resection cavity[11]. However, a major limita-
tion of this delivery method is that the placement of the
BCNU polymer wafers may only be performed at the time
of initial tumor resection [12]. Temozolomide, like
BCNU, has a low molecular weight and a short blood
half-life which limits its ability to accumulate within
malignant glioma cells [5,13].
The sizes of traditional chemotherapeutics, such as BCNU
and temozolomide, are commonly reported as particle
molecular weights since these particles are usually smaller
than 1 nm in diameter [13]. In contrast, the sizes of nan-
oparticle-based therapeutics are commonly reported as
particle diameters since these particles usually range
between 1 and 200 nm in diameter [14,15]. Particle
shapes and sizes determine how effectively particles can
be filtered by the kidneys [16-18]. Spherical nanoparticles
smaller than 5 to 6 nm and weighing less than 30 to 40 kD
are efficiently filtered by the kidneys [17]. Spherical nan-
oparticles that are larger and heavier are not efficiently fil-
tered by the kidneys; therefore, these particles possess
longer blood half-lives [19]. The BBTB of malignant glio-
mas becomes porous due to the formation of discontinu-
ities within and between endothelial cells lining the
lumens of tumor microvessels [20]. Nanoparticles smaller
than the pores within the BBTB, with long blood half-
lives, could function as effective transvascular drug deliv-
ery devices for the sustained-release of chemotherapeutics
into malignant glioma cells.
Even though fenestrations and gaps within the BBTB of
malignant gliomas allow for unimpeded passage of low
molecular weight therapeutics [21], these pores are nar-
row enough to prevent the effective transvascular passage
of most nanoparticles [22-25]. If the upper limit of the
therapeutically relevant pore size of the BBTB could be
accurately determined, then intravenously administered
nanoparticles, with long blood half-lives, could serve as
effective drug delivery vehicles across the BBTB of malig-
nant gliomas.
By performing intravital fluorescence microscopy of
xenografted human glioma microvasculature in the
mouse cranial window model, Hobbs et al. [26] observed
perivascular fluorescence 24 hours following the intrave-
nous infusion of rhodamine dye labeled liposomes of 100
nm diameters. Since then several classes of nanoparticles
have been designed to be less than 100 nm in diameter for
the purposes of effective transvascular drug delivery across
the BBTB. These classes of nanoparticles include metal-
based (i.e. iron oxide) [27], lipid-based (i.e. liposomes)
[28], and biological-based (i.e. antibodies, viruses)
[29,30].
Yet another class of nanoparticles are the polymer-based
dendrimers [2,31]. Polyamidoamine (PAMAM) dendrim-
ers [32] are multigenerational polymers with a branched
exterior consisting of surface groups that can be function-
alized with imaging [33,34], targeting [35], and therapeu-
tic agents [35,36]. PAMAM dendrimers functionalized
with low molecular weight agents remain particularly
small, typically ranging between 1.5 nm (generation 1,
G1) and 14 nm in diameter (generation 8, G8) [32,33].
Particle shapes are spherical and sizes are uniform within
a particular generation. With each successive dendrimer
generation, the number of modifiable surface groups dou-
bles while the overall diameter increases by only 1 to 2 nm
[37].
Journal of Translational Medicine 2008, 6:80 />Page 3 of 15
(page number not for citation purposes)
We hypothesized that the major reason for the ineffective-
ness of metal-based, lipid-based and biological-based
nanoparticles in traversing the BBTB of malignant gliomas
is the large size of these particles relative to the physio-
logic pore size of the BBTB. In this work, using the RG-2
malignant glioma model [38,39], we also investigated
how the transvascular transport of dendrimer nanoparti-
cles is affected by tumor volume-related differences in the
degree of BBTB breakdown.
The hyperpermeability of the BBTB of malignant gliomas
results in contrast enhancement of brain tumor tissue on
magnetic resonance imaging (MRI) scans following the
intravenous infusion of gadolinium (Gd)-diethyltri-
aminepentaacetic acid (DTPA), a low molecular weight
contrast agent [40,41]. To visualize the extravasation of
PAMAM dendrimers across the BBTB of rodent malignant
gliomas by dynamic contrast-enhanced MRI, we function-
alized the exterior of PAMAM dendrimers with Gd-DTPA.
Using dynamic contrast-enhanced MRI, we measured the
change in contrast enhancement of malignant gliomas for
up to 2 hours following the intravenous infusion of suc-
cessively higher Gd-dendrimer generations up to, and
including, Gd-G8 dendrimers. To verify that dendrimer
size, and not dendrimer generation, is the primary deter-
minant of particle blood half-life, we studied Gd-G4 den-
drimers of two different sizes. One was a lowly conjugated
Gd-G4 weighing 24.4 kD and the other was a standard
Gd-G4 weighing 39.8 kD. The Gd concentration, a surro-
gate for the amount of Gd-dendrimer within tumor tissue,
was determined by measuring the molar relaxivity of Gd-
dendrimers in vitro in combination with the change in the
blood and tissue longitudinal relaxivities (T
1
) before and
after Gd-dendrimer infusion [42]. Based on comparisons
of the contrast enhancement patterns of malignant glio-
mas for up to 2 hours, within a particular Gd-dendrimer
generation as well as across Gd-dendrimer generations,
we determined the physiologic upper limit of BBTB pore
size.
In addition to the in vivo dynamic contrast-enhanced MRI
experiments with Gd-dendrimers, we performed in vitro
and ex vivo fluorescence microscopy experiments using
rhodamine B labeled Gd- dendrimers to confirm that the
impediment to the cellular uptake of functionalized den-
drimers is the BBTB. The observations made in this study,
using functionalized dendrimers, are to serve as a guide
for designing nanoparticles that are effective at traversing
the pores of the blood-brain tumor barrier and accumulat-
ing within individual glioma cells.
Methods
PAMAM dendrimer functionalization and characterization
Bifunctional chelating agents and gadolinium-benzyl-
diethyltriaminepentaacetic acid (Gd-Bz-DTPA) function-
alized PAMAM dendrimers were synthesized according to
described procedures with minor modifications, as were
the corresponding rhodamine-substituted conjugates [43-
45]. Gd-dendrimers, with the exception of lowly conju-
gated Gd-G4, were prepared by using a molar reactant
ratio of 2:1 bifunctional chelate to dendrimer surface
amine groups. For lowly conjugated Gd-G4 a lower molar
reactant ratio of 1.1:1 was used to limit conjugation. The
duration of the chelation reaction for the lowly conju-
gated Gd-G4 was 24 hours as compared to the standard 48
hours for chelation of all other dendrimers. Rhodamine B
labeled Gd-dendrimers were prepared by stirring rhodam-
ine B isothiocyanate (RBITC) and PAMAM dendrimers at
a 1:9 molar ratio of RBITC to dendrimer surface amine
groups in methanol at room temperature for 12 hours.
Isothiocyanate activated DTPA was then added in excess
and reacted for an additional 48 hours. Gadolinium was
then chelated after the removal of the t-butyl protective
groups on DTPA. The percent by mass of Gd in each Gd-
dendrimer generation was determined by elemental anal-
ysis to be: Gd-G1 (15.0%), Gd-G2 (14.8%), Gd-G3
(12.9%), lowly conjugated Gd-G4 (12.3%), standard Gd-
G4 (12.0%), Gd-G5 (11.9%), Gd-G6 (11.9%), Gd-G7
(12.2%), Gd-G8 (10.2%). The Gd percent by mass for the
rhodamine B Gd-dendrimers was determined to be: rhod-
amine B Gd-G2 (9.6%), rhodamine B Gd-G5 (9.8%),
rhodamine B Gd-G8 (9.3%). Gd-G1 through Gd-G5 den-
drimer molecular weights were determined by matrix
assisted laser desorption/ionization time-of-flight
(MALDI-TOF) mass spectroscopy (Scripps Center for
Mass Spectrometry, La Jolla, CA). Gd percent by mass of
the Gd-dendrimer, in its solid form, was determined with
the inductively coupled plasma-atomic emission spectros-
copy (ICP-AES) method (Desert Analytics, Tucson, AZ).
Gd-dendrimer infusions were normalized to 100 mM
with respect to Gd, while rhodamine B Gd-dendrimer
infusions were normalized to 67 mM with respect to Gd,
in order to guarantee proper solvation.
In vitro scanning transmission electron microscopy
For in vitro transmission electron microscopy experi-
ments, a 5 l droplet of phosphate-buffer saline solution
containing a sample of Gd-dendrimers from generations
5, 6, 7 or 8 was absorbed onto a 3 nm-thick carbon sup-
port film covering the copper electron microscopy grids.
Lacey Formvar/carbon coated 300 meshcopper grids sup-
porting an ultrathin 3 nm evaporated carbon film were
glow-discharged an air pressure of 0.2 mbar to facilitate
Gd-dendrimer adsorption. After adsorption for 2 minutes,
excess Gd-dendrimer solution was blotted with filter
paper. The grids were then washed 5 times with 5 L aliq-
uots of deionized water, and left to dry in air. Annular
dark field scanning transmission electron microscope
(ADF STEM) images of the Gd-dendrimers were recorded
using a Tecnai TF30 electron microscope (FEI, Hillsboro,
Journal of Translational Medicine 2008, 6:80 />Page 4 of 15
(page number not for citation purposes)
OR, USA) equipped with a Schottky field-emission gun
and an in-column ADF detector (Fischione, Export, PA)
[46].
In vitro fluorescence experiments
For in vitro fluorescence experiments, RG-2 glioma cells
were plated on Fisher Premium coverslips (Fisher Scien-
tific, Pittsburgh, PA) and incubated in wells containing
sterile 3 ml DME supplemented with 10% FBS (Invitro-
gen, Carlsbad, CA). The RG-2 glioma colonies were
allowed to establish for 24 hours in an incubator set at
37°C and 5% CO
2
. Rhodamine B Gd-G2, rhodamine B
Gd-G5 or rhodamine B Gd-G8 dendrimers were added to
the medium by equivalent molar rhodamine B concentra-
tions of 7.2 M and the cells were incubated in the dark
for another 4 hours. Following incubation, cells were
washed 3 times with PBS, then 50 l DAPI-Vectashield
nuclear stain medium (Vector Laboratories, Burlingame,
CA) was placed on the coverslips for 15 minutes. Cover-
slips were then inverted and mounted on Daigger Super-
frost slides (Daigger, Vernon Hills, IL) and sealed into
place. Confocal imaging was performed on a Zeiss 510
NLO microscope (Carl Zeiss MicroImaging, Thornwood,
NY). Slides were stored in the dark while not being ana-
lyzed.
In vitro magnetic resonance imaging for calculations of
Gd-dendrimer molar relaxivity
Gd-dendrimer stock solution (20 l of 100 mM) and
rhodamine B Gd-dendrimer stock solution (30 l of 67
mM) for the particular generation, used for in vivo imag-
ing, was diluted using PBS into 200 l microfuge tubes at
0.00 mM, 0.25 mM, 0.50 mM, 0.75 mM and 1.00 mM
with respect to Gd. As an external control, Magnevist
(Bayer, Toronto, Canada), a form of Gd-DTPA, was also
diluted at the above concentrations into 200 l microfuge
tubes. The microfuge tubes were secured in level and
upright positions within a plastic container filled with
deionized ultra pure water. The container was placed in a
7 cm small animal solenoid radiofrequency coil (Philips
Research Laboratories, Hamburg, Germany) centered
within a 3.0 Tesla MRI scanner (Philips Intera; Philips
Medical Systems, Andover, MA). Gd signal intensity meas-
urements were made using a series of T
1
weighted spin
echo sequences with identical T
E
(echo time, 10 ms) but
different T
R
(repetition time, 100 ms, 300 ms, 600 ms and
1200 ms). Using the measured Gd signal intensity, in
addition to the known values for T
R
and T
E
, the T
1
and
equilibrium magnetization (M
0
) were calculated by non-
linear regression [42]. In vitro and in vivo Gd-dendrimer
molar relaxivities were assumed to be equivalent for the
purposes of this work.
Brain tumor induction and animal preparation for imaging
All animal experiments were approved by the National
Institutes of Health Clinical Center Animal Care and Use
Committee. Cryofrozen pathogen-free RG-2 glioma cells
were obtained from the American Type Culture Collection
(Rockville, MD) and cultured in sterile DME supple-
mented with 10% FBS and 2% penicillin-streptomycin in
an incubator set at 37°C and 5% CO
2
. The anesthesia and
route for all animal experiments was isoflurane by inhala-
tion with nose cone, 5% for induction and 1 to 2% for
maintenance. On experimental day 0, the head of anes-
thetized adult male Fischer344 rats (F344) weighing 200–
250 grams (Harlan Laboratories, Indianapolis, IN) was
secured in a stereotactic frame with ear bars (David Kopf
Instruments, Tujunga, CA). The right anterior caudate and
left posterior thalamus locations within the brain were
stereotactically inoculated with RG-2 glioma cells [47]. In
each location, either 20,000 or 100,000 glioma cells in 5
l of sterile PBS were injected over 8 minutes, using a 10
l Hamilton syringe with a 32-gauge needle. With this
approach the majority of animal brains developed one
large and one small glioma. On experimental days 11 to
12, brain imaging of re-anesthetized rats was performed
following placement of polyethylene femoral venous and
arterial cannulas (PE-50; Becton-Dickinson, Franklin
Lakes, NJ), for contrast agent infusion and blood pressure
monitoring, respectively. After venous cannula insertion,
50 l of blood was withdrawn from the venous cannula
for measurement of hematocrit.
In vivo magnetic resonance imaging of brain tumors
All magnetic resonance imaging experiments were con-
ducted with a 3.0 Tesla MRI scanner (Philips Intera) using
a 7 cm solenoid radiofrequency coil (Philips Research
Laboratories). For imaging, the animal was positioned
supine, with face, head, and neck snugly inserted into a
nose cone centered within the 7 cm small animal solenoid
radiofrequency coil. Anchored to the exterior of the nose
cone were three 200 L microfuge tubes containing 0.00
mM, 0.25 mM and 0.50 mM solutions of Magnevist to
serve as standards for measurement of MRI signal drift
over time. Fast spin echo T
2
weighted anatomical scans
were performed with T
R
= 6000 ms and T
E
= 70 ms. Two
different flip angle (FA) 3-D fast field echo (3D FFE) T1
weighted scans were performed with T
R
= 8.1 ms and T
E
=
2.3 ms, for quantification of Gd concentration. The first
FFE scan was performed at a low FA of 3° without any
contrast agent on board. The second FFE scan was per-
formed with a high FA of 12°. For this scan, the dynamic
scan, each brain volume was acquired once every 20 sec-
onds, for 1 to 2 hours. During the beginning of the
dynamic scan, three to five baseline brain volumes were
acquired prior to Gd-dendrimer infusion. Gd-dendrimers
were infused at doses of 0.03, 0.06 or 0.09 mmol Gd/kg
bw depending on the experiment. Gd-dendrimer was
Journal of Translational Medicine 2008, 6:80 />Page 5 of 15
(page number not for citation purposes)
infused as a bolus over 1 minute in order to accurately
measure the contrast agent dynamics in blood during the
bolus. Following completion of the 1 or 2 hour dynamic
contrast-enhanced MRI scan, another 15 minute dynamic
contrast-enhanced MRI scan was performed during which
Magnevist was infused at a dose of 0.30 mmol Gd/kg bw
over 1 minute. Tumor regions of interest were drawn
based on the Magnevist dynamic scan data.
Dynamic contrast-enhanced MRI data analyses and
pharmacokinetic modeling
Imaging data was analyzed using the Analysis of Func-
tional NeuroImaging (AFNI; />)
software suite and its native file format [48]. Motion cor-
rection was performed by registering each volume of the
dynamic high FA scan to its respective low FA scan. Align-
ments were performed using Fourier interpolation. A
baseline T
1
without contrast (T
10
) map was generated by
solving equation 1 (the steady-state for incoherent signal
after neglecting T
2
* effects) voxel-by-voxel for T
1
, at both
low and high FA's, before contrast was infused [42].
where
After determining the T
10
value at each voxel, T
1
map was
calculated using equations 1 and 2 for each voxel of each
dynamic image during the high FA scan after contrast
infusion [42]. Datasets were converted to Gd concentra-
tion space [42]. Whole tumor regions of interest were
drawn on the basis of the dynamic contrast enhancement
pattern of tumor tissue observed following the infusion of
Magnevist. These data were important for the drawing of
accurate whole tumor regions of interest for minimally
enhancing gliomas, especially for all malignant gliomas
within the 0.03 mmol Gd/kg bw Gd-dendrimer dose cat-
egory and those in the 0.09 mmol Gd/kg bw Gd-G8 den-
drimer dose sub-category. Normal brain regions of
interest were spherical 9 mm
3
volumes in the left anterior
caudate.
The pharmacokinetic properties of Gd-G1 through lowly
conjugated Gd-G4 dendrimers were modeled using the
dynamic contrast-enhanced MRI data from the groups of
animals receiving 0.09 mmol Gd/kg bw Gd-dendrimer
infusions. The change in blood Gd-dendrimer concentra-
tion over time was obtained by selecting 2 to 3 voxels
within the superior sagittal sinus, a large caliber vein that
is minimally where influenced by in-flow and partial vol-
ume averaging effects. Since the transit time of blood
movement between an artery and a vein within the brain
is approximately 4 seconds, while the image acquisition
rate was once every 20 seconds, the superior sagittal sinus
was used for generation of the vascular input function for
pharmacokinetic modeling [41]. Animal brains from
which an optimal vascular input function could not be
obtained were excluded from being analyzed by pharma-
cokinetic modeling. The voxels chosen had peak blood
Gd concentrations closest to the calculated initial Gd-den-
drimer volume of distribution, based on the blood vol-
ume of a 250 gram rat being 14 ml [49]. Blood
concentration was converted to plasma concentration by
correcting for the hematocrit (Hct) as shown in equation
3 [40].
The 2-compartment 3-parameter generalized kinetic
model (equation 4) [40,50] was employed for pharma-
cokinetic modeling by performing voxel-by-voxel nonlin-
ear regression over all time points.
Constraints on the parameters were set between 0 and 1
calling on 10,000 iterations. Least squares minimizations
were performed by implementing the Nelder-Mead sim-
plex algorithm. Prior to statistical analysis, voxels with
poor fits or non-physiologic parameters were censored.
Ex vivo fluorescence microscopy and histological staining
of brain tumor sections
Six additional rats received 0.06 mmol Gd/kg bw of rhod-
amine B Gd-G5 and two additional rats received 0.06
mmol Gd/kg bw of rhodamine B Gd-G8. Subsequent to
the standard 2 hour dynamic contrast-enhanced MRI
study, the brains of these animals were harvested and
snap-frozen. On the day of cryosectioning, two 10 m sec-
tions of tumor bearing brain were cut onto each Daigger
Superfrost slide with a Leica Cryotome (Leica, Bensheim,
Germany). The first of two slides was prepared for fluores-
cence microscopy by application of DAPI-Vectashield
nuclear stain medium and coversliping. Confocal imaging
was performed on a Zeiss 510 NLO microscope. The sec-
ond slide was stained with Hematoxylin and Eosin for vis-
ualization of tumor histology.
Statistical analysis for pharmacokinetic modeling
Vascular parameter pharmacokinetic values for individual
tumor voxels were averaged in order to yield one value per
parameter per tumor per rat, with tumors within a rat
S
ME
E
=
−
−
0
1
1
1
1
()sin
cos
q
q
(1)
E
T
R
T
1
1
=−
⎛
⎝
⎜
⎞
⎠
⎟
exp
(2)
C
C
p
b
Hct
=
−1
(3)
Ct vC t K C
Kt
v
d
t
tpp
trans
p
trans
e
() () ( )exp
()
=+
−−
⎛
⎝
⎜
⎜
⎞
⎠
⎟
⎟
∫
t
t
t
0
(4)
Journal of Translational Medicine 2008, 6:80 />Page 6 of 15
(page number not for citation purposes)
being treated as correlated. On the basis of the range of
individual tumor volumes within Gd-G1, Gd-G2, Gd-G3
and lowly conjugated Gd-G4 dendrimer study groups, a
dichotomous variable for tumor size was generated by
using 50 mm
3
as the cut-off between large and small
tumors. Multivariate analysis of variance (MANOVA)
models were used to examine the effect of dendrimer gen-
eration and tumor size. Prior to the MANOVA, it deter-
mined that there was no interaction between dendrimer
generation and tumor size on any of the three parameters.
The covariance structure was considered to be compound
symmetric and the Kenward-Roger degrees of freedom
method was used. Post-hoc comparisons between lowly
conjugated Gd-G4 and each of the other generations were
conducted. The significant P-values we report are follow-
ing Bonferroni correction for multiple comparisons. Anal-
yses were implemented in SAS PROC Mixed (SAS Institute
Inc., Cary, North Carolina) with = 0.05.
Results
Physical properties of naked PAMAM and Gd-PAMAM
dendrimer generations
The physical properties of naked PAMAM dendrimers
(Starburst G1–G8, ethylenediamine core; Sigma-Aldrich,
St. Louis, MO) and Gd-PAMAM dendrimers are detailed
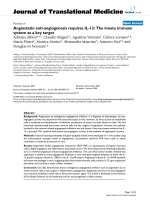
in table 1. Naked full generation PAMAM dendrimers are
cationic due to the presence of amine groups on the den-
drimer exterior for conjugation (Figure 1A). With each
successive dendrimer generation both the molecular
weight and number of terminal amines doubles. Conjuga-
tion of Gd-DTPA (charge -2, molecular weight ~0.7 kD) to
the surface amine groups of naked PAMAM dendrimers
neutralizes the positive charge on dendrimer exterior (Fig-
ure 1B). The molecular weight increase of the naked den-
drimer to that of the Gd-DTPA conjugated dendrimer is
proportional to the percent conjugation of Gd-DTPA
(Table 1). The percent conjugation of lowly conjugated
Gd-G4 dendrimers was 29.8% whereas that of standard
Gd-G4 dendrimers was 47.5% (Table 1). The constants of
proportionality required for calculation of Gd concentra-
tion, also known as Gd-dendrimer molar relaxivities,
ranged between 7.8 and 12.2 s/mM (Table 1).
Since the sizes of hydrated dendrimer generations, meas-
ured by small-angle X-ray scattering (SAXS) [51] and
small-angle neutron scattering (SANS) [52], are similar to
the sizes of respective dehydrated dendrimer generations
measured by TEM [37], we were able to use ADF STEM to
image Gd-G5 and higher generation Gd-dendrimers:
these Gd-dendrimer generations possessed masses heavy
enough to be visualized by ADF STEM [46,53]. ADF STEM
images of Gd-G5 through Gd-G8 dendrimers demon-
strated uniformity in particle size, shape and density
within any particular dendrimer generation (Figure 1C).
These images also confirmed a small increase of approxi-
mately 2 nm in particle diameter between successive gen-
erations. The diameters of sixty Gd-G7 and Gd-G8
dendrimers were measured. The average diameter of our
Gd-G7 dendrimers was 11.0 ± 0.7 nm and that of Gd-G8
dendrimers was 13.3 ± 1.4 nm (mean ± standard devia-
tion).
Effect of Gd-dendrimer dose on particle extravasation
across the blood-brain tumor barrier
The transvascular transport of Gd-G1 through Gd-G8 den-
drimers across pores of the BBTB and accumulation
within brain tumor tissue were studied at Gd-dendrimer
doses of 0.03 mmol Gd/kg bw and 0.09 mmol Gd/kg bw.
The 0.03 mmol Gd/kg bw dose is the standard intrave-
nous Gd-dendrimer dose for pre-clinical imaging with
Gd-dendrimers [33]. For each Gd-dendrimer generation,
the amount of Gd-dendrimer infused at the 0.03 mmol
Table 1: Table 1 - Physical properties of PAMAM and Gd-PAMAM dendrimer generations
Dendrimer generation
(G)
No. terminal amines Naked PAMAM
molecular weight
#
(kD)
Gd-PAMAM molecular
weight
†
(kD)
Gd-DTPA conjugation
(%)
Molar relaxivity
&
(s/mM)
G1 8 1.43 5.63 67.1 9.8
G2 16 3.26 11.2 65.9 10.1
G3 32 6.91 18.6 47.7 10.4
Lowly
conjugated
G4
64 14.2 24.4 29.8 7.8
Standard
G4
64 14.2 39.8 47.5 12.2
G5 128 28.8 79.8 47.2 10.9
G6 256 58.0 133 39.9 10.6
G7 512 116 330
‡
50.0 10.3
G8 1024 233 597
‡
37.8 9.4
#
obtained from Dendritech, Inc.
†
measured by MALDI-TOF MS unless noted otherwise
‡
measured by ADF STEM
&
molar relaxivity of Gd-DTPA measured to be 4.1
Journal of Translational Medicine 2008, 6:80 />Page 7 of 15
(page number not for citation purposes)
Gd/kg bw and 0.09 mmol Gd/kg bw doses is shown in the
supplementary table (Additional file 1).
At the 0.03 mmol Gd/kg bw dose, Gd-G1 through Gd-G5
dendrimers extravasated across the BBTB into the extravas-
cular tumor space (Additional file 2; Figure 2C, 2D, and
2E). At the 0.03 mmol Gd/kg bw dose, Gd-G6, Gd-G7 and
Gd-G8 dendrimers did not extravasate across the BBTB
(Figure 2F, 2G, and 2H). At the 0.09 mmol Gd/kg bw
dose, Gd-G1 through Gd-G6 dendrimers extravasated
across the BBTB into the extravascular tumor space (Addi-
tional file 2; Figure 2C through 2F). At the 0.09 mmol Gd/
kg bw dose, we found that Gd-G7 dendrimers did not
extravasate across the less defective BBTB of the smallest
gliomas within the size range of brain tumors in our study
(Figure 3B). In the case of the largest RG-2 gliomas within
the size range of brain tumors in our study, Gd-G7 den-
drimers extravasated across the more defective BBTB as
shown in Figure 3A. At both doses, irrespective of the
degree of BBTB defectiveness related to tumor size, we
found that Gd-G8 dendrimers are impermeable to the
BBTB and remain within brain tumor microvasculature
(Figure 2H and Figure 3).
Effect of Gd-dendrimer dose and blood half-life on particle
accumulation within brain tumor tissue
At both doses, we found that Gd-G1 through lowly conju-
gated Gd-G4 dendrimers possess short blood half-lives
compared to Gd-dendrimers of higher generations. The
blood concentration profile of lowly conjugated Gd-G4
dendrimers was similar to the profiles of Gd-G1, Gd-G2
and Gd-G3 dendrimers suggesting rapid clearance from
blood circulation. Standard Gd-G4 dendrimers had a
longer blood half-life than lowly conjugated Gd-G4 den-
drimers due to the increase in size associated with an
approximately 15 kD increase in molecular weight (Figure
2A and 2B, Table 1). At both doses, Gd-G5 through Gd-G8
dendrimers rapidly attained peak blood concentrations
and then maintained steady state levels for at least 2 hours
following the infusion (Figure 2A and 2B).
At both doses, Gd-G1 through lowly conjugated Gd-G4
dendrimers temporarily accumulated within the extravas-
cular tumor space before wash-out due to short blood
half-lives (Additional file 2 and Figure 2C). At both doses,
standard Gd-G4 dendrimers remained within the tumor
extravascular space longer than the lowly conjugated Gd-
G4 dendrimers (Figure 2D). At both doses, Gd-G5 den-
drimers demonstrated a steady rate of accumulation over
two hours, although, at the 0.09 mmol Gd/kg bw dose the
accumulation was faster over the first hour (Figure 2E). At
the 0.03 mmol Gd/kg bw dose Gd-G6 dendrimers did not
accumulate. At the 0.09 mmol Gd/kg bw dose, irrespec-
tive of tumor size, Gd-G5 and Gd-G6 dendrimers contin-
ued to accumulate slowly over 2 hours in all RG-2 gliomas
(Figure 2 and Figure 3). Gd-G1 through Gd-G8 dendrim-
ers remained within the microvasculature of normal brain
tissue and, as a result, normal brain tissue Gd concentra-
tion curves mirrored Gd concentration curves of the supe-
rior sagittal sinus (Additional file 3).
Effect of Gd-dendrimer size on transvascular flow rate and
particle distribution within brain tumor tissue
We investigated the relationship between lower Gd-den-
drimer generations and tumor volume to the particle
transvascular flow rate (permeability, K
trans
) and distribu-
tion in the extravascular extracellular tumor volume (frac-
tional extravascular extracellular volume, v
e
) using the 2-
Synthesis of Gd-dendrimers and transmission electron microscopy of higher generation Gd-dendrimersFigure 1
Synthesis of Gd-dendrimers and transmission electron microscopy of higher generation Gd-dendrimers. A) A
two-dimensional representation of naked polyamidoamine dendrimers up until generation 3 showing ethylenediamine core. B)
The naked dendrimer has a cationic exterior. Functionalizing the terminal amine groups with Gd-diethyltriaminepentaacetic
acid (charge -2) neutralizes the positive charge on the dendrimer exterior. C) Annular dark-field scanning transmission elec-
tron microscopy images of Gd-G5, Gd-G6, Gd-G7, and Gd-G8 dendrimers adsorbed onto an ultrathin carbon support film.
Scale bar = 20 nm.
Journal of Translational Medicine 2008, 6:80 />Page 8 of 15
(page number not for citation purposes)
compartment 3-parameter generalized kinetic model. The
third calculated vascular parameter was the tumor frac-
tional plasma volume (v
p
) [40,50]. We were able to suc-
cessfully model the blood and tissue pharmacokinetic
behavior of only Gd-G1 through lowly conjugated Gd-G4
dendrimers since these lower Gd-dendrimer generations
possess short blood half-lives and, therefore, remain pre-
dominantly within the extracellular tumor space. Higher
Gd-dendrimer generations do not remain in the extracel-
lular tumor space, but instead accumulate within glioma
cells, defying the fundamental assumption of dynamic
contrast-enhanced MRI-based modeling that an agent
remain extracellular [40].
Based on the range of tumor sizes within the Gd-G1
through lowly conjugated Gd-G4 dendrimer groups, RG-
2 gliomas were classified as large (> 50 mm
3
) and small (<
50 mm
3
). Irrespective of tumor size, we found significant
differences between the four dendrimer generations with
respect to particle transvascular flow rates (F
3,15.7
= 11.61;
Bonferroni corrected p = 0.0009, MANOVA) and distribu-
tion within the extravascular extracellular tumor volume
(F
3,16.1
= 8.26; Bonferroni corrected p = 0.0045,
MANOVA), but not the tumor fractional plasma volume
(F
3,16.3
= 1.24; P = NS, MANOVA) (Figure 4A, 4B, and 4C).
The transvascular flow rate of lowly conjugated Gd-G4
dendrimers was significantly lower compared to that of
Gd-G1 dendrimers. As a consequence, lowly conjugated
Gd-G4 dendrimers were focally distributed within the
extravascular extracellular tumor volume (Figure 4A, 4B,
and 4D). The vascular plasma volume was not signifi-
cantly different between tumor populations within the
four different dendrimer generations (Figure 4C). Irre-
spective of dendrimer generation, we found that large
tumors had higher values of transvascular flow rates
(F
1,34.6
= 10.83; Bonferroni corrected p = 0.0069,
MANOVA), fractional extravascular extracellular volume
(F
1,22.5
= 50.76; Bonferroni corrected p < 0.0003,
Gd concentration within blood and glioma tissue over time following intravenous Gd-dendrimer infusions at doses of 0.03 mmol Gd/kg bw and 0.09 mmol Gd/kg bwFigure 2
Gd concentration within blood and glioma tissue over time following intravenous Gd-dendrimer infusions at
doses of 0.03 mmol Gd/kg bw and 0.09 mmol Gd/kg bw. A) Blood concentrations of Gd-dendrimers measured in the
superior sagittal sinus following 0.03 mmol Gd/kg bw infusion. Gd-G1 (n=6), Gd-G2 (n=5), Gd-G3 (n=5), and lowly conjugated
Gd-G4 (n=5) dendirmers imaged for 1 hour. Standard Gd-G4 (n=6), Gd-G5 (n=6), Gd-G6 (n=5), Gd-G7 (n=6), and Gd-G8
(n=5) dendrimers imaged for 2 hours. Error bars represent standard deviations. B) Blood concentrations of Gd-dendrimers
measured in the superior sagittal sinus following 0.09 mmol Gd/kg bw infusion. Gd-G1 (n=4), Gd-G2 (n=6), Gd-G3 (n=6),
lowly conjugated Gd-G4 (n=4), standard Gd-G4 (n=6), Gd-G5 (n=6), Gd-G6 (n=5), Gd-G7 (n=5), and Gd-G8 (n=6). Blood
concentrations of Gd-G6, Gd-G7, and Gd-G8 dendrimers not shown for clarity. C) At both doses, lowly conjugated Gd-G4
dendrimers (molecular weight 24.4 kD) remain for a short period of time within the extravascular tumor space. 0.03 mmol Gd/
kg bw dose n=5, 0.09 mmol Gd/kg bw dose n=4. D) At both doses, standard Gd-G4 dendrimers (molecular weight 39.8 kD)
remain for longer within the extravascular tumor space. 0.03 mmol Gd/kg bw dose n=6, 0.09 mmol Gd/kg bw dose n=6. E) At
both doses, Gd-G5 dendrimers accumulate within the extravascular tumor space. 0.03 mmol Gd/kg bw dose n=6, 0.09 mmol
Gd/kg bw dose n=6. F) At the 0.03 mmol Gd/kg bw dose (n=5), Gd-G6 dendrimers do not extravasate out of tumor microvas-
culature. At the 0.09 mmol Gd/kg bw dose (n=5), Gd-G6 dendrimers extravasate. G) At the 0.03 mmol Gd/kg bw dose (n=6),
Gd-G7 dendrimers do not extravasate. At the 0.09 mmol Gd/kg bw dose (n=5), Gd-G7 dendrimers extravasate. H) Irrespec-
tive of dose, Gd-G8 dendrimers do not extravasate out of brain tumor microvasculature. 0.03 mmol Gd/kg bw dose n=5, 0.09
mmol Gd/kg bw dose n=6. In panels C through H, Gd tumor concentrations and standard deviations shown are weighted for
total tumor volume.
Journal of Translational Medicine 2008, 6:80 />Page 9 of 15
(page number not for citation purposes)
Gd concentration maps showing Gd-dendrimer distribution within the largest and smallest gliomas of each generation over timeFigure 3
Gd concentration maps showing Gd-dendrimer distribution within the largest and smallest gliomas of each
generation over time. A) Gd-G5, Gd-G6, and Gd-G7 dendrimers slowly accumulate within the extravascular tumor space
of the largest RG-2 gliomas within the size range of tumors in the study. Gd-G8 dendrimers remain intravascular. The volume,
in mm
3
, for each tumor shown is 104 (Gd-G1), 94 (Gd-G2), 94 (Gd-G3), 162 (lowly conjugated Gd-G4), 200 (standard Gd-
G4), 230 (Gd-G5), 201 (Gd-G6), 170 (Gd-G7), and 289 (Gd-G8). B) Gd-G5 and G6 dendrimers still slowly accumulate within
tumor tissue of the smallest RG-2 gliomas, which have a minimally compromised blood-brain tumor barrier. Gd-G7 dendrim-
ers are impermeable to the BBTB of the smallest RG-2 gliomas and remain intravascular. Gd-G8 dendrimers continue to be
impermeable to the blood-brain tumor barrier of the smallest RG-2 gliomas. The volume, in mm
3
, for each tumor shown is 27
(Gd-G1), 28 (Gd-G2), 19 (Gd-G3), 24 (lowly conjugated Gd-G4), 17 (standard Gd-G4), 18 (Gd-G5), 22 (Gd-G6), 24 (Gd-G6),
and 107 (Gd-G8). Each animal received an intravenous 0.09 mmol Gd/kg bw.
Modeled pharmacokinetic parameters of lower generation Gd-dendrimersFigure 4
Modeled pharmacokinetic parameters of lower generation Gd-dendrimers. A) The increase in Gd-dendrimer gen-
eration and size from that of Gd-G1 to that of lowly conjugated Gd-G4 results in a decrease in particle transvascular flow rate
(K
trans
). Large tumors have higher K
trans
values. B) Lowly conjugated Gd-G4 dendrimer distribution within the glioma extravas-
cular extracellular space (v
e
) is influenced to the greatest extent by the decrease in K
trans
. Large tumors have higher v
e
values.
C) Fractional plasma volume (v
p
) within glioma vasculature is maintained across dendrimer generations. Large tumors have
higher v
p
values. Large circles (Gd-G1 n= 4, Gd-G2 n=6, Gd-G3 n=7, and Gd-G4 n=2) represent large tumors (> 50 mm
3
),
small circles (Gd-G1 n=4, Gd-G2 n=6, Gd-G3 n=5, and Gd-G4 n=6) represent small tumors (< 50 mm
3
), horizontal bars rep-
resent mean of observations weighted with respect to individual tumor volumes. Shown are Bonferroni corrected p-values
from the nine post hoc comparisons for the three parameters, NS = not significant. D) There a more widespread distribution
of Gd-G1 particles within the extravascular extracellular tumor space as shown by the greater range of v
e
values; whereas,
there is a more focal distribution of lowly conjugated Gd-G4 dendrimers as shown by the lower range of v
e
values. Shown are
voxels surviving censorship. Tumor volumes, in mm3, for tumors shown are 104 (Gd-G1) and 162 (lowly conjugated Gd-G4).
Journal of Translational Medicine 2008, 6:80 />Page 10 of 15
(page number not for citation purposes)
MANOVA) and fractional plasma volume (F
1,27.9
= 20.49;
Bonferroni corrected p = 0.0003, MANOVA) than small
tumors.
Glioma cell uptake of fluorescent Gd-dendrimer
generations in vivo versus ex vivo
We performed fluorescence microscopy experiments in
vitro to confirm that the limitation to particle entry into
glioma cells is not at the cellular level. Rhodamine B
labeled Gd-G2, rhodamine B labeled Gd-G5, and rhod-
amine B labeled Gd-G8 dendrimers were synthesized as
representative examples of the Gd-G1 through Gd-G8
dendrimer series. The synthetic scheme of rhodamine B
Gd-dendrimers is shown in Figure 5A. The physical prop-
erties of rhodamine B Gd-G2, rhodamine B Gd-G5 and
rhodamine B Gd-G8 dendrimers are displayed in Addi-
tional file 4. The physical properties of the rhodamine B
dendrimers were similar to those of the Gd-G2, Gd-G5,
and Gd-G8 dendrimers. RG-2 glioma cells were imaged 4
hours after addition of rhodamine B Gd-G2, rhodamine B
Gd-G5 or rhodamine B Gd-G8 dendrimers into the cul-
ture media at equimolar concentrations with respect to
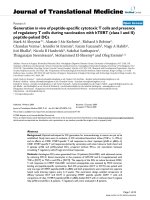
Fluorescence microscopy of glioma cell uptake of rhodamine B labeled Gd-dendrimer generations in vivo versus ex vivoFigure 5
Fluorescence microscopy of glioma cell uptake of rhodamine B labeled Gd-dendrimer generations in vivo ver-
sus ex vivo. A) Synthetic scheme for production of rhodamine B (RB) labeled Gd-polyamidoamine dendrimers. The naked
polyamidoamine dendrimer is first reacted with rhodamine B and then with Gd-DTPA. B) As shown by fluorescence micros-
copy in vitro, rhodamine B Gd-G2, rhodamine B Gd-G5, and rhodamine B Gd-G8 accumulate in glioma cells. Rhodamine B Gd-
G2 dendrimers enter RG-2 glioma cells, and in some cases, the nucleus (left). Rhodamine B Gd-G5 dendrimers enter the cyto-
plasm of RG-2 glioma cells, but do not localize within the nucleus (middle). Rhodamine B Gd-G8 dendrimers enter RG-2 gli-
oma cells in vitro (right). Shown are merged confocal images of blue fluorescence from DAPI-Vectashield nuclear (DNA) stain
and red fluorescence from rhodamine B labeled Gd-dendrimers. Scale bars = 20 μm. C) At 2 hours dynamic contrast-enhanced
MRI shows substantial extravasation of rhodamine B Gd-G5 dendrimers and some extravasation of rhodamine B Gd-G8 den-
drimers. Rhodamine B Gd-G5 n=6, rhodamine B Gd-G8 n=2. D) Low power fluorescence microscopy ex vivo of brain tumor
and normal brain surrounding tumor shows that there is substantial accumulation of rhodamine B Gd-G5 dendrimers within
tumor tissue (left, T = tumor, N = normal, scale bar = 100 μm). High power shows subcellular localization within malignant gli-
oma cells (upper right, scale bar = 20 μm). Hemotoxylin and Eosin stain of tumor and surrounding brain (lower right, scale bar
= 100 μm). Tumor volume is 31 mm
3
. E) Also shown by low power fluorescence microscopy ex vivo is some accumulation of
rhodamine B Gd-G8 dendrimers within brain tumor tissue (left, T = tumor, N = normal, scale bar = 100 μm). High power con-
firms minimal subcellular localization within glioma cells (upper right, scale bar = 20 μm). Hematoxylin and Eosin stain of tumor
and surrounding brain (lower right, scale bar = 100 μm). Tumor volume is 30 mm
3
.
Journal of Translational Medicine 2008, 6:80 />Page 11 of 15
(page number not for citation purposes)
rhodamine B. All three Gd-dendrimer generations accu-
mulated within RG-2 glioma cells (Figure 5B). In addi-
tion, rhodamine B Gd-G2 dendrimers in some cases were
observed to localize within cell nuclei (Figure 5B, left).
Rhodamine B Gd-G8 dendrimers localize within glioma
cells as readily as rhodamine B Gd-G5 dendrimers indicat-
ing that cellular uptake was not the barrier to the accumu-
lation of higher generation Gd-dendrimers within glioma
cells.
We conducted additional dynamic contrast-enhanced
MRI experiments with correlative fluorescence micros-
copy of glioma specimens ex vivo to confirm that permea-
ble functionalized dendrimers with long blood half-lives
accumulate in glioma cells. The infusion dose for rhod-
amine B Gd-G5 and rhodamine B Gd-G8 dendrimers was
0.06 mmol Gd/kg bw. Rhodamine B labeling of Gd-G5
dendrimers resulted in the enhanced extravasation of
rhodamine B Gd-G5 dendrimers across the BBTB and
rhodamine B labeling of Gd-G8 dendrimers resulted in
some extravasation of rhodamine B Gd-G8 dendrimers
across the BBTB, as shown by the dynamic contrast-
enhanced MRI concentration curves in Figure 5C. There
was substantial accumulation of rhodamine B Gd-G5
dendrimers within tumor tissue cells as shown by fluores-
cence microscopy ex vivo (low power, Figure 5D, left). The
subcellular localization of rhodamine B Gd-G5 dendrim-
ers in tumor tissue was similar to what was observed in
cultured RG-2 glioma cells (high power, Figure 5D, top
right). There was some accumulation of rhodamine B Gd-
G8 dendrimers within tumor tissue (Figure 5E, left). The
subcellular localization of rhodamine Gd-G5 dendrimers
in tumor tissue was minimal to what was observed in cul-
tured glioma cells (Figure 5E, top right). There was a small
amount of extravasation of rhodamine B Gd-G5 and
rhodamine B Gd-G8 dendrimer across the normal blood-
brain barrier beginning approximately 1 hour following
intravenous infusion, as shown by dynamic contrast-
enhanced MRI in Additional file 5.
Discussion
Effective transvascular delivery of therapeutics into malig-
nant glioma cells remains challenging. Although conven-
tional low-molecular weight chemotherapeutics can
easily cross the pores within the BBTB of malignant glio-
mas [21,54], these drugs do not achieve and maintain
effective steady state concentrations within malignant gli-
oma cells because of short blood half-lives.
Ultrastructural studies of brain tumor microvasculature
have shown that fenestrations and gaps exist within the
BBTB ranging from 40 to 90 nm and 100 to 250 nm,
respectively [20,55]. Using intravital microscopy, Hobbs
et al. [26] have reported that there is primarily perivascu-
lar fluorescence in xenografted human malignant gliomas
24 hours after the intravenous infusion of long-circulating
rhodamine labeled liposomes 100 nm in diameter. Using
MRI, Moore et al. [25] and Muldoon et al. [56] have
reported that there is minimal contrast enhancement of
rodent gliomas 24 hrs after the intravenous infusion of
various long-circulating dextran coated iron oxide (also
known as LCDIO) nanoparticles with a mean diameter of
20 nm [57,58]. These findings indicate that the therapeu-
tically relevant upper limit of the BBTB pore size should
range between 20 nm and 100 nm. However, the effective
transvascular delivery of nanoparticle-based drug carriers
across the BBTB into malignant glioma cells has remained
elusive, to date. We reasoned that the physiologic upper
limit of BBTB pores size would be less than 20 nm in
diameter. We were aware that PAMAM dendrimers are
particularly small multigenerational nanoparticles of uni-
form sizes within a generation [31,37]. Functionalized
PAMAM dendrimer particle sizes typically range between
1.5 nm (G1) and 14 nm (G8) in diameter following the
conjugation of low molecular weight imaging com-
pounds to the dendrimer exterior [33]. In order to probe
the physiologic upper limit of BBTB pore size in RG-2
malignant glioma microvasculature with dynamic con-
trast-enhanced MRI, we functionalized PAMAM dendrim-
ers G1 through G8 with Gd-DTPA (charge -2) [33,34,45].
As a result of the conjugation of Gd-DTPA to approxi-
mately half of the surface amine groups, the positive sur-
face charge on the PAMAM dendrimer exterior was
neutralized. In order to confirm that the barrier to cellular
entry of Gd-dendrimers is at the level of the BBTB, and
that permeable functionalized dendrimers with long
blood half-lives can accumulate in malignant glioma
cells, we used rhodamine B labeled Gd-dendrimers for
fluorescence imaging in vitro and ex vivo. Based on these
studies, we report here that the physiologic upper limit of
BBTB pore size ranges between approximately 11.7 and
11.9 nm. We also report that permeable functionalized
dendrimers with long blood half-lives can accumulate
within glioma cells.
We observed that there was virtually no contrast enhance-
ment of malignant glioma tissue over 2 hours on
dynamic-contrast enhanced MRI following the intrave-
nous infusion of Gd-G8 dendrimers. We found this to be
the case at both Gd-dendrimer doses investigated, one
being the standard 0.03 mmol Gd/kg bw dose for pre-clin-
ical dynamic contrast-enhanced MRI and the other being
0.09 mmol Gd/kg bw [33]. These dynamic contrast-
enhanced MRI findings demonstrate that Gd-G8 den-
drimers are larger than the upper limit of the physiologic
pore size of the BBTB of RG-2 gliomas. Using ADF STEM,
we measured the diameters of a population of our Gd-G8
dendrimers to be 13.3 ± 1.4 nm (mean ± standard devia-
tion) and that of Gd-G7 dendrimers to be 11.0 ± 0.7 nm.
Based on these ADF STEM data, the range of the physio-
Journal of Translational Medicine 2008, 6:80 />Page 12 of 15
(page number not for citation purposes)
logic upper limit of BBTB pore size in RG-2 malignant gli-
omas is between 11.7 and 11.9 nm.
To confirm that the limitation to functionalized G8 den-
drimer entry is not at the cellular level, we performed flu-
orescence microscopy of cultured RG-2 glioma cells
following the application of rhodamine B labeled Gd-
dendrimers to the media. We found that rhodamine B
labeled Gd-G2, -G5 and -G8 dendrimers accumulated in
the cytoplasm of all RG-2 glioma cells; however, we found
it particularly interesting that, in some cases, rhodamine B
labeled Gd-G2 dendrimers also accumulated in the RG-2
glioma cell nuclei. This finding suggests that it may also be
possible for other smaller nanoparticles (i.e. molecular
weight 11.2 kD) to cross nuclear pores.
Irrespective of dose, we found that Gd-G1, Gd-G2, Gd-G3
and lowly conjugated Gd-G4 (molecular weight 24.4 kD)
dendrimers had short blood half-lives because particle
sizes of these lower generation Gd-dendrimers are small
enough that particles can be efficiently filtered by the kid-
neys [17]. Therefore, Gd-G1 through lowly conjugated
Gd-G4 dendrimers only remain temporarily within the
tumor extravascular extracellular space. We also found
that as the Gd-dendrimer generation and particle size
increased, the transvascular flow (K
trans
) rate decreased;
and that the lower transvascular flow rate of lowly conju-
gated Gd-G4 dendrimers resulted in the more focal distri-
bution of particles within brain tumor tissue. Therefore,
since lower generation dendrimers have short blood half-
lives, the transvascular flow rate across the BBTB is the pri-
mary determinant of how widespread particle distribu-
tion was within the extravascular extracellular tumor
space. These findings suggest that nanoparticles with
higher molecular weights, yet particle sizes small enough
to still be effectively filtered by the kidneys, do not remain
within the extravascular tumor space sufficiently long to
effectively permeate through tumor tissue. Therefore, such
nanoparticles would remain within close proximity of
tumor microvessels, and would not reach malignant gli-
oma cells located within tumor regions that are poorly
vascularized.
We found that standard Gd-G4 dendrimers (molecular
weight 39.8 kD) had a longer blood half-life than the
lower generation Gd-dendrimers because the particle size
of standard Gd-G4 dendrimers is at the threshold of effec-
tive renal filtration [17]. Irrespective of dose, Gd-G5
through Gd-G8 dendrimers maintained steady state
blood concentrations over a minimum of 2 hours because
particle sizes of these generations of Gd-dendrimers are
clearly above the threshold of effective renal filtration
[17]. As a result of the long blood half-lives, Gd-G5 and
Gd-G6 were able to slowly extravasate across the BBTB of
even the smallest gliomas that we studied. Based on these
findings, we conclude that it may be possible to effectively
deliver permeable nanoparticles with long blood half-
lives across a minimally compromised BBTB, including
across the BBTB of the microvasculature supplying emerg-
ing malignant glioma colonies.
To verify that only permeable functionalized dendrimers
with long blood half-lives accumulate within malignant
glioma cells, we infused rhodamine B labeled Gd-G5 den-
drimers and rhodamine B labeled Gd-G8 dendrimers to
separate groups of rats. The dose of rhodamine B Gd-den-
drimers was 0.06 mmol Gd/kg bw, since in pilot experi-
ments we observed that the anesthetic effect of isoflurane
was potentiated at the 0.09 mmol Gd/kg bw rhodamine B
Gd-dendrimer dose [59,60]. Fluorescence microscopy of
RG-2 glioma specimens demonstrated extensive subcellu-
lar localization of rhodamine B Gd-G5 dendrimers, con-
firming that functionalized G5 dendrimers accumulate
within malignant glioma cells, due to long blood half-
lives.
We observed with both fluorescence microscopy and
dynamic contrast-enhanced MRI that there was some
accumulation of rhodamine B Gd-G8 dendrimers in RG-2
gliomas (Figure 5C and 5E), as well as some non-selective
accumulation of rhodamine B Gd-G5 and rhodamine B
Gd-G8 dendrimers in tumor-free brain regions (Addi-
tional file 5). We suspect that rhodamine B labeled Gd-G5
and Gd-G8 dendrimers are toxic to the BBTB in addition
to the otherwise healthy blood-brain barrier. This toxicity
is likely due to the introduction of additional positive
charge to the Gd-dendrimer surface from the attachment
of rhodamine B, a cationic and lipophilic fluorescent dye
[61-64]. Therefore, the extravasation of rhodamine
labeled nanoparticles [26,65] and other charged nanopar-
ticles [66-69] across the barrier may be from direct charge
induced damage to endothelial cells of the barrier and dis-
ruption of the barrier. Our proposed mechanism for the
increased barrier permeation of rhodamine labeled Gd-
dendrimers is analogous to the mechanism recently pro-
posed by Herce and Garcia [70,71] for the movement of
cell-penetrating peptides across cell membranes. We plan
to clarify, in the future, with additional in vivo imaging
experiments, the relationship between charge on the den-
drimer surface and disruption of the blood-brain barrier.
Conclusion
In this study, we identified the precise physiologic upper
limit of blood-brain tumor barrier pore size, and demon-
strated that nanoparticles of diameters smaller than this
upper limit can effectively traverse the pores of the blood-
brain tumor barrier; in addition, we validated the impor-
tance of prolonged nanoparticle blood half-life for the
effective accumulation of nanoparticles within brain
tumor cells. Therefore, based on these findings, we con-
Journal of Translational Medicine 2008, 6:80 />Page 13 of 15
(page number not for citation purposes)
clude that effective drug delivery across the BBTB of malig-
nant gliomas, and potentially the BBB of other
neuropathologies, can be accomplished with non-toxic
nanoparticles that are smaller than 11.7 to 11.9 nm in
diameter and have prolonged blood half-lives.
In the broadest sense, our findings will serve as general
guidelines, for the future design and development of mul-
tifunctional transvascular delivery devices, based on nan-
oparticles (i.e. liposome-, quantum dot-, or iron oxide-
based) and biological particles (i.e. antibody- or viral-
based), that are particularly effective at crossing the dis-
eased BBB and accumulating in neuropathologic tissues.
Competing interests
The authors declare that they have no competing interests.
Authors' contributions
HS conceptualized, designed, and supervised the overall
study; performed the dynamic contrast-enhanced MRI
experiments, analyzed the data, interpreted the overall
study results, and prepared the manuscript. ASK per-
formed the dynamic contrast-enhanced MRI experiments,
analyzed the data, and assisted with the preparation of the
manuscript. HW synthesized and performed the prelimi-
nary characterization of the functionalized dendrimers.
KRB assisted with the confocal fluorescence microscopy
experiments. SHF performed the initial dynamic contrast-
enhanced MRI experiments. KS assisted with the prepara-
tion of the manuscript. AAS characterized the higher gen-
eration functionalized dendrimers by electron
microscopy. SA performed the statistical data analysis.
CMW assisted with the synthesis of the functionalized
dendrimers. MAA assisted with the characterization of the
higher generation functionalized dendrimers by electron
microscopy. RDL supervised the electron microscopy-
based characterization of the functionalized dendrimers.
GLG supervised the synthesis and preliminary characteri-
zation of the functionalized dendrimers, and contributed
to the design of the overall study. MDH conceptualized,
designed, and supervised the confocal fluorescence micro-
scopy experiments; assisted with the interpretation of the
overall study results, and prepared the manuscript.
Additional material
Acknowledgements
This study was funded by the National Institute of Biomedical Imaging Bio-
engineering (NIBIB), National Cancer Institute (NCI), and the Radiology
and Imaging Sciences Program (CC). We thank Guofeng Zhang of the Lab-
oratory of Bioengineering and Physical Science (NIBIB) and Yide Mi of the
Radiology and Imaging Sciences Program (CC) for technical assistance. We
thank Daniel Glen and Rick Reynolds of the Scientific and Statistical Com-
puting Core (National Institute of Mental Health [NIMH]) for their assist-
ance during our use of the Analysis of Functional NeuroImages (AFNI)
software suite for data analyses.
Additional file 1
Amount of Gd-PAMAM dendrimer infused per Gd dose.
Click here for file
[ />5876-6-80-S1.pdf]
Additional file 2
Gd-dendrimer residence time within the extravascular extracellular
brain tumor space increases with increasing dendrimer generation at
0.09 mmol Gd/kg body weight dose. At the 0.03 mmol Gd/kg bw dose,
changes in the concentration profiles of Gd-G1 (left), Gd-G2 (middle)
and Gd-G3 (right) are not evident. 0.09 mmol Gd/kg body weight dose,
Gd-G1 (n = 5), Gd-G2 (n = 6), Gd-G3 (n = 6). 0.03 mmol Gd/kg bw
dose, Gd-G1 (n = 6), Gd-G2 (n = 5), Gd-G3 (n = 5). Error bars represent
standard deviation weighted for total tumor volume and are shown once
every five minutes for clarity. Average tumor concentration curves are
weighted with respect to total tumor volume within the respective den-
drimer generation.
Click here for file
[ />5876-6-80-S2.jpeg]
Additional file 3
Gd-dendrimers do not enter the normal brain extravascular space due
to the normal blood-brain barrier. Shown are dynamic contrast-
enhanced MRI concentration curves at the 0.09 mmol Gd/kg body weight
dose. Gd-G1 (n = 5) and Gd-G5 (n = 6) as representative examples of
low and high dendrimer generation behavior. Error bars represent stand-
ard deviation and are shown once every five minutes for clarity. Average
concentration curves are from normal brain tissue volumes of 9 mm
3
per
brain.
Click here for file
[ />5876-6-80-S3.jpeg]
Additional file 4
Physical properties of rhodamine B Gd-PAMAM dendrimers.
Click here for file
[ />5876-6-80-S4.pdf]
Additional file 5
Rhodamine labeled Gd-G5 and rhodamine labeled Gd-G8 dendrimers
enter the normal brain extravascular space across the normal blood-
brain barrier. Shown are dynamic contrast-enhanced MRI concentration
curves of rhodamine Gd-dendrimers at a 0.06 mmol Gd/kg body weight
dose and Gd-dendrimers at a 0.09 mmol Gd/kg body weight dose. A)
Rhodamine Gd-G5 (n = 6), Gd-G5 (n = 6). B) Rhodamine Gd-G8 (n =
2), Gd-G8 (n = 6). Error bars represent standard deviation and are shown
once every five minutes for clarity. Average concentration curves are from
normal brain tissue volumes of 9 mm
3
per brain.
Click here for file
[ />5876-6-80-S5.jpeg]
Journal of Translational Medicine 2008, 6:80 />Page 14 of 15
(page number not for citation purposes)
References
1. Weber WA, Czernin J, Phelps ME, Herschman HR: Technology
Insight: novel imaging of molecular targets is an emerging
area crucial to the development of targeted drugs. Nat Clin
Pract Oncol 2008, 5:44-54.
2. Wolinsky JB, Grinstaff MW: Therapeutic and diagnostic applica-
tions of dendrimers for cancer treatment. Adv Drug Deliv Rev
2008, 60:1037-1055.
3. Neuwelt E, Abbott NJ, Abrey L, Banks WA, Blakley B, Davis T, Engel-
hardt B, Grammas P, Nedergaard M, Nutt J, et al.: Strategies to
advance translational research into brain barriers. Lancet
Neurol 2008, 7:84-96.
4. Walker MD, Green SB, Byar DP: Randomized comparisons of
radiotherapy and nitrosoureas for the treatment of malig-
nant glioma after surgery. New England Journal of Medicine 1980,
303:1323-1329.
5. Stupp R, Mason WP, Bent MJ van den, Weller M, Fisher B, Taphoorn
MJ, Belanger K, Brandes AA, Marosi C, Bogdahn U, et al.: Radiother-
apy plus concomitant and adjuvant temozolomide for gliob-
lastoma. N Engl J Med 2005, 352:987-996.
6. Lin SH, Kleinberg LR: Carmustine wafers: localized delivery of
chemotherapeutic agents in CNS malignancies. Expert Rev
Anticancer Ther 2008, 8:343-359.
7. Cohen MH, Johnson JR, Pazdur R: Food and Drug Administration
Drug approval summary: temozolomide plus radiation ther-
apy for the treatment of newly diagnosed glioblastoma mul-
tiforme. Clin Cancer Res 2005, 11:6767-6771.
8. Brem H, Mahaley MS Jr, Vick NA, Black KL, Schold SC Jr, Burger PC,
Friedman AH, Ciric IS, Eller TW, Cozzens JW, et al.: Interstitial
chemotherapy with drug polymer implants for the treat-
ment of recurrent gliomas. J Neurosurg 1991, 74:441-446.
9. Westphal M, Hilt DC, Bortey E, Delavault P, Olivares R, Warnke PC,
Whittle IR, Jaaskelainen J, Ram Z: A phase 3 trial of local chemo-
therapy with biodegradable carmustine (BCNU) wafers
(Gliadel wafers) in patients with primary malignant glioma.
Neuro Oncol 2003, 5:
79-88.
10. Gallia GL, Brem S, Brem H: Local treatment of malignant brain
tumors using implantable chemotherapeutic polymers. J
Natl Compr Canc Netw 2005, 3(5):721-728.
11. Fung LK, Ewend MG, Sills A, Sipos EP, Thompson R, Watts M, Colvin
OM, Brem H, Saltzman WM: Pharmacokinetics of interstitial
delivery of carmustine, 4-hydroperoxycyclophosphamide,
and paclitaxel from a biodegradable polymer implant in the
monkey brain. Cancer Research 1998, 58:672-684.
12. Brem H, Piantadosi S, Burger PC, Walker M, Selker R, Vick NA, Black
K, Sisti M, Brem S, Mohr G, et al.: Placebo-controlled trial of
safety and efficacy of intraoperative controlled delivery by
biodegradable polymers of chemotherapy for recurrent gli-
omas. The Polymer-brain Tumor Treatment Group. Lancet
1995, 345:1008-1012.
13. Newlands ES, Stevens MF, Wedge SR, Wheelhouse RT, Brock C:
Temozolomide: a review of its discovery, chemical proper-
ties, pre-clinical development and clinical trials. Cancer Treat
Rev 1997, 23:35-61.
14. Allen TM, Cullis PR: Drug delivery systems: entering the main-
stream. Science 2004, 303:1818-1822.
15. Langer R: Drug delivery and targeting. Nature 1998, 392:5-10.
16. Asgeirsson D, Venturoli D, Fries E, Rippe B, Rippe C: Glomerular
sieving of three neutral polysaccharides, polyethylene oxide
and bikunin in rat. Effects of molecular size and conforma-
tion. Acta Physiologica 2007, 191:237-246.
17. Soo Choi H, Liu W, Misra P, Tanaka E, Zimmer JP, Itty Ipe B, Bawendi
MG, Frangioni JV: Renal clearance of quantum dots. Nat Biotech-
nol 2007, 25:1165-1170.
18. Knauf MJ, Bell DP, Hirtzer P, Luo ZP, Young JD, Katre NV: Relation-
ship of effective molecular size to systemic clearance in rats
of recombinant interleukin-2 chemically modified with
water-soluble polymers. Journal of Biological Chemistry 1988,
263:15064-15070.
19. Matsumura Y, Maeda H: A new concept for macromolecular
therapeutics in cancer chemotherapy: mechanism of tumor-
itropic accumulation of proteins and the antitumor agent
smancs.
Cancer Res 1986, 46:6387-6392.
20. Vick NA, Bigner DD: Microvascular abnormalities in virally-
induced canine brain tumors. Structural bases for altered
blood-brain barrier function. J Neurol Sci 1972, 17:29-39.
21. Vick NA, Khandekar JD, Bigner DD: Chemotherapy of brain
tumors. The "blood-brain barrier" is not a factor. Arch Neurol
1977, 34:523-526.
22. Brem H: Polymers to treat brain tumours. Biomaterials 1990,
11:699-701.
23. Siegal T, Horowitz A, Gabizon A: Doxorubicin encapsulated in
sterically stabilized liposomes for the treatment of a brain
tumor model: biodistribution and therapeutic efficacy.
Genomics & Informatics 2006, 4(4147-160 [ />html/UploadFile/article2_200612.pdf].
24. Brigger I, Morizet J, Laudani L, Aubert G, Appel M, Velasco V, Terrier-
Lacombe MJ, Desmaele D, d'Angelo J, Couvreur P, Vassal G: Nega-
tive preclinical results with stealth nanospheres-encapsu-
lated Doxorubicin in an orthotopic murine brain tumor
model. J Control Release 2004, 100:29-40.
25. Moore A, Marecos E, Bogdanov A Jr, Weissleder R: Tumoral distri-
bution of long-circulating dextran-coated iron oxide nano-
particles in a rodent model. Radiology 2000, 214:568-574.
26. Hobbs SK, Monsky WL, Yuan F, Roberts WG, Griffith L, Torchilin VP,
Jain RK: Regulation of transport pathways in tumor vessels:
role of tumor type and microenvironment. Proc Natl Acad Sci
USA 1998, 95:4607-4612.
27. Chertok B, Moffat BA, David AE, Yu F, Bergemann C, Ross BD, Yang
VC: Iron oxide nanoparticles as a drug delivery vehicle for
MRI monitored magnetic targeting of brain tumors. Biomate-
rials 2008, 29:487-496.
28. Fabel K, Dietrich J, Hau P, Wismeth C, Winner B, Przywara S, Stein-
brecher A, Ullrich W, Bogdahn U: Long-term stabilization in
patients with malignant glioma after treatment with lipo-
somal doxorubicin. Cancer 2001, 92:1936-1942.
29. Wu G, Barth RF, Yang W, Kawabata S, Zhang L, Green-Church K:
Targeted delivery of methotrexate to epidermal growth fac-
tor receptor-positive brain tumors by means of cetuximab
(IMC-C225) dendrimer bioconjugates. Mol Cancer Ther 2006,
5:52-59.
30. Rainov NG, Dobberstein KU, Heidecke V, Dorant U, Chase M,
Kramm CM, Chiocca EA, Breakefield XO: Long-term survival in a
rodent brain tumor model by bradykinin-enhanced intra-
arterial delivery of a therapeutic herpes simplex virus vec-
tor. Cancer Gene Therapy 1998, 5:158-162.
31. Tomalia DA, Frechet JM: Discovery of dendrimers and dendritic
polymers: a brief historical perspective. Journal of Polymer Sci-
ence, Part A: Polymer Chemistry 2002, 40:2719-2728.
32. Tomalia DA, Reyna LA, Svenson S: Dendrimers as multi-purpose
nanodevices for oncology drug delivery and diagnostic imag-
ing. Biochem Soc Trans 2007, 35:
61-67.
33. Kobayashi H, Brechbiel MW: Nano-sized MRI contrast agents
with dendrimer cores. Adv Drug Deliv Rev 2005, 57:2271-2286.
34. Wiener EC, Brechbiel MW, Brothers H, Magin RL, Gansow OA,
Tomalia DA, Lauterbur PC: Dendrimer-based metal chelates: a
new class of magnetic resonance imaging contrast agents.
Magn Reson Med 1994, 31:1-8.
35. Kukowska-Latallo JF, Candido KA, Cao Z, Nigavekar SS, Majoros IJ,
Thomas TP, Balogh LP, Khan MK, Baker JR Jr: Nanoparticle target-
ing of anticancer drug improves therapeutic response in ani-
mal model of human epithelial cancer. Cancer Res 2005,
65:5317-5324.
36. Myc A, Douce TB, Ahuja N, Kotlyar A, Kukowska-Latallo J, Thomas
TP, Baker JR Jr: Preclinical antitumor efficacy evaluation of
dendrimer-based methotrexate conjugates. Anticancer Drugs
2008, 19:143-149.
37. Jackson CL, Chanzy HD, Booy FP, Drake BJ, Tomalia DA, Bauer BJ,
Amis EJ: Visualization of dendrimer molecules by transmis-
sion electron microscopy (TEM): Staining methods and cryo-
TEM of vitrified solutions. Macromolecules 1998, 31:6259-6265.
38. Aas AT, Brun A, Blennow C, Stromblad S, Salford LG: The RG2 rat
glioma model. J Neurooncol 1995, 23:175-183.
39. Barth RF: Rat brain tumor models in experimental neuro-
oncology: The 9L, C6, T9, F98, RG2 (D74), RT-2 and CNS-1
gliomas. Journal of Neuro-Oncology 1998, 36:91-102.
40. Tofts PS, Kermode AG: Measurement of the blood-brain bar-
rier permeability and leakage space using dynamic MR imag-
ing. 1. Fundamental concepts. Magn Reson Med 1991,
17:357-367.
41. Ferrier MC, Sarin H, Fung SH, Schatlo B, Pluta RM, Gupta SN, Choyke
PL, Oldfield EH, Thomasson D, Butman JA: Validation of dynamic
Publish with Bio Med Central and every
scientist can read your work free of charge
"BioMed Central will be the most significant development for
disseminating the results of biomedical researc h in our lifetime."
Sir Paul Nurse, Cancer Research UK
Your research papers will be:
available free of charge to the entire biomedical community
peer reviewed and published immediately upon acceptance
cited in PubMed and archived on PubMed Central
yours — you keep the copyright
Submit your manuscript here:
/>BioMedcentral
Journal of Translational Medicine 2008, 6:80 />Page 15 of 15
(page number not for citation purposes)
contrast-enhanced magnetic resonance imaging-derived
vascular permeability measurements using quantitative
autoradiography in the RG2 rat brain tumor model. Neoplasia
2007, 9:546-555.
42. Haacke EM, Brown RW, Thompson MR, Venkatesan M: Magnetic Res-
onance Imaging: Physical Principles and Sequence Design New York:
Wiley; 1999.
43. Moore JL, Taylor SM, Soloshonok VA: An efficient and operation-
ally convenient general synthesis of tertiary amines by direct
alkylation of secondary amines with alkyl halides in the pres-
ence of Huenig's base. Arkivoc 2005, 2005:287-292.
44. Brechbiel MW, Gansow OA, Atcher RW, Schlom J, Esteban J, Simp-
son DE, Colcher D: Synthesis of 1-(p-isothiocyanatobenzyl)
derivatives of DTPA and EDTA. Antibody labeling and
tumor-imaging studies. Inorganic Chemistry 1986, 25:2772-2781.
45. Xu H, Regino CA, Bernardo M, Koyama Y, Kobayashi H, Choyke PL,
Brechbiel MW: Toward improved syntheses of dendrimer-
based magnetic resonance imaging contrast agents: new
bifunctional diethylenetriaminepentaacetic acid ligands and
nonaqueous conjugation chemistry. J Med Chem 2007,
50:3185-3193.
46. Sousa AA, Leapman RD: Quantitative STEM mass measure-
ment of biological macromolecules in a 300 kV TEM. J Microsc
2007, 228:25-33.
47. Paxinos G, Watson C: The Rat Brain in Stereotaxic Coordinates 4th edi-
tion. New York: Elsevier; 2004.
48. Cox RW: AFNI: software for analysis and visualization of
functional magnetic resonance neuroimages. Comput Biomed
Res 1996, 29:162-173.
49. Lee HB, Blaufox MD: Blood volume in the rat. J Nucl Med 1985,
26:72-76.
50. Tofts PS, Brix G, Buckley DL, Evelhoch JL, Henderson E, Knopp MV,
Larsson HB, Lee TY, Mayr NA, Parker GJ, et al.: Estimating kinetic
parameters from dynamic contrast-enhanced T(1)-weighted
MRI of a diffusable tracer: standardized quantities and sym-
bols. J Magn Reson Imaging 1999, 10:223-232.
51. Prosa TJ, Bauer BJ, Amis EJ, Tomalia DA, Scherrenberg R: A SAXS
study of the internal structure of dendritic polymer systems.
Journal of Polymer Science Part B: Polymer Physics 1997, 35:2913-2924.
52. Nisato G, Ivkov R, Amis EJ: Size invariance of polyelectrolyte
dendrimers.
Macromolecules 2000, 33:4172-4176.
53. Sousa A, Aronova MA, Wu H, Sarin H, Griffiths GL, Leapman RD:
Quantitative STEM and EFTEM characterization of den-
drimer-based nanoparticles used in magnetic resonance
imaging and drug delivery. Microsc Microanal 2008, 14 Suppl
2:694-695.
54. Gerstner ER, Fine RL: Increased permeability of the blood-
brain barrier to chemotherapy in metastatic brain tumors:
establishing a treatment paradigm. J Clin Oncol 2007,
25:2306-2312.
55. Schlageter KE, Molnar P, Lapin GD, Groothuis DR: Microvessel
organization and structure in experimental brain tumors:
Microvessel populations with distinctive structural and func-
tional properties. Microvascular Research 1999, 58:312-328.
56. Muldoon LL, Sandor M, Pinkston KE, Neuwelt EA: Imaging, distri-
bution, and toxicity of superparamagnetic iron oxide mag-
netic resonance nanoparticles in the rat brain and
intracerebral tumor. Neurosurgery 2005, 57:.
57. Shen T, Weissleder R, Papisov M, Bogdanov A Jr, Brady TJ: Monoc-
rystalline iron oxide nanocompounds (MION): Physico-
chemical properties. Magnetic Resonance in Medicine 1993,
29:599-604.
58. Jung CW, Jacobs P: Physical and chemical properties of super-
paramagnetic iron oxide MR contrast agents: ferumoxides,
ferumoxtran, ferumoxsil. Magn Reson Imaging 1995, 13:661-674.
59. Summerhayes IC, Lampidis TJ, Bernal SD: Unusual retention of
rhodamine 123 by mitochondria in muscle and carcinoma
cells. Proceedings of the National Academy of Sciences of the United
States of America 1982, 79:5292-5296.
60. Gear ARL: Rhodamine 6G. A potent inhibitor of mitochon-
drial oxidative phosphorylation. Journal of Biological Chemistry
1974, 249:3628-3637.
61. Malik N, Wiwattanapatapee R, Klopsch R, Lorenz K, Frey H, Weener
JW, Meijer EW, Paulus W, Duncan R: Dendrimers: relationship
between structure and biocompatibility in vitro, and prelim-
inary studies on the biodistribution of 125I-labelled polyami-
doamine dendrimers in vivo. J Control Release 2000, 65:
133-148.
62. Lutty GA: The acute intravenous toxicity of biological stains,
dyes, and other fluorescent substances. Toxicology and Applied
Pharmacology 1978, 44:225-249.
63. Ravnic DJ, Zhang YZ, Turhan A, Tsuda A, Pratt JP, Huss HT, Mentzer
SJ: Biological and optical properties of fluorescent nanoparti-
cles developed for intravascular imaging. Microscopy Research
and Technique 2007, 70:776-781.
64. Bingaman S, Huxley VH, Rumbaut RE: Fluorescent dyes modify
properties of proteins used in microvascular research. Micro-
circulation 2003, 10:221-231.
65. Kim JS, Yoon TJ, Yu KN, Kim BG, Park SJ, Kim HW, Lee KH, Park SB,
Lee JK, Cho MH: Toxicity and tissue distribution of magnetic
nanoparticles in mice. Toxicological Sciences 2006, 89:338-347.
66. Lockman PR, Koziara JM, Mumper RJ, Allen DD: Nanoparticle Sur-
face Charges Alter Blood-Brain Barrier Integrity and Per-
meability. Journal of Drug Targeting 2004, 12:635-641.
67. Kang YS, Pardridge WM: Brain delivery of biotin bound to a con-
jugate of neutral avidin and cationized human albumin. Phar-
maceutical Research 1994, 11:1257-1264.
68. Costantino L, Gandolfi F, Tosi G, Rivasi F, Vandelli MA, Forni F: Pep-
tide-derivatized biodegradable nanoparticles able to cross
the blood-brain barrier. Journal of Controlled Release 2005,
108:84-96.
69. Poduslo JF, Curran GL: Polyamine modification increases the
permeability of proteins at the blood-nerve and blood-brain
barriers. Journal of Neurochemistry 1996, 66:1599-1609.
70. Herce HD, Garcia AE: Molecular dynamics simulations suggest
a mechanism for translocation of the HIV-1 TAT peptide
across lipid membranes. Proceedings of the National Academy of Sci-
ences of the United States of America 2007, 104:20805-20810.
71. Herce HD, Garcia AE: Cell Penetrating Peptides: How Do They
Do It? Journal of Biological Physics 2008:1-12.