báo cáo hóa học:" Enhanced serum concentrations of transforming growth factor-beta1 in simple fatty liver: is it really benign?" pot
Bạn đang xem bản rút gọn của tài liệu. Xem và tải ngay bản đầy đủ của tài liệu tại đây (231.09 KB, 8 trang )
BioMed Central
Page 1 of 8
(page number not for citation purposes)
Journal of Translational Medicine
Open Access
Research
Enhanced serum concentrations of transforming growth
factor-beta1 in simple fatty liver: is it really benign?
Giovanni Tarantino*
1
, Paolo Conca
1
, Antonio Riccio
1
, Marianna Tarantino
2
,
Matteo N Di Minno
1
, Domenico Chianese
3
, Fabrizio Pasanisi
1
,
Franco Contaldo
1
, Francesco Scopacasa
3
and Domenico Capone
4
Address:
1
Federico II University Medical School of Naples, Department of Clinical and Experimental Medicine, Naples, Italy,
2
Federico II
University Medical School of Naples, Department of Biomorphological and Functional Sciences, Naples, Italy,
3
Federico II University Medical
School of Naples, Department of Biochemistry and Medical Biotechnology, Naples, Italy and
4
Federico II University Medical School of Naples,
Department of Neurosciences, Section of Clinical Pharmacology, Naples, Italy
Email: Giovanni Tarantino* - ; Paolo Conca - ; Antonio Riccio - ;
Marianna Tarantino - ; Matteo N Di Minno - ; Domenico Chianese - ;
Fabrizio Pasanisi - ; Franco Contaldo - ; Francesco Scopacasa - ;
Domenico Capone -
* Corresponding author
Abstract
Background: Inside the spectrum of non-alcoholic fatty liver disease, simple fatty liver is generally thought of as being
"non progressive", differently from non-alcoholic steatohepatitis, which increases in severity due to the presence of
apoptosis/inflammation and fibrosis. The "benignity" of fatty liver is widely accepted but conceptually difficult to maintain
because the mechanisms underlying this entity are the same ones that determine the more severe form.
Findings provide evidence that iron overload is associated with increased liver damage and collagen deposition.
Transforming growth factor-beta1 released by hepatic stellate cells during chronic liver injury plays a critical role in liver
apoptosis and fibrogenesis.
Objective: To verify whether both the forms of non-alcoholic fatty liver disease were really dissimilar, evaluating the
serum profile of two key parameters, indexes of severity.
Methods: A total of 123 patients (57 females) participated, forming three groups: forty five patients with fatty liver, 42
patients with non-alcoholic steatohepatitis and 36 with chronic hepatitis C. All had a biopsy-proven diagnosis.
Measurements: Serum concentrations of transforming growth factor-beta1 and ferritin.
Results: High concentrations of transforming growth factor-beta1 were noticed in patients suffering from both fatty liver
and non-alcoholic steatohepatitis, 129.1 (45.4) versus 116.8 (42.2) ng/mL, P = 0.2; they were significantly superior to
those of chronic hepatitis C patients 87.5 (39.5) ng/mL, P < 0.001. Ferritin levels were on average above normal values
and similar in the three groups (P = 0.9), also when adjusted for gender (P = 0.5) and age (P = 0.3).
Conclusion: No difference between serum concentrations of transforming growth factor-beta1 and ferritin in fatty liver
and non-alcoholic steatohepatitis suggests that these forms share more common aspects, regarding their progression,
than previously thought.
Published: 27 November 2008
Journal of Translational Medicine 2008, 6:72 doi:10.1186/1479-5876-6-72
Received: 23 September 2008
Accepted: 27 November 2008
This article is available from: />© 2008 Tarantino et al; licensee BioMed Central Ltd.
This is an Open Access article distributed under the terms of the Creative Commons Attribution License ( />),
which permits unrestricted use, distribution, and reproduction in any medium, provided the original work is properly cited.
Journal of Translational Medicine 2008, 6:72 />Page 2 of 8
(page number not for citation purposes)
Background
Non-alcoholic fatty liver disease (NAFLD) represents a
complex of liver diseases that range from simple fatty liver
(FL), at the most clinically benign end of the spectrum,
through an intermediate, generally progressive lesion,
non-alcoholic steatohepatitis (NASH) to cirrhosis, at the
opposite end. Diagnosis of NAFLD can usually be done by
imaging studies in absence of other liver disease. Liver
biopsy is required to size disease severity (inflammation,
degenerative lesion and fibrosis), even though some limi-
tations cast doubts on its use in clinical settings [1].
The definition of "benignity" concerning FL is wide-
accepted [2] but conceptually difficult to maintain
because the mechanisms, i.e., insulin resistance (IR),
underlying this entity are the same ones that determine
the more severe form.
The key process in the progression of NAFLD from the
very beginning to the end is fibrosis. An animal model of
"fibrosing steatohepatitis" that replicates the histologic
features of human NASH stresses the sequence of steato-
sis, inflammatory cell injury and fibrogenesis, mediated
by hepatic stellate cells (HSCs) via up-regulation of trans-
forming growth factor-beta1 (TGF-β1) [3]. An alternative
pattern is followed by leptin that facilitates proliferation
and prevents apoptosis of HSCs [4].
There is an increasing body of evidence that iron overload
is associated with metabolic syndrome (MS) and NAFLD
[5]. Observation of liver fibrosis in a rat model of NASH
suggests that iron induces increase in hepatocytes apopto-
sis and contributes to the development of fibrosis directly
or indirectly via induction of TGF-β1 production in hepa-
tocytes and macrophages at an earlier time than expected
[6]. It is important to stress that hepatocyte apoptosis is
significantly increased in patients with NASH and corre-
lates with disease severity [7].
TGF-β1 is a profibrotic cytokine whose action is mediated
by Smad proteins and p38 MAPK. They have been found
to independently and additively regulate α1(I) collagen
gene expression by transcriptional activation, while p38
MAPK, but not Smad signaling, increases α1(I) collagen
mRNA stability leading to increased synthesis and deposi-
tion of type I collagen [8].
As previously reported, histology, which has not probably
an optimal sensitivity and specificity, leads to biased accu-
racy estimates and gives a frozen-in-time picture. An
approach to look into the supposed "benignity" of FL and
"progressivity" of NASH is to speculate about eventual dif-
ferences/similarities in mechanisms between the two enti-
ties. With this in mind, we tracked in a NAFLD cohort the
behaviour of serum TGF-β1, an indirect severity progres-
sion index, and ferritin, an ancillary marker for IR, corre-
lating their concentrations to those present in chronic
hepatitis C (CHC), disease characterized by the combina-
tion of apoptosis/inflammation and fibrosis, in which
TGF-β1 and iron overload could play a key role too [9,10].
Methods
Population
One hundred and forty six adult Caucasian patients from
the beginning of 2005 to the end of 2007 were consecu-
tively investigated at our Department (Figure 1) in a cross-
sectional fashion.
Every patient gave his or her informed consent to this
study, which had been approved by the local Ethics Com-
mittee.
NAFLD patients
We enrolled 108 patients who fulfilled the following
inclusion criteria: presence of overweight/obesity and vis-
ceral adiposity, associated with recent US features of
"bright liver", with or without aminotransferases increase
of unknown origin.
Subjects were classified as being overweight or as having
first degree obesity on the basis of body mass index (BMI)
cut-off points of ≥ 25.0 and ≤ 29.9, or > 29.9 and ≥ 34.9
kg/m
2
, respectively. Central obesity was identified by
waist circumference (WC) > 102 cm in men or > 88 cm in
women, measured at the midpoint between the lower
border of the rib cage and the iliac crest. Metabolic syn-
drome (MS) was defined according to the revised Adults
Treatment Panel III (2001), and three or more criteria
were considered: plasma glucose concentration of at least
100 mg dL
-1
, WC > 102 cm in men and > 88 cm in women,
serum high-density lipoprotein (HDL)-cholesterol con-
centration < 40 mg dL
-1
in men and < 50 mg dL
-1
in
women, blood pressure of at least 130/85 mm Hg, and
serum triglyceride concentration of at least 150 mg dL
-1
.
IR was calculated by modified homeostasis model assess-
ment-index (HOMA), with the following formula: fasting
insulin (μU/mL) * plasma glucose (mg/dL)/405 [11].
Exclusion criteria were a recent history of acute inflamma-
tion (very high, ≥ 4 times the upper limit of normality,
values of C reactive protein, CRP); presence of hepatitis B
and C, neoplastic and/or haematological diseases,
autoimmune and storage diseases; prior (at least 3
months) use of drugs inducing hepatic steatosis or affect-
ing inflammation or angiotensin-converting enzyme
inhibitors/angiotensin II type 1 receptor blockers. Alcohol
abuse was ruled out according to the DSM-IV diagnostic
criteria, by means of screening tests such as MAST (Michi-
gan Alcohol Screening Test) and CAGE (Cut down,
Journal of Translational Medicine 2008, 6:72 />Page 3 of 8
(page number not for citation purposes)
Annoyed, Guilty, and Eye opener) [12], as well as random
tests for blood alcohol concentration and the use of a sur-
rogate marker, e.g., mean corpuscular volume. Patients on
antihypertensive therapy maintained a balanced medical
regimen throughout the study.
Eighty-seven out of 108 patients initially selected agreed
to perform liver biopsy. On the basis of the results of
hepatic histology, 42 patients (19 females) were assigned
to the NASH group and 45 (21 females) to the FL one.
Steatohepatitis was graded on the basis of the degree of
macrovesicular steatosis, mixed lobular inflammation
and hepatocyte ballooning, using a composite NAFLD
activity score (NASH, > 5) [13]. The presence of perisinu-
soidal fibrosis was noted and scored as none, rare, mild or
moderate. Early fibrosis was distinguished from advanced
fibrosis based on the presence of bridging fibrosis (score
of 3 or more).
Chronic hepatitis C patients
Thirty-eight individuals were diagnosed as to have ele-
vated values of serum alanine aminotransferase (ALT) for
at least six months. These subjects possessed detectable
serum HCV-RNA (COBAS AmpliScreen HCV Test, v2.0,
with automated amplification and detection using
polymerase chain reaction method on the COBAS AMPLI-
COR Analyzer, Roche; the lower detection limit was 200
IU/mL), before starting antiviral treatment. Thirty-six
patients (17 females) underwent liver biopsy. Histological
features were evaluated using the Ishak scoring system for
inflammation and fibrosis [14]. In brief, inflammation
was scored using four parameters (periportal or periseptal
interface hepatitis, confluent necrosis, focal lytic necrosis
and portal inflammation) to obtain a histological activity
index (HAI, maximum score 18), and fibrosis was scored
as 0 – 6. The selected patients' tissue specimens were con-
sidered adequate for evaluation when at least four portal
(or septal) areas were available for review and if they had
length superior to 1.5 cm.
Ultra Sonography
Determinations were made by two expert operators,
blinded to each other, using an ultrasound (US) diagnos-
tic system (ESAOTE, Genoa, Italy) with a 3.5-MHz convex
probe. The classification of "bright liver" was based on the
following scale of hyperechogenity: 0 = absent, 1 = light,
2 = moderate, 3 = severe.
Analytes
CRP was dosed by an enzyme immunoassay kit of Bio-
Check, Inc, Foster City, CA, USA.
TGF-β1 was dosed by using Quantikine immunoassay kit
from R&D Systems, Inc. Minneapolis, MN, USA. Serum
separator tubes were used to allow samples to clot for 30
minutes at room temperature. For complete release of
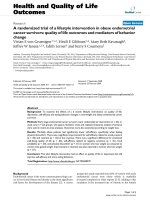
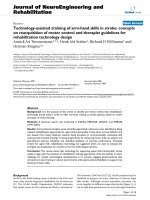
The flow of participants through the studyFigure 1
The flow of participants through the study. NAFLD, non-alcoholic fatty liver disease; FL, fatty liver; NASH, non-alcoholic
steatohepatitis; CHC, chronic hepatitis C.
146 subjects fully investigated
108 pat ient s w it h NAFLD 38 patients with CHC
LI VER BI OPSY
87 out of 108 agreed t o undergo it 36 out of 38 agreed t o undergo it
forming t w o groups forming t he control group
45 patients with FL 42 patients w it h NASH 36 patients with CHC
Journal of Translational Medicine 2008, 6:72 />Page 4 of 8
(page number not for citation purposes)
TGF-β1, samples were incubated overnight at 2 – 8°C
before centrifugation for 15 minutes at 1000 × g.
Removed serum was stored at -70°C.
The intra-assay and inter-assay precision coefficient varia-
tion was 3.4% and 8.4%, respectively. TGF-β1 levels in 15
controls showed a median of 26.9 ng/mL, and 5
th
– 95
th
percentile 23.0 – 34.0. The mean minimum detectable
was 4.87 pg/mL.
For the determination of ferritin in serum was used the
Ferritin ELISA Quantitation kit by GenWay Biotech, Inc.
San Diego, CA 92121. The minimum detectable ferritin
concentration by the assay was 5.0 ng/mL. Normal values
were in males 20–370 ng/mL and in females 10–150 ng/
mL. The inter-assay coefficients of variation were 4.2%,
5.1% and 6.6% at the concentrations of 37, 221 and 340
ng/mL, respectively, whereas the intra-assay coefficients of
variation were 3.5%, 5.7% and 3.6% at the same concen-
trations, respectively.
Data collection of sonographic parameters was done
before the histological classification, whereas serum ferri-
tin and growth factor concentrations were obtained on
stored samples.
The liver biopsy, blood samples and US parameters were
strictly carried out within two months in order to lessen
potentially confounding lifestyle changes or intercurrent
illnesses.
Statistics
Variables normally distributed (Kolmogorov-Smirnov
test) such as age (P = 0. 13), ferritin (P = 0.12), ALT (P =
0.1), CRP (P = 0.07) and TGF-β1 (P = 0.054) were
expressed as mean (SD). BMI, not normally distributed (P
= 0.003), and ordinals, i.e., US and histology scores, were
expressed as median and range.
The t test or ANOVA and the Mann-Withey test or Kruskal-
Wallis were adopted to compare means or median, respec-
tively. The pairwise analysis of subgroups, post-hoc com-
parisons after ANOVA, was obtained by the Tukey test.
Furthermore, the ANCOVA was used to control for factors.
The chi square was performed to look for differences in
the classification system. Tracking the degree of associa-
tion between single parameters in each group, Pearson's r
or Spearman's rho was chosen according to the variable
distribution (normal or not normal as well as being ordi-
nals, respectively). Statistical analysis was performed
operating on Systat 12 and MedCalc Version 9.4. software
packages.
Results
The biopsy-proven selected population (Table 1) was well
balanced for gender (Chi-square = .03, P = 1), and obvi-
ously not for BMI (Kruskal-Wallis, P = < 0.001). MS was
indifferently represented across the NAFLD groups (20
out of 45 in FL and 25 out of 42 in NASH, Chi-square =
1.3, P = 0.2).
In NAFLD patients we found high TGF-β1 concentrations.
No statistically significant difference was found between
FL and NASH subgroups (P = 0.2).
Table 1: Main laboratory data and characteristics of the studied population
Diagnosis
CHC n 36 FL n 45 NASH n 42
Gender Mean SD Gender Mean SD Gender Mean SD
Age 44.5 10.0 42.3 9.1 40.4 10.5
TGF-β1 ng/mL* 87.5 39.5 129.1 45.4 116.8 42.2
CRP 0.80.4 0.90.4
ALT U/L
#
72.7 25.6 49.2 17.8 54.3 21.8
Ferritin ng/mL 17 F 203.6 86.5 21 F 232.3 117.4 19 F 279.8 150.3
Ferritin ng/mL 19 M 396.4 153.5 24 M 381.5 137.2 23 M 357.2 132.3
Waist Circumference (cm) 21 F 98 6.1 19 F 100 4.7
Waist Circumference (cm) 24 M 105 6.3 23 M 108 7.7
HOMA 3.21.4 3.41.5
Median Range Median Range Median Range
BMI‡ 26 22–30 29 27–32 29 27–32
Fibrosis score 1 1–3 1 1–2
US steatosis Score 2 1–3 1 1–3
CHC, chronic hepatitis C; FL, fatty liver; NASH, non-alcoholic steatohepatitis; ALT, alanine aminotransferase; CRP, C reactive protein; TGF-β1,
transforming growth factor beta1; BMI, body mass index; HOMA, homeostasis model assessment-insulin resistance index.
* P < 0.001, FL versus CHC and 0.008, NASH versus CHC patients;
#
P < 0.001, CHC versus FL and NASH patients; ‡ P < 0.001, CHC versus FL
and NASH patients.
Journal of Translational Medicine 2008, 6:72 />Page 5 of 8
(page number not for citation purposes)
TGF-β1 levels were more increased in FL and in NASH
patients than CHC patients; this difference disappeared
when data were adjusted for age.
Ferritin levels were found elevated and not different in the
three groups (P = 0.9), also when adjusted for gender (P =
0.5) and age (P = 0.3).
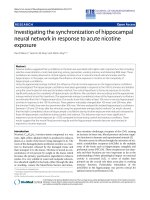
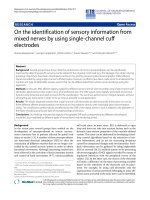
Serum TGF-β1 was significantly correlated to serum ferri-
tin considering the full population (r = 0.23, P = 0.009,
Figure 2), especially in female patients (r = 0.5, P < 0.001),
in NASH female patients (r = 0.45, P = 0.048) and in FL
patients of both gender (r = 0.35, P = 0.02), whereas in all
the CHC patients there was only a certain trend (r = 0.32,
P = 0.05). No association was found between CRP and
TGF-β1 (P = 0.8). ALT activity showed a negative associa-
tion with TGF-β1 levels (r = -0.34, P = 0.026) in NASH
patients and none in CHC patients (P = 0.9). Further
details are shown in Table 2 and 3.
An inverse relationship was present between fibrosis score
and serum TGF-β1 (rho = -0.27, P < 0.001).
High HOMA values were associated with high serum TGF-
β1 levels (r = 0.48, P < 0.001).
US steatosis score well correlated to WC in women (rho =
0.58, P < 0.001) as well as in men (rho = 0.61, P < 0.001).
Discussion
The key findings we provide are briefly i) subjects with FL
and NASH exhibit quite the same elevated values of serum
TGF-β1, both greater than those present in CHC patients;
ii) there is a fair correlation between levels of this cytokine
and ferritin in FL patients.
Our data somehow disagree with the body of present
knowledge. In fact, they provide evidence for the idea that,
being fibrosis the key process that distinguishes the non-
progressive from the progressive form of NAFLD and hav-
ing found a marker of fibrosis well represented in FL
patients, FL should not be considered a benign disease yet.
Further, we failed to confirm the crucial role of CRP in dif-
ferentiating FL from NASH even though NASH patients
revealed the highest concentrations [15].
Discussing possible mechanisms and explanations for our
findings, we emphasize that TGF-β1-induced fibrosis in
organ pathology and dysfunction appears to be increas-
ingly relevant to a variety of distinct diseases [16].
Enhanced serum TGF-β1 concentrations could represent a
marker of early activation of mesenchymal HSCs. This
interpretation is strengthened by the findings of a negative
correlation of serum TGF-β1 with fibrosis score, feature of
stable collagen deposition, and by a good correlation
between the same cytokine and serum ferritin. In fact,
liver iron deposits in CHC are common and associated
with activation of HSCs, ultimately contributing to liver
damage [10,17].
Increasing evidence suggests hepatocyte apoptosis, due to
increased oxidative stress, is a key mediator of liver injury
in NAFLD [18]. But, is apoptosis restricted to hepatocytes
alone? It is likely that, in an initial phase, apoptosis also
acts on activated HSCs decreasing the collagen fibres [19].
This could happen in FL. Successively, this mechanism
does not prevent the waterfall effect of hepatic fibrosis,
characteristic feature of NASH. Alternatively, being the
deposition and degradation of hepatic fibrous tissue a
dynamic equilibrium course, increased expression pat-
terns of matrix-metalloproteinases -1, -2, -3, and tissue
inhibitors of metalloproteinases -1 and -2 genes could
promotes the degradation of extra-cellular matrix in an
early step, such as in FL. Anyway, the mechanisms remain
to be further studied.
Although our results are referred to a larger population,
we are not able to confirm that high levels of plasma TGF-
β1 represent a possible method of diagnosing NASH in
NAFLD patients [20].
We found that the criterion of liver enzymes increase,
widely used to separate NASH from FL, is vanishing
according to a recent study in which 25 out of 64 (39%)
patients with biopsy-proven FL was found to have ALT
levels superior to 30 U/L [21]. In addition, having found
no or negative correlation between ALT activity and TGF-
β1 levels in NASH and CHC patients, respectively, sug-
gests that TGF-β1 is related to apoptosis rather than to
inflammation.
Still, discussing other limitations, we should ask some
questions.
Firstly, does a randomized determination mirror the "at
steady state" serum concentration of this cytokine?
TGF-β1 differs from the majority of growth regulatory fac-
tors since it is generally synthesized and secreted in a bio-
logically latent form, and this must be activated before
TGF-β1 can exert its biological effects on target cells. TGF-
β1 in this latent complex had a long plasma half-life
(more than 100 min). Having found elevated values of
serum TGF-β1 in FL, it is likely that a hepatic over-expres-
sion of the same cytokine is present. The only one serum
determination for each patient is a "snapshot in time"
methodology, but this is understandable; this alone with
small numbers of patients in the 3 subgroups limits any
definitive conclusion that can be drawn from this study.
Journal of Translational Medicine 2008, 6:72 />Page 6 of 8
(page number not for citation purposes)
Table 2: Correlations between ferritin and other parameters
CHC FL NASH
TGF-β1 Ferritin (17 females, F) Ferritin (21 F) Ferritin (19 F)
r = 0.35 r = 0.5 r = 0.46
P = 0.16 P < 0.001 P = 0.048
TGF-β1 Ferritin (19 males, M) Ferritin (24 M) Ferritin (23 M)
r = 0.06 r = 0.08 r = -0.26
P = 0.78 P = 0.8 P = 0.23
CRP ND Ferritin (F) Ferritin (F)
r = 0.13 r = 0.36
P = 0.57 P = 0.13
CRP ND Ferritin (M) Ferritin (M)
r = -0.49 r = -0.08
P = 0.01 P = 0.7
ALT Ferritin (females) Ferritin (F) Ferritin (F)
r = 0.36 r = 0.04 r = -0.17
P = 0.18 P = 0.85 P = 0.48
ALT Ferritin (M) Ferritin (M) Ferritin (M)
r = 0.42 r = -0.01 r = 0.42
P = 0.07 P = 0.95 P = 0.045
BMI Ferritin (F) Ferritin (F) Ferritin (F)
rho = -0.13 rho = -0.05 rho = 0.14
P = 0.59 P = 0.8 P = 0.5
BMI Ferritin (M) Ferritin (M) Ferritin (M)
rho = -0.24 rho = 0.3 rho = -0.22
P = 0.3 P = 0.14 P = 0.3
US score ND Ferritin (F) Ferritin (F)
rho = -0.19 rho = -0.24
P = 0.4 P = 0.31
US score ND Ferritin (M) Ferritin (M)
rho = -0.04 rho = -0.24
P = 0.85 P = 0.3
Fibrosis score Ferritin (F) ND Ferritin (F)
rho = 0.14 rho = -0.51
P = 0.37 P = 0.03
Fibrosis score Ferritin (M) ND Ferritin (M)
rho = 0.18 rho = 0.20
P = 0.44 P = 0.34
Age Ferritin (F) Ferritin (F) Ferritin (F)
r = -077 r = -0.34 r = -0.01
P = 0.0003 P = 0.13 P = 0.68
Age Ferritin (M) Ferritin (M) Ferritin (M)
r = 0.40 r = 0.29 r = -0.26
P = 0.08 P = 0.16 P = 0.23
CHC, chronic hepatitis C; FL, fatty liver; NASH, non-alcoholic steatohepatitis; ALT, alanine aminotransferase; CRP, C reactive protein; TGF-β1,
transforming growth factor beta1; BMI, body mass index; US score, hepatic steatosis score at ultrasound; r, Pearson's correlation coefficient and
rho, Spearman's rank correlation coefficient, chosen according to the variable distribution (normal or not normal as well as being ordinals,
respectively); ND, not determined; F, females; M, males.
Journal of Translational Medicine 2008, 6:72 />Page 7 of 8
(page number not for citation purposes)
Secondly, why are not evident histological features of
fibrosis in FL patients undergone liver biopsy?
Our findings do not represent an isolate case. In fact, HSC
activation was not correlated to HAI and fibrosis score,
valued by Knodell and Batts separate systems, in a subset
of patients who developed severe hepatitis C recurrence
on 4-month after liver transplantation [22]. The interpre-
tation could be that we similarly faced an early fibrogene-
sis that would have been apparent across a long period of
time, making the TGF-β1, indirect marker of HSC activa-
tion, better useful in predicting the subsequent hepatic
fibrosis.
We could have carried out other markers of fibrosis for the
noninvasively staging of NAFLD patients [23]. However,
to date, none of these markers have been independently
validated in different populations in a prospective way.
Moreover, all of these studies have been tested in a cross-
sectional fashion, and then the role of these biomarkers
for monitoring disease progression remains completely
unknown. To let us get down to the grassroots of the FL benignity
from the beginning we should relay on longitudinal
observations lasting several years, but this approach is dif-
ficult to plan. Crucial future research directions could be
assessing liver fibrosis in FL patients during a long period
of time by using non invasive tools such as fibrosis mark-
ers or elastograghy.
Conclusion
Similar levels of TFβ1 and ferritin in fatty liver and non-
alcoholic steatohepatitis suggest that these forms share
some common aspects, regarding their progression. If FL
can evolve in liver cirrhosis, factors underlying this illness
should be more intensively corrected, representing
NAFLD also an epiphenomenon of MS, which has
become a major health problem.
Abbreviations
(NAFLD): Non-alcoholic fatty liver disease; (FL): fatty
liver; (NASH): non-alcoholic steatohepatitis; (IR): insulin
resistance; (CHC): chronic hepatitis C; (TGF-β1): trans-
forming growth factor-beta1; (HSCs): hepatic stellate
cells; (MS): metabolic syndrome; (BMI): body mass index;
(CRP): C reactive protein; (WC): waist circumference;
(HOMA): homeostasis model assessment-index; (MAST):
Michigan alcohol screening test; (CAGE): cut down,
annoyed, guilty, eye opener; (ALT): alanine aminotrans-
ferase.
Competing interests
The authors declare that they have no competing interests.
Authors' contributions
FS and DCa carried out the laboratory analyses. MT per-
formed the ultrasound studies. DCh, MND, PC, FP, AR
Association between serum TGF-β1 and ferritinFigure 2
Association between serum TGF-β1 and ferritin.
TGF-β1, transforming growth factor-beta1.
100 200 300 400 500 600 700
200
180
160
140
120
100
80
60
40
20
Ferritin ng/mL
TGF-ß1 ng/mL
Table 3: Correlations between TGF-β1 and other parameters
CHC N = 36 FL N = 45 NASH N = 42
CRP ND TGF-β1TGF-β1
r = 0.37 r = 0.29
P = 0.08 P = 0.055
ALT TGF-β1TGF-β1TGF-β1
r = -0.02 r = -0.13 r = -0.34
P = 0.9 P = 0.38 P = 0.026
BMI TGF-β1TGF-β1TGF-β1
rho = 0.13 rho = 0.18 rho = 0.09
P = 0.46 P = 0.22 P = 0.56
US score ND TGF-β1TGF-β1
rho = -0.08 rho = 0.05
P = 0.57 P = 0.72
Fibrosis score TGF-β1ND TGF-β1
rho = -0.09 rho = 0.05
P = 0.60 P = 0.75
Age TGF-β1TGF-β1TGF-β1
r = -0.02 r = 0.02 r = -0.009
P = 0.9 P = 0.9 P = 0.9
CHC, chronic hepatitis C; FL, fatty liver; NASH, non-alcoholic
steatohepatitis; ALT, alanine aminotransferase; CRP, C reactive
protein; TGF-β1, transforming growth factor beta1; BMI, body mass
index; US score, hepatic steatosis score at ultrasound; r, Pearson's
correlation coefficient and rho, Spearman's rank correlation
coefficient, chosen according to the variable distribution (normal or
not normal as well as being ordinals, respectively); ND, not
determined.
Publish with Bio Med Central and every
scientist can read your work free of charge
"BioMed Central will be the most significant development for
disseminating the results of biomedical research in our lifetime."
Sir Paul Nurse, Cancer Research UK
Your research papers will be:
available free of charge to the entire biomedical community
peer reviewed and published immediately upon acceptance
cited in PubMed and archived on PubMed Central
yours — you keep the copyright
Submit your manuscript here:
/>BioMedcentral
Journal of Translational Medicine 2008, 6:72 />Page 8 of 8
(page number not for citation purposes)
and FC participated in the design of the study and in draft-
ing the manuscript. GT conceived of the research, was the
main investigator and the coordinator of the study, made
the statistics and drafted the manuscript. All authors read
and approved the final manuscript.
References
1. de Oliveira CP, de Mello ES, Alves VA, Saviero SM, Strauss E:
Changes in histological criteria lead to different prevalences
of nonalcoholic steatohepatitis in severe obesity. Ann Hepatol
2007, 6:255-61.
2. Adams LA, Lymp JF, St Sauver J, Sanderson SO, Lindor KD, Feldstein
A, Angulo P: The natural history of nonalcoholic fatty liver dis-
ease: a population-based cohort study. Gastroenterology 2005,
129:113-21.
3. George J, Pera N, Phung N, Leclercq I, Yun Hou J, Farrell G: Lipid
peroxidation, stellate cell activation and hepatic fibrogenesis
in a rat model of chronic steatohepatitis. J Hepatol 2003,
39:756-64.
4. Qamar A, Sheikh SZ, Masud A, Jhandier MN, Inayat IB, Hakim W,
Mehal WZ: In vitro and in vivo protection of stellate cells from
apoptosis by leptin. Dig Dis Sci 2006, 51:1697-705.
5. Zelber-Sagi S, Nitzan-Kaluski D, Halpern Z, Oren R: NAFLD and
hyperinsulinemia are major determinants of serum ferritin
levels. J Hepatol 2007, 46:700-7.
6. Imeryuz N, Tahan V, Sonsuz A, Eren F, Uraz S, Yuksel M, Akpulat S,
Ozcelik D, Haklar G, Celikel C, Avsar E, Tozun N: Iron preloading
aggravates nutritional steatohepatitis in rats by increasing
apoptotic cell death. J Hepatol 2007, 47:851-9.
7. Feldstein AE, Canbay A, Angulo P, Taniai M, Burgart LJ, Lindor KD,
Gores GJ: Hepatocyte apoptosis and fas expression are prom-
inent features of human nonalcoholic steatohepatitis. Gastro-
enterology 2003, 125:437-443.
8. Tsukada S, Westwick JK, Ikejima K, Sato N, Rippe RA: Smad and
p38 MAPK signaling pathways independently regulate α1(I)
collagen gene expression in unstimulated and TGF-β stimu-
lated hepatic stellate cells. J Biol Chem 2005, 280:10055-64.
9. Kanzler S, Baumann M, Schirmacher P, Dries V, Bayer E, Gerken G,
Dienes HP, Lohse AW: Prediction of progressive liver fibrosis in
hepatitis C infection by serum and tissue levels of transform-
ing growth factor-beta.
J Viral Hepat 2001, 8:430-7.
10. Sumida Y, Kanemasa K, Fukumoto K, Yoshida N, Sakai K: Hepatic
iron accumulation may be associated with insulin resistance
in patients with chronic hepatitis C. Hepatol Res 2007,
37:932-40.
11. Matthews DR, Hosker JP, Rudenski AS, Naylor BA, Treacher DF,
Turner RC: Homeostasis model assessment: insulin resistance
and beta-cell function from fasting plasma glucose and insu-
lin concentrations in man. Diabetologia 1985, 28:412-9.
12. Forsberg L, Halldin J, Ekman S, Rönnberg S: Screening of binge
drinking among patients on an emergency surgical ward.
Alcohol 2002, 27:77-82.
13. Kleiner DE, Brunt EM, Van Natta M, Behling C, Contos MJ, Cummings
OW, Ferrell LD, Liu YC, Torbenson MS, Unalp-Arida A, Yeh M,
McCullough AJ, Sanyal AJ, Nonalcoholic Steatohepatitis Clinical
Research Network: Nonalcoholic Steatohepatitis Clinical
Research Network Design and validation of a histological
scoring system for nonalcoholic fatty liver disease. Hepatology
2005, 41:1313-21.
14. Ishak K, Baptista A, Bianchi L, Callea F, De Groote J, Gudat F, Denk
H, Desmet V, Korb G, MacSween RN, et al.: Histological grading
and staging of chronic hepatitis. J Hepatol 1995, 22:696-9.
15. Yoneda M, Mawatari H, Fujita K, Iida H, Yonemitsu K, Kato S, Taka-
hashi H, Kirikoshi H, Inamori M, Nozaki Y, Abe Y, Kubota K, Saito S,
Iwasaki T, Terauchi Y, Togo S, Maeyama S, Nakajima A: High-sensi-
tivity C-reactive protein is an independent clinical feature of
nonalcoholic steatohepatitis (NASH) and also of the severity
of fibrosis in NASH. J Gastroenterol 2007, 42:573-82.
16. Khan R, Sheppard R: Fibrosis in heart disease: understanding
the role of transforming growth factor-beta
1
in cardiomyop-
athy, valvular disease and arrhythmia. Immunology 2006,
118:10-24.
17. Martinelli AL, Ramalho LN, Zucoloto S: Hepatic stellate cells in
hepatitis C patients: relationship with liver iron deposits and
severity of liver disease. J Gastroenterol Hepatol 2004, 19:91-8.
18. Ribeiro PS, Cortez-Pinto H, Solá S, Castro RE, Ramalho RM, Baptista
A, Moura MC, Camilo ME, Rodrigues CM: Hepatocyte apoptosis,
expression of death receptors, and activation of NF-kappaB
in the liver of nonalcoholic and alcoholic steatohepatitis
patients. Am J Gastroenterol 2004, 99:1708-17.
19. Langer DA, Das A, Semela D, Kang-Decker N, Hendrickson H, Bronk
SF, Katusic ZS, Gores GJ, Shah VH: Nitric oxide promotes cas-
pase-independent hepatic stellate cell apoptosis through the
generation of reactive oxygen species. Hepatology 2008,
47:1983-93.
20. Hasegawa T, Yoneda M, Nakamura K, Makino I, Terano A: Plasma
transforming growth factor-beta1 level and efficacy of alpha-
tocopherol in patients with non-alcoholic steatohepatitis: a
pilot study. Aliment Pharmacol Ther 2001, 15:1667-72.
21. Kunde SS, Lazenby AJ, Clements RH, Abrams GA: Spectrum of
NAFLD and diagnostic implications of the proposed new
normal range for serum ALT in obese women. Hepatology
2005, 42:650-6.
22. Gawrieh S, Papouchado BG, Burgart LJ, Kobayashi S, Charlton MR,
Gores GJ: Early hepatic stellate cell activation predicts severe
hepatitis C recurrence after liver transplantation. Liver Transpl
2005, 11:1207-13.
23. Palekar NA, Naus R, Larson SP, Ward J, Harrison SA: Clinical
model for distinguishing nonalcoholic steatohepatitis from
simple steatosis in patients with nonalcoholic fatty liver dis-
ease. Liver Int 2006, 26:151-6.