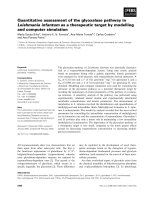
báo cáo hóa học:" Heterogeneous activation of the TGFβ pathway in glioblastomas identified by gene expression-based classification using TGFβ-responsive genes" pptx
Bạn đang xem bản rút gọn của tài liệu. Xem và tải ngay bản đầy đủ của tài liệu tại đây (471.12 KB, 11 trang )
BioMed Central
Page 1 of 11
(page number not for citation purposes)
Journal of Translational Medicine
Open Access
Research
Heterogeneous activation of the TGFβ pathway in glioblastomas
identified by gene expression-based classification using
TGFβ-responsive genes
Xie L Xu*
1,2
and Ann M Kapoun
1,3
Address:
1
Biomarker R&D, Scios Inc, Fremont, California, USA,
2
Current address: Experimental Medicine, Johnson & Johnson Pharmaceutical
Research and Development, San Diego, California, USA and
3
Current address: Department of Translational Medicine, OncoMed Pharmaceuticals
Inc, Redwood City, California, USA
Email: Xie L Xu* - ; Ann M Kapoun -
* Corresponding author
Abstract
Background: TGFβ has emerged as an attractive target for the therapeutic intervention of
glioblastomas. Aberrant TGFβ overproduction in glioblastoma and other high-grade gliomas has
been reported, however, to date, none of these reports has systematically examined the
components of TGFβ signaling to gain a comprehensive view of TGFβ activation in large cohorts
of human glioma patients.
Methods: TGFβ activation in mammalian cells leads to a transcriptional program that typically
affects 5–10% of the genes in the genome. To systematically examine the status of TGFβ activation
in high-grade glial tumors, we compiled a gene set of transcriptional response to TGFβ stimulation
from tissue culture and in vivo animal studies. These genes were used to examine the status of TGFβ
activation in high-grade gliomas including a large cohort of glioblastomas. Unsupervised and
supervised classification analysis was performed in two independent, publicly available glioma
microarray datasets.
Results: Unsupervised and supervised classification using the TGFβ-responsive gene list in two
independent glial tumor gene expression data sets revealed various levels of TGFβ activation in
these tumors. Among glioblastomas, one of the most devastating human cancers, two subgroups
were identified that showed distinct TGFβ activation patterns as measured from transcriptional
responses. Approximately 62% of glioblastoma samples analyzed showed strong TGFβ activation,
while the rest showed a weak TGFβ transcriptional response.
Conclusion: Our findings suggest heterogeneous TGFβ activation in glioblastomas, which may
cause potential differences in responses to anti-TGFβ therapies in these two distinct subgroups of
glioblastomas patients.
Background
Glial tumors are the most common primary brain malig-
nancies in adults. In the United States, they result in an
estimated 13,000 deaths every year [1]. The most aggres-
sive form, glioblastoma (WHO Grade IV), also known as
glioblastoma multiforme, is one of the most deadly
Published: 3 February 2009
Journal of Translational Medicine 2009, 7:12 doi:10.1186/1479-5876-7-12
Received: 1 October 2008
Accepted: 3 February 2009
This article is available from: />© 2009 Xu and Kapoun; licensee BioMed Central Ltd.
This is an Open Access article distributed under the terms of the Creative Commons Attribution License ( />),
which permits unrestricted use, distribution, and reproduction in any medium, provided the original work is properly cited.
Journal of Translational Medicine 2009, 7:12 />Page 2 of 11
(page number not for citation purposes)
human malignancies. Glioblastoma patients have a
median survival time of less than 12 months despite the
standard treatment of surgery, radiotherapy and nitrosou-
rea-based chemotherapy [2]. Significant morbidity and
mortality comes from local invasion of the tumor prevent-
ing complete surgical resection. Glioblastoma may
develop from a diffuse astrocytoma or an anaplastic astro-
cytoma (secondary glioblastoma), but more commonly
presents de novo without evidence of a less malignant pre-
cursor (primary glioblastoma). Genetically, amplification
of the epidermal growth factor receptor (EGFR) locus is
found in approximately 40% of primary glioblastomas
but is rarely found in secondary glioblastomas; mutations
of the tumor suppressor gene phosphatase and tensin
homolog deleted on chromosome 10 (PTEN) are observed in
45% of primary glioblastomas and are seen more fre-
quently in primary glioblastomas than in secondary gliob-
lastomas [3]. Loss of heterozygosity (LOH) of
chromosome 10 and loss of an entire copy of chromo-
some 10, which harbors the PTEN gene, are the most fre-
quently observed chromosomal alterations. The aberrant
EGFR expression and the mutation of PTEN leads to
abnormal activation of phosphoinositide-3-kinase
(PI3K)/v-akt murine thymoma viral oncogene homolog
(AKT) pathway, which provides necessary signals for
tumor cell growth, survival and migration [4]. The impor-
tance of activation of EGFR-PI3K/PTEN pathway in the
pathogenesis of glioblastoma has been confirmed in the
subgroup of patients who showed clinical responses to
EGFR kinase inhibitors [5,6].
The transforming growth factor-β (TGFβ)-mediated path-
way has also been shown to play critical roles in glial
tumors. The high-grade malignant gliomas express TGFβ
ligands and receptors, which are not expressed in normal
brain, gliosis, or low-grade astrocytomas [7-10]. The
immunosuppressive cytokine, TGFβ, secreted by the
tumor cells interferes with the host antitumor immune
response therefore allowing the tumor to escape immuno-
surveilance [11]. Furthermore, TGFβ may act directly as a
tumor progression factor. The growth-inhibition function
on normal epithelial cells has been lost in many tumor-
derived cell lines [12]. The ability of TGFβ to enhance cell
migration promotes tumor growth and invasion in
advanced epithelial tumors [13-15].
TGFβ ligands are secreted in latent forms and are activated
through cleavage of the carboxyl-terminal latency-associ-
ated peptide. Activated TGFβ ligands bind to specific cell
surface receptors to form an activated heterodimeric ser-
ine/threonine kinase receptor complex. The constitutively
active type II receptor phosphorylates and activates the
type I receptor upon binding of the activated ligands,
which then initiates the intracellular signaling cascade
involving the SMAD, a family of proteins similar to the
gene products of the Drosophila gene "mothers against
decapentaplegic" (Mad) and the C. elegans gene Sma.
SMAD2 and SMAD3 specifically mediate the signals
induced by TGFβ. Phosphorylated SMAD2/3 are released
from the receptor complex and bind to SMAD4. The
SMAD2(3)/SMAD4 complex is translocated into the
nucleus and regulates the transcription of specific target
genes. TGFβ may act via the SMAD pathway to either pro-
mote or inhibit the transcription of specific genes [16].
The transcriptional profiles induced upon TGFβ stimula-
tion have been examined using microarray technology
[17-24]. Diversified yet overlapping transcriptional
responses are generated by TGFβ stimulation in different
tissues in different species. In general, the expressions of
5–10% genes in the genome are affected upon TGFβ stim-
ulation.
Large-scale microarray analysis has been used in gliomas
to identify gene signatures that have the power to predict
survival and subclasses of gliomas that represent distinct
prognostic groups [25-27]. Gene expression-based classi-
fication of malignant gliomas was shown to correlate bet-
ter with survival than histological classification [28]. In
this current investigation, we analyzed the transcriptional
responses generated upon TGFβ stimulation from multi-
ple studies. We then used this gene signature to examine
the activation status of TGFβ in high-grade gliomas using
published microarray data.
Methods
Glioma microarray datasets
Two glioblastoma microarray datasets were used in this
study: Freije et al [25] and Nutt et al [28]. The Freije study
included 85 tumor samples (dChip133ABGliomasGrdIII_
IV.xls) and used the affymetrix U133A and U133B gene
chips, which contain more than 45,000 probesets. Con-
sistent with the original publication, the dCHIP [29] nor-
malized expression values were used in the analysis. The
quality of the data was examined by scatter plots and cor-
relation coefficients were calculated among all samples. 5
tumors (GBM 1469, GBM 1544, GBM 2015, GBM 749,
GBM 839) were excluded from further analysis due to
large artifacts on the scatter plots and low correlation coef-
ficients with the rest of the samples. Between the two rep-
licates of tumor # 975 (OLIGO III 975 and OLIGO III
975.1), OLIGO III 975 was included here, since it showed
better quality as assessed from the scatter plot. The average
of the two replicates (OLIGO III 744, OLIGO III 744.1)
was used for the same reason. A total of 78 tumors from
this dataset were used in the subsequent analysis. The sec-
ond, independent dataset from Nutt et al [28] included 50
tumors and was generated on the Affymatrix U95A plat-
form. The files with .cel format were downloaded from
/> and
normalized with GC-RMA in Splus 6.2 (Insightful) with
Journal of Translational Medicine 2009, 7:12 />Page 3 of 11
(page number not for citation purposes)
the S+ArrayAnalyzer module (2.0). Pearson's correlation
coefficients were calculated among all tumors and 4
tumors (Brain_NG_13, Brain_CG_1, Brain_NG_11,
Brain_CG_10) were excluded from further analysis due to
low correlation coefficients with the rest of samples. A
total of 46 samples from this dataset were used in the fol-
lowing analysis.
Data analysis
ANOVA, t-test, Pearson's correlation coefficient calcula-
tions, Support Vector Machine (SVM) classification, and
survival analysis were computed using MATLAB 7.1 soft-
ware (MathWorks, Natick, MA). The hierarchical cluster-
ing was performed in Spotfire DecisionSite 8.1 for
Functional Genomics (Spotfire, Somerville, MA). The
overall outline of the analysis steps is summarized in Fig-
ure 1.
TGF
β
-Responsive gene list
The comprehensive TGFβ-responsive gene set was com-
piled from 3 in-house microarray studies, 6 published
microarray studies [19-24], and an in-house curation of
>100 publications on TGFβ regulated genes. The 3 in-
house microarray studies include: human lung fibroblast
+/- TGFβ [17], human glioblastoma cell line LN308 +/-
TGFβ (unpublished data), and human pancreatic cancer
cell line Panc1 +/- TGFβ [30]. For the published microar-
ray studies, the whole datasets were not always available,
however, the differentially expressed gene list based on
the authors' criteria was normally presented in the publi-
cations. The following strategy was utilized to summarize
the results from different studies and publications. For
each of the microarray studies, if a gene was identified by
the original authors using their criteria as differentially
expressed after TGFβ stimulation at any of the time points
in the original publication, it contributed one count to
this gene. If the gene was one of the in-house curated
TGFβ regulated genes, it also contributed one count. For
in-house microarray studies where the whole datasets
were available, a differentially expressed gene was defined
as genes with at least 1.8 fold change in response to TGFβ
treatment. If the study was done in mouse models, the
human orthologs were identified for the mouse genes
through the ortholog map from Mouse Genome Infor-
matics />. The counts were
then summed across all studies for each gene (Additional
file 1: Counts of Studies). The direction of changes after
TGFβ treatment was also summarized in the following
fashion: upregulation of gene expressions upon TGFβ
stimulation contributed positive counts, while downregu-
lation of gene expressions after TGFβ treatment contrib-
uted negative counts. The signed counts were then
summed across all microarray studies. If one gene is
upregulated by TGFβ in one study but downregulated by
TGFβ in another study, the direction counts will cancel
each other during summarization therefore the total direc-
tion counts will be fewer than the total counts of the stud-
ies (Additional file 1: Directions). Since the direction of
changes in TGFβ regulated genes curated from literature
were not readily available in our database, they were not
included in the directional counts.
Results
Identification of TGF
β
-Responsive gene set
To investigate potential TGFβ activation among glial
tumors, we first identified a gene set that was responsive
to TGFβ stimulation using in-house and public microar-
ray data. Based upon several large-scale gene expression
profiling experiments, TGFβ is expected to generate tran-
scriptional responses that would impact 5–10% of the
genome in any given tissues and the transcription profiles
upon TGFβ stimulation would be quite diversified in dif-
ferent tissues and species [17,19-24]. The transcriptional
responses generated by chronic TGFβ stimulation on
tumor tissues would also be different from acute TGFβ
stimulation on normal tissues and cell lines. With the var-
iability among microarray experiments, the transcrip-
tional profile from a single experiment is not sufficient to
identify TGFβ-responsive genes in glioma tumors. We
examined the genes differentially expressed upon TGFβ
Outline of data analysis stepsFigure 1
Outline of data analysis steps.
Journal of Translational Medicine 2009, 7:12 />Page 4 of 11
(page number not for citation purposes)
treatment in multiple large-scale gene expression profiling
studies from both the majority of the published literature
at the time this study was conducted, and data from in-
house microarray experiments; these datasets included
multiple tissue types in both human and animal models.
Together with curating >100 publications on TGFβ-regu-
lated genes, we compiled a comprehensive TGFβ-respon-
sive gene set using the strategy described above. A total of
2749 unique human genes were identified as responsive
to TGFβ stimulation in at least one of the studies (Addi-
tional file 2). Although a majority (2129, 77%) of the
genes were identified from one study, which may reflect
the diversity of TGFβ transcriptional responses in different
tissues and species, core TGFβ-responsive genes were
identified in multiple studies showing the independence
of tissue and species origins. 445 (17%) genes were iden-
tified in 2 independent studies and 175 (6%) genes were
identified in at least 3 independent studies. Representative
TGFβ-responsive genes with references are shown in Addi-
tional file 1. Gene ontology annotation showed that these
genes are involved in a wide variety of biological func-
tions where TGFβ plays a role, such as cell growth control,
angiogenesis, signal transduction, immune response, cell
adhesion, cell motility, and regulation of transcription.
As a first step towards characterizing the TGFβ-responsive
gene set in gliomas, we examined the expression of a clas-
sic TGFβ target gene SERPINE1 in glial tumors within the
Freije data set. The expression of SERPINE1, also called
PAI-1, has been shown to be regulated by TGFβ in several
reports [31]. Multiple TGFβ-responsive elements have
been identified at the promoter region of the SERPINE1
gene [32,33]. The protein products of the SERPINE1 gene
play important roles in TGFβ-mediated biological proc-
esses such as fibrosis and wound healing [34]. The induc-
tion of SERPINE1 expression by TGFβ was abolished by
agents that interfered with TGFβ signaling [17]. Our
ANOVA analysis of the Freije study suggested that there
was no significant association between SERPINE1 expres-
sion and age or gender. However, SERPINE1 expression
was significantly associated with the following histologi-
cal types: glioblastoma (GBM), anaplastic astrocytoma
Figure 2
The expression of TGFβ downstream targets SERPINE1 in glial tumors (the Freije dataset) shown in box plotsFigure 2
The expression of TGFβ downstream targets
SERPINE1 in glial tumors (the Freije dataset) shown
in box plots. Y-axis is the expression level of SERPINE1 in
log2 scale. The black arrow indicates the mean expression
level of SERPINE1 in each type of gliomas. Red spots indicate
the outlier samples. The table underneath of the box plots
are the summary statistics (count, mean, standard deviation
(StdDev), median) of the expression level of SERPINE1 by gli-
oma types. A: Significant association of SERPINE1 expression
and histology classification. SERPINE1 is significantly upregu-
lated in glioblastoma (GBM) compared to anaplastic astrocy-
toma (Astro), anaplastic oligodendroglioma (Oligo) and
mixed glioma, anaplastic oligoastrocytoma (Mix). The mean
expression level of SERPINE1 is 6.1-fold higher in glioblast-
oma compared to anstrocytoma, 5.3-fold higher compared
to mixed glioma and 1.9-folder higher compared to oligoden-
droglioma. P-value computed using ANOVA is indicated at
the top right corner of the plot. B. Significant association of
SERPINE1 expression and the grade of the tumor. SERPINE1
is significantly upregulated in grade IV tumors (GBM) com-
pared to grade III tumors (Astro, Oligo, Mix). The mean
expression level of SERPINE1 is 3.7-fold higher in grade IV
tumors (GBM) than in grade III tumors. The P-value was
computed using a t-test as indicated in the top left corner of
the plot. C. The expression of SERPINE1 is highly correlated
with FN1 expression in gliomas. The correlation coefficient
(R) and P-value of correlation (p) were indicated in the plot.
The histology types of the gliomas are indicated by colors
(blue: GBM, red: Astro, pink: Mix, black: Oligo).
Journal of Translational Medicine 2009, 7:12 />Page 5 of 11
(page number not for citation purposes)
(Astro), anaplastic oligodendroglioma (Oligo) and mixed
glioma, anaplastic oligoastrocytoma (Mix)(p < 1.52 × 10
-
5
), as well as grades (III and IV) (p < 7.87 × 10
-6
).
SERPINE1 expression was significantly upregulated in
glioblastoma (grade IV) compared to other grade III glial
tumors (anaplastic astrocytoma, anaplastic oligodendrog-
lioma and mixed glioma, anaplastic oligoastrocytoma,
Figure 2A and Figure 2B). Similar results were found in
another TGFβ target FN1 (Additional file 2). Moreover,
the expressions of SERPINE1 and FN1 were highly corre-
lated among the high-grade gliomas (correlation coeffi-
cient r = 0.687, Figure 2C), suggesting the activation of
TGFβ pathway [35]. We also found similar expression pat-
terns in a second independent glioma dataset, the Nutt
study [28].
Similar to SERPINE1 and FN1, the expression of many
other well-known TGFβ downstream targets was signifi-
cantly upregulated in glioblastoma (grade IV) compared
to grade III glial tumors, and they are highly correlated
with SERPINE1 (Additional File 1), including TGIF (p <
1.11 × 10
-8
, r = 0.57), VEGF (p < 7.57 × 10
-7
r = 0.63),
THBS1 (p < 0.005, r = 0.80), TIMP1 (p < 2.5 × 10
-7
, r =
0.80), COL4A1 (p < 1.7 × 10
-7
, r = 0.62), COL1A2 (p <
8.88 × 10
-7
, r = 0.69) [20,36-38]. Among the 2749 TGFβ-
responsive gene set, 2708 unique genes were represented
by 7173 array elements in the Freije study [25]. Among
the 7173 probesets representing the TGFβ-responsive
genes, 417 representing 323 unique genes were signifi-
cantly upregulated in glioblastomas compared to grade III
gliomas with p < 0.001 and fold change >1.5. 1588
probesets representing 997 unique genes were signifi-
cantly correlated with SERPINE1 with p < 0.001. The com-
plete TGFβ-responsive gene set is summarized in
Additional file 2.
Assessment of TGF
β
activation in gliomas using the TGF
β
-
Responsive gene set
Initially the activation of TGFβ in gliomas was assessed by
unsupervised hierarchical clustering of glial tumor micro-
array data from the Freije study [25] using the most con-
sistent TGFβ-responsive genes in the set (Additional file
1). A TGFβ-responsive classifier set (103 probe sets repre-
senting 60 unique genes) was selected as the classifiers
using the following criteria: 1) they have been identified
to respond to TGFβ stimulation in at least 3 studies; 2)
they were consistently up- or down-regulated by TGFβ
stimulation in a majority of these studies (absolute direc-
tion counts > 50% of total study counts); 3) they varied
among all tumors in the Freije dataset (CV >10%) [25]. By
visual inspection of the hierarchical clustering results, we
identified two small subsets of the glial tumors that
showed distinct patterns of the 103 TGFβ-responsive clas-
sifiers (Figure 3): one with higher expression of many
molecules that were induced by TGFβ in vitro and were
known as classical TGFβ downstream targets, including
SERPINE1, FN1, THBS1, COL6A1, COL4A1, COL1A2,
LTBP2, ITGB5 (Figure 3, highlighted in green, see Addi-
tional file 2 for the order of 103 probe sets), therefore rep-
resented strong TGFβ transcriptional response (right, 11
tumors). In contrast, the expression of these molecules
was much lower in the other cluster, which represented
weak TGFβ transcriptional response (left, 10 tumors).
Grade III tumors (8 out of 10) were the majority in the
weak TGFβ response cluster, while the strong TGFβ
response cluster contained all glioblastomas (Figure 3).
The status of TGFβ activation in the remaining tumors is
unclear from visual inspection of the hierarchical cluster-
ing results.
Support vector machine algorithm was then used to fur-
ther classifying the TGFβ transcriptional responses among
the remaing glial tumors. The 11 tumors in the subset
showing strong TGFβ transcriptional responses and the 10
tumors in the weak TGFβ transcriptional responses group
(Figure 3) served as the training set. The machine learning
was restricted to the 7173 TGFβ-responsive probe sets.
The Leave-two-out cross-validation showed 100% accu-
racy among the training set, suggesting clear distinction
between the two subgroups. The rest of the glioma sam-
ples were then subjected to SVM as the test set. Table 1
summarized the results of the SVM classification. In total,
the majority of the grade III (96%) tumors with one
exception were classified as weak TGFβ response group,
while over half of grade IV glioblastomas (59%) were clas-
sified as strong TGFβ responses, suggesting that TGFβ is
more commonly activated in glioblastomas. However,
among glioblastomas, the level of TGFβ activation, as
assessed by TGFβ-induced transcriptional response, is
quite heterogeneous.
To further examining the differential gene expressions
between the two TGFβ response glioblastomas subgroups,
we employed the student t test for each gene and the
results are shown in Additional file 3. A total of 3497
probesets had a p value of less than 0.001, including 1386
that had a fold change larger than 1.7. This set represented
982 unique known genes and 97 unknown genes, and
their differential gene expression patterns among the
glioblastomas are shown in Figure 4. P values and mean
fold changes for representative TGFβ downstream targets
(highlighted in green in Figure 4) are shown in Table 2.
The expressions of these TGFβ downstream targets were
highly elevated in TGFβ strong response glioblastomas
compared to those in TGF
β weak response glioblastoma
subgroup, confirming the heterogenenous activation of
TGFβ pathway in glioblastomas.
TGFβ activation is associated with tumor progression and
recurrence. In 4 out of 6 cases where primary and recur-
Journal of Translational Medicine 2009, 7:12 />Page 6 of 11
(page number not for citation purposes)
rent tumor samples from the same patients were available,
TGFβ response in the recurrent glioblastomas became
strong from the weak status in the primary tumors (Table
3). No significant survival difference between the two
TGFβ response groups in glioblastomas was observed
with standard treatments (data not shown), though their
potential response to anti-TGFβ therapies may be differ-
ent.
Validation of TGF
β
transcriptional response patterns in an
independent gliomas microarray study
An independent microarray gene expression dataset con-
taining 28 glioblastoma and 22 anaplastic oligodendrog-
The SVM training set showing distinct weak or strong TGFβ response pattern in the 103 classifiers that were selected from the most consistent TGFβ-responsive genes (in the Freije dataset)Figure 3
The SVM training set showing distinct weak or strong TGFβ response pattern in the 103 classifiers that were
selected from the most consistent TGFβ-responsive genes (in the Freije dataset). The data were Z-score trans-
formed and the color range was indicated by the color bar below the heatmap. Each column represents a tumor sample and
the tumor identification number is shown at the bottom of the column. These tumors were selected as training set for the
SVM algorithm. Each row represents one of the 103 TGFβ-responsive probesets that were selected from the most consistent
TGFβ-responsive genes. The orders of these genes are shown in Additional file 2.
Journal of Translational Medicine 2009, 7:12 />Page 7 of 11
(page number not for citation purposes)
lioma were obtained from Nutt et al [28]. The Nutt dataset
was generated using the Affymatrix U95A platform that
includes about 12000 probe sets. Using the same criteria
described above, 101 probe sets representing 72 unique
genes were selected from the most consistent TGFβ-
responsive genes. 47 of the 72 genes overlap with those
used in the Freije study [25]. Subgroups of TGFβ
responses similar to those seen in the Freije study [25]
were also found by unsupervised clustering (data not
shown). SVM classification was used among 3095 probe
sets representing TGFβ responsive genes, with a training
set of 8 samples showing weak TGFβ response and 8 sam-
ples showing strong TGFβ response in the hierarchical
clustering analysis. The summary of the TGFβ response
subgroups from the Nutt study [28] is also shown in Table
1. Overall, the results from the Nutt dataset were consist-
ent with our results from the Freije dataset [25]. The
majority of grade III anaplastic oligodendrogliomas
(82%) showed weak TGFβ response while the majority of
grade IV glioblastoma (67%) showed strong TGFβ
response. Similar to the observations in the Freije study
[25], TGFβ activation is heterogeneous. The expressions of
many well-known TGFβ downstream targets were signifi-
cantly different between the two TGFβ response sub-
groups within glioblastomas (Table 2).
Discussion
Antagonizing the biological effects of TGFβ has become a
potential experimental strategy to treat glioblastoma, one
of the most devastating human cancers. Several anti-TGFβ
therapies have shown promise in both preclinical and
early clinical trials [39]. The current rationale for TGFβ
antagonism includes its role in tumor promotion, migra-
tion and invasion, metastasis, and tumor-induced immu-
nosuppression. Numerous reports suggest aberrant TGFβ
activation in glioblastoma and other high-grade gliomas.
This includes abnormal expression of the ligands, more
specifically TGFB2 and higher levels of phosphorylated
SMADs. However, to date, none of these reports has sys-
tematically examined the components of TGFβ signaling
to gain a comprehensive view of TGFβ activation in a large
cohort of human glioma patients. In this study, we
adopted an alternative approach. By examining the tran-
scriptional responses induced by TGFβ activation in pub-
licly available microarray data, we identified two
subgroups of glioblastomas that showed distinct patterns
of TGFβ activation in two independent studies. Combin-
Table 1: Summary of TGFβ transcriptional responses from SVM
Classification of Glial Tumors in the Freije Study and the Nutt
Study
Freije et al Nutt et al
Grade Weak Strong Weak Strong
Training Set
III 8 0 6 1
IV 2112 7
Test Set
III 15 1 12 3
IV 20 21 6 9
Total
III 23(96%) 1(4%) 18(82%) 4(18%)
IV 22(41%) 32(59%) 8(33%) 16(67%)
Table 2: The Expression of TGFβ downstream targets between the weak and strong TGFβ response groups in Glioblastomas
Freijie et al Nutt et al
Gene Title Gene Symbol p Value Fold Change p Value Fold Change
collagen, type I, alpha 1 COL1A1 8.55E-09 6.68 0.018768 2.93
collagen, type I, alpha 2 COL1A2 4.13E-10 4.36 7.10E-05 10.38
collagen, type III, alpha 1
(Ehlers-Danlos syndrome type IV, autosomal dominant)
COL3A1 6.22E-09 5.61 0.002025 5.30
collagen, type IV, alpha 1 COL4A1 7.71E-09 8.38 0.000171 5.48
collagen, type IV, alpha 2 COL4A2 4.75E-09 5.20 4.19E-05 7.69
collagen, type V, alpha 1 COL5A1 4.35E-10 3.82 0.002531 -1.11
collagen, type V, alpha 2 COL5A2 3.52E-09 3.95 5.43E-07 5.14
collagen, type VI, alpha 1 COL6A1 6.40E-07 3.09 2.48E-05 4.95
collagen, type VI, alpha 2 COL6A2 4.04E-11 6.79 4.24E-05 25.45
Collagen, type VIII, alpha 1 COL8A1 1.94E-08 4.52 0.122094 1.27
fibronectin 1 FN1 2.10E-07 2.43 5.45E-05 3.77
serine (or cysteine) proteinase inhibitor, clade E (nexin, plasminogen
activator inhibitor type 1), member 1
SERPINE1 1.54E-09 5.69 0.000334 10.83
TGFB-induced factor (TALE family homeobox) TGIF 1.71E-05 1.83 1.63E-06 3.41
thrombospondin 1 THBS1 2.17E-08 4.28 0.301818 1.29
tissue inhibitor of metalloproteinase 1
(erythroid potentiating activity, collagenase inhibitor)
TIMP1 1.22E-15 6.46 4.19E-06 23.22
vascular endothelial growth factor VEGF 5.23E-06 3.32 5.72E-06 10.90
Journal of Translational Medicine 2009, 7:12 />Page 8 of 11
(page number not for citation purposes)
ing the two independent microarray studies of high-grade
gliomas, we found that the grade IV glioblastomas
showed stronger TGFβ induced transcriptional response
than the grade III tumors. In addition, among glioblasto-
mas, 48 out of 78 (62%) showed strong TGFβ activation,
while the remaining 38% showed a much weaker TGFβ
transcriptional response. How effective the anti-TGFβ
therapies would be in the two subgroups of glioblastomas
showing distinct TGFβ activation patterns is an open
question for future clinical trials. Nevertheless, this study
confirmed the previous notion that TGFβ activation
occurs commonly in a large portion of glioblastomas, and
anti-TGFβ therapies are likely to be beneficial for those
patients.
By examining the genes differentially expressed between
the two identified subgroups of glioblastomas that
showed different TGFβ transcriptional responses, we
found that the ligands TGFB1, TGFB2 and their receptors
were expressed significantly higher in the strong TGFβ
response group (Additional file 3) compared to those in
the weak TGFβ response group, suggesting that increased
expression of the ligands and receptors contributed to
TGFβ activation. THBS1, an activator of TGFβ, was shown
to have a higher level in the strong TGFβ response group
in one study, suggesting that TGFβ activation may also
result from increased bioavailability. In contrast, SMAD7,
a negative regulator of TGFβ pathway that often was
induced upon TGFβ stimulation in vitro (Additional file
1), was downregulated in the strong TGFβ response group
(fold change -1.48, p < 0.0007), suggesting the tumor-spe-
cific escape of the negative feedback mechanism may also
contributed to TGFβ activation in glioblastomas. In addi-
tion, genes involved in antigen presentation were upregu-
lated in the TGFβ strong response glioblastomas. These
included the genes encoding class I major histocompati-
bility complex proteins HLA-A, HLA-B, HLA-C, HLA-E,
HLA-F, HLA-G, class II major histocompatibility complex
Differentially expressed genes in the two subgroups of glioblastomas with strong and weak TGFβ response (in the Freije data-set)Figure 4
Differentially expressed genes in the two subgroups of glioblastomas with strong and weak TGFβ response (in
the Freije dataset). The data were Z-score transformed and the color range was indicated by the color bar below the heat-
map. Each column represents a glioblastoma sample and the tumor identification number is shown at the bottom of the col-
umn. Each row represents one of the 1386 differentially expressed gene with p < 0.001 and fold change >1.7. The classical
TGFβ downstream targets in Table 2 are highlighted as green.
Journal of Translational Medicine 2009, 7:12 />Page 9 of 11
(page number not for citation purposes)
proteins HLA-DMA, HLA-DMB, HLA-DPA1, HLA-DPB1,
HLA-DQB1, HLA-DRA, HLA-DRB1, MHC class I binding
protein CANX, immunoproteosomal subunits PSMB8
and PSMB9, and MHC peptide transport protein TAP1.
The upregulation of antigen presentation molecules in the
TGFβ strong response glioblastomas suggests that the
reported tumor-mediated immunosuppression in gliob-
lastoma occurs through other mechanisms. One study
suggested direct targeting of cytotoxic T cell functions by
TGFβ and downregulation of the expression of five cyto-
lytic molecules perforin, granzyme A, granzyme B, Fas lig-
and and interferon γ in T lymphocytes [40]. Strong TGFβ
response glioblastomas identified in this study also
showed higher expression of many molecules involved in
integrin signaling (ACTA2, ACTN1, ACTN4, ARPC4,
COL1A1, COL1A2, COL4A1, COL4A2, DIRAS3, FN1,
ITGA2, ITGA3, ITGA4, ITGA7, ITGB1, ITGB2, ITGB4,
ITGB5, LAMA4, LAMB1, LAMB2, LAMC1, MRCL3, RAP2B,
RHOC, RHOJ, RRAS, SHC1, VASP, and ZYX). Integrins
have been shown to mediate the activation of TGFβ [41]
and TGFβ is known to regulate the expression of cell adhe-
sion molecules including integrins [42,43]. Interestingly,
the glioblastoma group that showed a strong TGFβ
response also showed higher expression of the molecules
involved in angiogenesis, such as VEGF, FLT1, NRP1,
NRP2, ANGPT2, JAG1, ARTS1, TNFRSF12A. Also the gene
expression of a group of insulin-like growth factor bind-
ing proteins, including IGFBP2, IGFBP3, IGFBP4, IGFBP5,
and IGFBP7 were significantly higher in TGFβ strong
response glioblastomas. Interestingly, IGFBP2, one of the
most significant gene changes between the two subgroups
of glioblastomas showing different TGFβ responses (fold
change 7.37, p < 1.27 × 10
-9
), has been shown to enhance
glioblastoma invasion [44]. In contrast, the molecules
involved in GABA receptor signaling (GABBR1, GABRA1,
GABRA5, GABRB1, GABRB3, GABRG2, GAD1, GPR51)
and glutamate receptor signaling (GLS, GRIA2, GRIA4,
GRM1, GRM5, GRM7, SLC17A6, SLC17A7, SLC1A1) were
downregulated in the TGFβ strong response glial tumors.
BMP2, a member of TGFβ superfamily that has been
shown to promote GABAergic neuron differentiation
[45], was also downregulated in the TGFβ strong response
glioblastomas (Fold change -2.43, p < 0.0013). These
genes differentially expressed between the two identified
subgroups of glioblastomas that showed different TGFβ
transcriptional responses provide insights into the poten-
tial mechanisms of TGFβ-mediated tumor progression
and invasion in glioblastomas.
EGFR amplification and PTEN mutations/10q LOH are
frequent genetic alterations observed in glioblastomas.
Recently a gene signature generated from autocrine plate-
let-derived growth factor (PDGF) signaling in gliomas has
been used to classify gliomas, and it was shown that EGFR
amplification and PTEN mutation/10q LOH were largely
enriched in the cluster showing weak autocrine PDGF sig-
naling [46]. Using the same signature, we found the TGFβ
strong response cluster overlapped with the weak auto-
crine PGDG signaling subgroup extensively (data not
shown), suggesting potential collaboration between
EGFR/PTEN/PI-3K pathway and TGFβ pathway in gliob-
lastoma development and progression. Numerous evi-
dence in vitro also showed the collaborating roles of EGFR
and TGFβ in inducing epithelial to mesenchymal transi-
tion, an event that contributes to cell migration, invasion,
cell survival and angiogenesis [47-50]. Future studies will
be needed to examine if EGFR amplification and PTEN
mutation/10q LOH were enriched in the subgroups of
glioblastomas that showed strong TGFβ transcriptional
response.
Conclusion
Using the TGFβ-responsive genes we compiled from vari-
ous studies, we examined the status of TGFβ pathway acti-
vation in high-grade gliomas in two independent,
publicly available, large-scale gene expression datasets.
The purpose of this manuscript is not to establish or test a
gene signature that can be used to prospectively classify
future datasets in a platform-independent fashion. Rather
our goal is to examine the status of TGFβ activation and its
heterogeneity among glioblastomas. Therefore, we
applied the same methodology/algorithm in two inde-
pendent datasets and found similar results. Consistent
with previous reports, we found that glioblastomas
showed a stronger TGFβ response than grade III gliomas.
Table 3: Association of TGFβ responses with tumor progression
and recurrence.
Tumor Type TGFb activation class
MIXED III 886 Primary Weak
GBM 1463 Recurrent Weak
OLIGO III 975 Primary Weak
GBM 1028 Recurrent Weak
OLIGO III 744 Primary Weak
GBM 996 Recurrent Strong
OLIGO III 840 Primary Weak
GBM 1334 Recurrent Strong
GBM 938 Primary Weak
GBM 1406 Recurrent Strong
GBM 2028 Primary Weak
GBM 2029 Primary Weak
GBM 2067 Recurrent Strong
GBM 2068 Recurrent Weak
Primary and recurrent tumors from the same patient were grouped
together.
Journal of Translational Medicine 2009, 7:12 />Page 10 of 11
(page number not for citation purposes)
More importantly, among glioblastmas, two subgroups
with distinct patterns of TGFβ activation were identified.
This molecular stratification of glial tumors using TGFβ
transcriptional response is potentially relevant to TGFβ-
targeted therapies. A small subset of the gene signatures
with classification power are currently under investigation
to identify biomarkers that potentially can be used in the
clinical setting with anti-TGFβ therapies.
Competing interests
AMK, while employed by Scios Inc., held stock options in
the company.
Authors' contributions
Both authors have read and approved the final manu-
script. XLX conducted the study and prepared the manu-
script. AMK supervised the study and edited the
manuscript.
Additional material
Acknowledgements
The authors wish to express their gratitude to the authors of Freije et al
[25] and Nutt et al [28] for their generosity in sharing the data with the pub-
lic and Darren Wong for his comments on the manuscript.
References
1. Jemal A, Siegel R, Ward E, Murray T, Xu J, Smigal C, Thun MJ: Cancer
statistics, 2006. CA: a Cancer Journal for Clinicians 2006, 56:106-130.
2. Stewart LA: Chemotherapy in adult high-grade glioma: a sys-
tematic review and meta-analysis of individual patient data
from 12 randomised trials. Lancet 2002, 359:1011-1018.
3. Kitange GJ, Templeton KL, Jenkins RB: Recent advances in the
molecular genetics of primary gliomas. Current Opinion in Oncol-
ogy 2003, 15:197-203.
4. Choe G, Horvath S, Cloughesy TF, Crosby K, Seligson D, Palotie A,
Inge L, Smith BL, Sawyers CL, Mischel PS: Analysis of the phos-
phatidylinositol 3'-kinase signaling pathway in glioblastoma
patients in vivo. Cancer Research 2003, 63:2742-2746.
5. Rich JN, Reardon DA, Peery T, Dowell JM, Quinn JA, Penne KL, Wik-
strand CJ, Van Duyn LB, Dancey JE, McLendon RE, et al.: Phase II
trial of gefitinib in recurrent glioblastoma. Journal of Clinical
Oncology 2004, 22:133-142.
6. Mellinghoff IK, Wang MY, Vivanco I, Haas-Kogan DA, Zhu S, Dia EQ,
Lu KV, Yoshimoto K, Huang JH, Chute DJ, et al.: Molecular deter-
minants of the response of glioblastomas to EGFR kinase
inhibitors[see comment][erratum appears in N Engl J Med.
2006 Feb 23;354(8):884]. New England Journal of Medicine 2005,
353:2012-2024.
7. Samuels V, Barrett JM, Bockman S, Pantazis CG, Allen MB Jr: Immu-
nocytochemical study of transforming growth factor expres-
sion in benign and malignant gliomas. American Journal of
Pathology 1989, 134:894-902.
8. Kjellman C, Olofsson SP, Hansson O, Von Schantz T, Lindvall M, Nils-
son I, Salford LG, Sjogren HO, Widegren B: Expression of TGF-
beta isoforms, TGF-beta receptors, and SMAD molecules at
different stages of human glioma. International Journal of Cancer
2000, 89:251-258.
9. Horst HA, Scheithauer BW, Kelly PJ, Kovach JS: Distribution of
transforming growth factor-beta 1 in human astrocytomas.
Human Pathology 1992, 23:1284-1288.
10. Yamada N, Kato M, Yamashita H, Nister M, Miyazono K, Heldin CH,
Funa K: Enhanced expression of transforming growth factor-
beta and its type-I and type-II receptors in human glioblast-
oma. International Journal of Cancer 1995, 62:386-392.
11. Weller M, Fontana A: The failure of current immunotherapy
for malignant glioma. Tumor-derived TGF-beta, T-cell
apoptosis, and the immune privilege of the brain. Brain
Research – Brain Research Reviews 1995, 21:128-151.
12. Reiss M: Transforming growth factor-beta and cancer: a love-
hate relationship? Oncology Research 1997, 9:447-457.
13. Cui W, Fowlis DJ, Bryson S, Duffie E, Ireland H, Balmain A, Akhurst
RJ: TGFbeta1 inhibits the formation of benign skin tumors,
but enhances progression to invasive spindle carcinomas in
transgenic mice. Cell 1996, 86:531-542.
14. Oft M, Peli J, Rudaz C, Schwarz H, Beug H, Reichmann E: TGF-beta1
and Ha-Ras collaborate in modulating the phenotypic plas-
ticity and invasiveness of epithelial tumor cells. Genes & Devel-
opment 1996, 10:2462-2477.
15. Yin JJ, Selander K, Chirgwin JM, Dallas M, Grubbs BG, Wieser R, Mas-
sague J, Mundy GR, Guise TA: TGF-beta signaling blockade
inhibits PTHrP secretion by breast cancer cells and bone
metastases development. Journal of Clinical Investigation 1999,
103:197-206.
16. Feng XH, Derynck R: Specificity and versatility in tgf-beta sign-
aling through Smads. Annual Review of Cell & Developmental Biology
2005, 21:659-693.
17. Kapoun AM, Gaspar NJ, Wang Y, Damm D, Liu YW, O'Young G,
Quon D, Lam A, Munson K, Tran TT, et al.: Transforming growth
factor-beta receptor type 1 (TGFbetaRI) kinase activity but
not p38 activation is required for TGFbetaRI-induced myofi-
broblast differentiation and profibrotic gene expression. Mol
Pharmacol 2006, 70:518-531.
18. Kapoun AM, Liang F, O'Young G, Damm DL, Quon D, White RT,
Munson K, Lam A, Schreiner GF, Protter AA: B-type natriuretic
peptide exerts broad functional opposition to transforming
growth factor-beta in primary human cardiac fibroblasts:
fibrosis, myofibroblast conversion, proliferation, and inflam-
mation.
Circ Res 2004, 94:453-461.
19. Valcourt U, Kowanetz M, Niimi H, Heldin CH, Moustakas A: TGF-
beta and the Smad signaling pathway support transcrip-
tomic reprogramming during epithelial-mesenchymal cell
transition. Molecular Biology of the Cell 2005, 16:1987-2002.
20. Verrecchia F, Chu ML, Mauviel A: Identification of novel TGF-
beta/Smad gene targets in dermal fibroblasts using a com-
bined cDNA microarray/promoter transactivation
approach. Journal of Biological Chemistry 2001, 276:17058-17062.
21. Xie L, Law BK, Aakre ME, Edgerton M, Shyr Y, Bhowmick NA, Moses
HL: Transforming growth factor beta-regulated gene expres-
sion in a mouse mammary gland epithelial cell line. Breast
Cancer Research 2003, 5:R187-198.
22. Zavadil J, Bitzer M, Liang D, Yang YC, Massimi A, Kneitz S, Piek E, Bot-
tinger EP: Genetic programs of epithelial cell plasticity
directed by transforming growth factor-beta. Proceedings of the
Additional File 1
The representative TGF
β
-responsive genes.
Click here for file
[ />5876-7-12-S1.doc]
Additional File 2
Complete TGF
β
-responsive gene set in glial tumors in the Freije data-
set.
Click here for file
[ />5876-7-12-S2.xls]
Additional File 3
The difference of gene expression between the two subgroups of gliob-
lastomas showing different TGF
β
responses in the Freije dataset.
Click here for file
[ />5876-7-12-S3.xls]
Publish with BioMed Central and every
scientist can read your work free of charge
"BioMed Central will be the most significant development for
disseminating the results of biomedical research in our lifetime."
Sir Paul Nurse, Cancer Research UK
Your research papers will be:
available free of charge to the entire biomedical community
peer reviewed and published immediately upon acceptance
cited in PubMed and archived on PubMed Central
yours — you keep the copyright
Submit your manuscript here:
/>BioMedcentral
Journal of Translational Medicine 2009, 7:12 />Page 11 of 11
(page number not for citation purposes)
National Academy of Sciences of the United States of America 2001,
98:6686-6691.
23. Yang YC, Piek E, Zavadil J, Liang D, Xie D, Heyer J, Pavlidis P, Kucher-
lapati R, Roberts AB, Bottinger EP: Hierarchical model of gene
regulation by transforming growth factor beta. Proceedings of
the National Academy of Sciences of the United States of America 2003,
100:10269-10274.
24. Levy L, Hill CS: Smad4 dependency defines two classes of
transforming growth factor {beta} (TGF-{beta}) target
genes and distinguishes TGF-{beta}-induced epithelial-mes-
enchymal transition from its antiproliferative and migratory
responses. Molecular & Cellular Biology 2005, 25:8108-8125.
25. Freije WA, Castro-Vargas FE, Fang Z, Horvath S, Cloughesy T, Liau
LM, Mischel PS, Nelson SF: Gene expression profiling of gliomas
strongly predicts survival. Cancer Research 2004, 64:6503-6510.
26. Rich JN, Hans C, Jones B, Iversen ES, McLendon RE, Rasheed BK,
Dobra A, Dressman HK, Bigner DD, Nevins JR, West M: Gene
expression profiling and genetic markers in glioblastoma
survival. Cancer Research 2005, 65:4051-4058.
27. Liang Y, Diehn M, Watson N, Bollen AW, Aldape KD, Nicholas MK,
Lamborn KR, Berger MS, Botstein D, Brown PO, Israel MA: Gene
expression profiling reveals molecularly and clinically dis-
tinct subtypes of glioblastoma multiforme. Proceedings of the
National Academy of Sciences of the United States of America 2005,
102:5814-5819.
28. Nutt CL, Mani DR, Betensky RA, Tamayo P, Cairncross JG, Ladd C,
Pohl U, Hartmann C, McLaughlin ME, Batchelor TT, et al.: Gene
expression-based classification of malignant gliomas corre-
lates better with survival than histological classification. Can-
cer Research 2003, 63:1602-1607.
29. Schadt EE, Li C, Ellis B, Wong WH: Feature extraction and nor-
malization algorithms for high-density oligonucleotide gene
expression array data. J Cell Biochem Suppl 2001, 37:120-125.
30. Gaspar NJ, Li L, Kapoun AM, Medicherla S, Reddy M, Li G, O'Young
G, Quon D, Henson M, Damm DL, et al.: Inhibition of transform-
ing growth factor beta signaling reduces pancreatic adeno-
carcinoma growth and invasiveness. Mol Pharmacol 2007,
72:152-161.
31. Gerwin BI, Keski-Oja J, Seddon M, Lechner JF, Harris CC: TGF-beta
1 modulation of urokinase and PAI-1 expression in human
bronchial epithelial cells. Am J Physiol 1990, 259:L262-269.
32. Keeton MR, Curriden SA, van Zonneveld AJ, Loskutoff DJ: Identifi-
cation of regulatory sequences in the type 1 plasminogen
activator inhibitor gene responsive to transforming growth
factor beta. J Biol Chem 1991, 266:23048-23052.
33. Dennler S, Itoh S, Vivien D, ten Dijke P, Huet S, Gauthier JM: Direct
binding of Smad3 and Smad4 to critical TGF beta-inducible
elements in the promoter of human plasminogen activator
inhibitor-type 1 gene. EMBO Journal 1998, 17:3091-3100.
34. Dellas C, Loskutoff DJ: Historical analysis of PAI-1 from its dis-
covery to its potential role in cell motility and disease.
Thromb Haemost 2005, 93:631-640.
35. Gold LI: The role for transforming growth factor-beta (TGF-
beta) in human cancer. Critical Reviews in Oncogenesis 1999,
10:303-360.
36. Chen F, Ogawa K, Nagarajan RP, Zhang M, Kuang C, Chen Y: Regu-
lation of TG-interacting factor by transforming growth fac-
tor-beta. Biochemical Journal 2003, 371:257-263.
37. Hocevar BA, Brown TL, Howe PH: TGF-beta induces fibronectin
synthesis through a c-Jun N-terminal kinase-dependent,
Smad4-independent pathway. EMBO Journal 1999,
18:1345-1356.
38. Horiguchi H, Jin L, Ruebel KH, Scheithauer BW, Lloyd RV: Regula-
tion of VEGF-A, VEGFR-I, thrombospondin-1, -2, and -3
expression in a human pituitary cell line (HP75) by
TGFbeta1, bFGF, and EGF. Endocrine 2004, 24:141-146.
39. Akhurst RJ: Large- and small-molecule inhibitors of trans-
forming growth factor-beta signaling. Current Opinion in Investi-
gational Drugs 2006, 7:513-521.
40. Thomas DA, Massague J: TGF-beta directly targets cytotoxic T
cell functions during tumor evasion of immune surveil-
lance[see comment]. Cancer Cell 2005, 8:369-380.
41. Munger JS, Harpel JG, Giancotti FG, Rifkin DB: Interactions
between growth factors and integrins: latent forms of trans-
forming growth factor-beta are ligands for the integrin
alphavbeta1. Molecular Biology of the Cell 1998, 9:2627-2638.
42. Paulus W, Baur I, Huettner C, Schmausser B, Roggendorf W, Schlin-
gensiepen KH, Brysch W: Effects of transforming growth factor-
beta 1 on collagen synthesis, integrin expression, adhesion
and invasion of glioma cells. Journal of Neuropathology & Experi-
mental Neurology 1995, 54:236-244.
43. Lai CF, Feng X, Nishimura R, Teitelbaum SL, Avioli LV, Ross FP,
Cheng SL: Transforming growth factor-beta up-regulates the
beta 5 integrin subunit expression via Sp1 and Smad signal-
ing. Journal of Biological Chemistry 2000, 275:36400-36406.
44. Wang H, Wang H, Shen W, Huang H, Hu L, Ramdas L, Zhou YH, Liao
WS, Fuller GN, Zhang W: Insulin-like growth factor binding
protein 2 enhances glioblastoma invasion by activating inva-
sion-enhancing genes. Cancer Research 2003, 63:4315-4321.
45. Hattori A, Katayama M, Iwasaki S, Ishii K, Tsujimoto M, Kohno M:
Bone morphogenetic protein-2 promotes survival and differ-
entiation of striatal GABAergic neurons in the absence of
glial cell proliferation. Journal of Neurochemistry 1999,
72:2264-2271.
46. Ma D, Nutt CL, Shanehsaz P, Peng X, Louis DN, Kaetzel DM: Auto-
crine platelet-derived growth factor-dependent gene
expression in glioblastoma cells is mediated largely by acti-
vation of the transcription factor sterol regulatory element
binding protein and is associated with altered genotype and
patient survival in human brain tumors. Cancer Research 2005,
65:5523-5534.
47. Docherty NG, O'Sullivan OE, Healy DA, Murphy M, O'Neill AJ, Fitz-
patrick JM, Watson RW: TGF-beta1-induced EMT can occur
independently of its proapoptotic effects and is aided by EGF
receptor activation. American Journal of Physiology – Renal Physiology
2006, 290:F1202-1212.
48. Seton-Rogers SE, Lu Y, Hines LM, Koundinya M, LaBaer J, Muth-
uswamy SK, Brugge JS: Cooperation of the ErbB2 receptor and
transforming growth factor beta in induction of migration
and invasion in mammary epithelial cells. Proceedings of the
National Academy of Sciences of the United States of America 2004,
101:1257-1262.
49. Prevot V, Cornea A, Mungenast A, Smiley G, Ojeda SR: Activation
of erbB-1 signaling in tanycytes of the median eminence
stimulates transforming growth factor beta1 release via
prostaglandin E2 production and induces cell plasticity. Jour-
nal of Neuroscience 2003, 23:10622-10632.
50. Held-Feindt J, Lutjohann B, Ungefroren H, Mehdorn HM, Mentlein R:
Interaction of transforming growth factor-beta (TGF-beta)
and epidermal growth factor (EGF) in human glioma cells.
Journal of Neuro-Oncology 2003, 63:117-127.