báo cáo hóa học:" Mass spectrometry-based serum proteome pattern analysis in molecular diagnostics of early stage breast cancer" pdf
Bạn đang xem bản rút gọn của tài liệu. Xem và tải ngay bản đầy đủ của tài liệu tại đây (795.12 KB, 13 trang )
BioMed Central
Page 1 of 13
(page number not for citation purposes)
Journal of Translational Medicine
Open Access
Research
Mass spectrometry-based serum proteome pattern analysis in
molecular diagnostics of early stage breast cancer
Monika Pietrowska
†1
, Lukasz Marczak
†2
, Joanna Polanska
†3
,
Katarzyna Behrendt
1
, Elzbieta Nowicka
1
, Anna Walaszczyk
1
,
Aleksandra Chmura
1
, Regina Deja
1
, Maciej Stobiecki
2
, Andrzej Polanski
3,4
,
Rafal Tarnawski
1
and Piotr Widlak*
1
Address:
1
Maria Skłodowska-Curie Memorial Cancer Center and Institute of Oncology, Gliwice, Poland,
2
Polish Academy of Science, Institute of
Bioorganic Chemistry, Poznan, Poland,
3
Silesian University of Technology, Gliwice, Poland and
4
Polish-Japanese Institute of Information
Technology, Bytom, Poland
Email: Monika Pietrowska - ; Lukasz Marczak - ;
Joanna Polanska - ; Katarzyna Behrendt - ; Elzbieta Nowicka - ;
Anna Walaszczyk - ; Aleksandra Chmura - ; Regina Deja - ;
Maciej Stobiecki - ; Andrzej Polanski - ; Rafal Tarnawski - ;
Piotr Widlak* -
* Corresponding author †Equal contributors
Abstract
Background: Mass spectrometric analysis of the blood proteome is an emerging method of
clinical proteomics. The approach exploiting multi-protein/peptide sets (fingerprints) detected by
mass spectrometry that reflect overall features of a specimen's proteome, termed proteome
pattern analysis, have been already shown in several studies to have applicability in cancer
diagnostics. We aimed to identify serum proteome patterns specific for early stage breast cancer
patients using MALDI-ToF mass spectrometry.
Methods: Blood samples were collected before the start of therapy in a group of 92 patients
diagnosed at stages I and II of the disease, and in a group of age-matched healthy controls (104
women). Serum specimens were purified and the low-molecular-weight proteome fraction was
examined using MALDI-ToF mass spectrometry after removal of albumin and other high-
molecular-weight serum proteins. Protein ions registered in a mass range between 2,000 and
10,000 Da were analyzed using a new bioinformatic tool created in our group, which included
modeling spectra as a sum of Gaussian bell-shaped curves.
Results: We have identified features of serum proteome patterns that were significantly different
between blood samples of healthy individuals and early stage breast cancer patients. The classifier
built of three spectral components that differentiated controls and cancer patients had 83%
sensitivity and 85% specificity. Spectral components (i.e., protein ions) that were the most frequent
in such classifiers had approximate m/z values of 2303, 2866 and 3579 Da (a biomarker built from
these three components showed 88% sensitivity and 78% specificity). Of note, we did not find a
significant correlation between features of serum proteome patterns and established prognostic or
predictive factors like tumor size, nodal involvement, histopathological grade, estrogen and
progesterone receptor expression. In addition, we observed a significantly (p = 0.0003) increased
Published: 13 July 2009
Journal of Translational Medicine 2009, 7:60 doi:10.1186/1479-5876-7-60
Received: 21 April 2009
Accepted: 13 July 2009
This article is available from: />© 2009 Pietrowska et al; licensee BioMed Central Ltd.
This is an Open Access article distributed under the terms of the Creative Commons Attribution License ( />),
which permits unrestricted use, distribution, and reproduction in any medium, provided the original work is properly cited.
Journal of Translational Medicine 2009, 7:60 />Page 2 of 13
(page number not for citation purposes)
level of osteopontin in blood of the group of cancer patients studied (however, the plasma level of
osteopontin classified cancer samples with 88% sensitivity but only 28% specificity).
Conclusion: MALDI-ToF spectrometry of serum has an obvious potential to differentiate samples
between early breast cancer patients and healthy controls. Importantly, a classifier built on MS-
based serum proteome patterns outperforms available protein biomarkers analyzed in blood by
immunoassays.
Background
In recent years cancer diagnostics has been taking enor-
mous advantage of genomics and proteomics, novel fields
of modern biology. Proteomics is the study of the pro-
teome, the complete protein components of the cell, tis-
sue or organism, which in contrast to the genome is
dynamic and fluctuates depending on a combination of
numerous internal and external factors (e.g., physiologi-
cal status, dietary behavior, stress, disease and medical
treatment). Identifying and understanding changes in the
proteome related to disease development and therapy
progression is the subject of clinical/disease proteomics
[1,2]. It is currently well appreciated that because of the
complexity of molecular processes involved in cancer no
particular molecular feature alone, neither gene nor pro-
tein, could be a reliable biomarker in cancer diagnosis.
Instead, multi-component molecular classifiers, exempli-
fied by multi-gene cancer signatures implemented in the
functional genomics field, are built and successfully
applied. Multi-gene signatures identified for breast cancer
have proved their diagnostic power even though detailed
knowledge about the function of particular genes that
build such signatures may not be available at present
[3,4].
The low molecular weight (<10 kDa) component of the
blood proteome is a promising source of previously
undiscovered biomarkers. Since this protein fraction is
below the limit of effective resolution of conventional gel
electrophoresis, mass spectrometric analysis appears to be
a method of choice [5], and consequently is an emerging
method of clinical proteomics and cancer diagnostics [rev.
in: [6-9]]. The milestone paper in this field was published
in 2002 by the group of Petricoin and Liotta, who showed
that components of the serum proteome identified by
mass spectrometry differentiate patients with ovarian can-
cer from healthy individuals [10]. Since that time, in spite
of a certain controversy regarding this pioneering work
[11], numerous papers have been published that aimed to
verify the applicability of mass spectrometric analyses of
the serum (or plasma) proteome for cancer diagnostics.
Although no single peptide could be expected to be a reli-
able bio-marker in such analyses, multi-peptide sets of
markers selected in numerical tests have been shown
already in a few studies to have potential prognostic and
predictive values for cancer diagnostics [rev. in: [12-16]].
The approach that takes into consideration features of the
whole proteome, e.g. protein fingerprints given by mass
spectra or 2D gel electrophoresis but does not rely on par-
ticular identified protein(s), could be called proteome
pattern analysis or proteome profiling. In this approach,
whose strategy is similar to the search for multi-gene sig-
natures in functional genomics, multi-component sets of
peptides/proteins (which are exemplified by ions regis-
tered at defined m/z values in the mass spectrum) define
specific proteomic patterns (or profiles), allowing one to
classify samples even though their particular components
lack differentiating power when analyzed separately.
Importantly, such pattern/profile reflects features of the
specimen's proteome and allows its classification even
without detailed knowledge about particular elements
[17-19]. Mass spectrometry methods particularly suitable
for proteome pattern analysis are Matrix-Assisted Laser
Desorption-Ionization spectrometry (MALDI) and its
derivative Surface-Enhanced Laser Desorption/Ionization
spectrometry (SELDI) coupled to a Time-of-Flight (ToF)
analyzer, which combine high throughput, fair sensitivity
and accuracy of annotation of m/z values of ions in
recorded mass spectra of complex protein mixtures such
as biological specimens [20,21]. The relevance of mass
spectrometry-based serum (or plasma) proteome pattern
analysis has been already tested for several type of human
malignancies though none of identified peptide signa-
tures was approved for diagnostics in clinical practice, as
yet [15,22-26].
Breast cancer is the most common malignancy in women,
comprising about 18% of all female cancers, and 1 mil-
lion new cases occur worldwide each year. In Western
countries the disease is the single commonest cause of
death among women aged 40–50, accounting for about a
fifth of all deaths in this age group [27]. The most impor-
tant tools in screening and early detection of breast cancer
are imaging techniques: mammography, ultrasonography
and magnetic resonance imaging. Unfortunately however,
up to 20% of new breast cancer incidents cannot be
detected by these methods [28], indicating a constant
need for novel molecular markers suitable for screening
and early detection of this cancer. Several studies have
already addressed the possibility of applying SELDI or
MALDI mass spectrometric analyses of blood proteome in
diagnostics of breast cancer, and elicited serum (or
Journal of Translational Medicine 2009, 7:60 />Page 3 of 13
(page number not for citation purposes)
plasma) proteome patterns specific for patients with
breast cancer at either early or late clinical stages [29-38].
Among the peptides identified in such differentiating pat-
terns were fragments of C3a [33] and of FPA, fibrinogen,
C3f, C4a, ITIH4, apoA-IV, bradykinin, factor XIIIa and
transthyrein [35]. In addition, mass spectrometry analyses
of the blood proteome allowed the identification of pat-
terns specific for breast cancer patients with different out-
come and response to therapy [39-43]. Different
methodological approaches, both experimental and com-
putational, have been implemented in such studies, and
the proposed proteome patterns specific for breast cancer
consisted of different peptide sets. However, several pep-
tides that differentiated cancer and control samples
appeared reproducibly when comparative analysis across
different studies was performed [44], demonstrating the
high potential of mass spectrometry-based analyses of the
blood proteome pattern in diagnostics of breast cancer
once problems with standardization of experimental and
computational design are solved.
Here we examined the potential applicability of the serum
proteome pattern identified by MALDI-ToF mass spec-
trometry, either alone or in combination with protein
biomarkers analyzed by immunoassays, in early detection
of breast cancer. The spectral components that were anno-
tated on the basis of recorded mass spectra were success-
fully used to build classifiers that allowed reliable
identification of early stage breast cancer patients. Impor-
tantly, the classifier based on serum proteome pattern
outperformed available biomarkers analyzed in blood by
immunoassays.
Methods
Characteristics of patient and control groups
The clinical part of the study was carried out at the Maria
Sklodowska-Curie Memorial Cancer Center and Institute
of Oncology, Gliwice Branch, between May 2006 and Jan-
uary 2008. Ninety-two patients diagnosed with clinical
stage I or II breast cancer were included in the study, of
average age 58.5 years (range 31–74 years). Patients were
classified according to the TNM scale; the majority were
scored as T1 and T2 (47% and 45%, respectively) as well
as N0 and N1 (75% and 24%, respectively), and none had
diagnosed metastases (all M0). Biopsy material was used
to assess for histopathological tumor grade (27% G1,
45% G2, 28% G3), as well as for expression of estrogen
receptor (63% ER+) and progesterone receptor (60% PR+)
by immunohistochemistry. Serum samples were collected
before the start of therapy. One hundred and four female
volunteers were included as a control group; they were
required to be free of any known acute or chronic illness
and were not treated with any anticancer therapy in the
past. The average age in this group was 54 years (range 32–
77 years). The study was approved by the appropriate Eth-
ics Committee and all participants provided informed
consent indicating their voluntary participation.
Preparation of serum samples
Samples were collected and processed following a stand-
ardized protocol. Blood was collected in a 5 ml Vacutainer
Tube (Becton Dickinson), incubated for 30 min. at room
temperature to allow clotting, and then centrifuged at
1000 g for 10 min. to remove the clot. The serum was aliq-
uoted and stored at -70°C. Directly before analysis, sam-
ples were diluted 1:5 with 20% acetonitrile (ACN) in
water, then applied onto an Amicon Ultra-4 membrane
(50 kDa cut-off) in a spin column and centrifuged at 3000
g for 30 min. This removed the majority (up to 80%) of
albumin and other abundant high-molecular weight pro-
teins from the serum samples (not shown).
Mass spectrometry
Samples were analyzed using an Autoflex MALDI-ToF
mass spectrometer (Bruker Daltonics, Bremen, Germany);
the analyzer worked in the linear mode and positive ions
were recorded in the mass range between 2,000–10,000
Da. Mass calibration was performed after every four sam-
ples using standards in the range of 5000 to 17,500 Da
(Protein Calibration Standard I, Bruker Daltonics). Prior
to analysis each sample was loaded onto a ZipTip C18 tip-
microcolumn by passing it through repeatedly 10 times,
column was washed with water and then eluted with 1 μl
of matrix solution (30 mg/ml sinapinic acid in 50% ACN/
H
2
O and 0.1% TFA with addition of 1 mM n-octyl glucop-
yranoside) directly onto the 600 μm AnchorChip (Bruker
Daltonics) plate. ZipTip extraction/loading was repeated
twice for each sample and for each spot on the plate two
spectra were acquired after 120 laser shots (i.e. four spec-
tra were recorded for each sample). Spectra were exported
from the Bruker FlexAnalysis 2.2 software in standard 8-
bit binary ASCII format; they consisted of approximately
45,400 measurement points describing mass to charge
ratios (m/z) for consecutive [M+H]
+
ions and the corre-
sponding signal abundances, covering the range of ana-
lyzed m/z values.
Analysis of protein tumor markers in plasma
Plasma samples were obtained after centrifugation of
blood on a Ficoll gradient (Lymphoprep™, ICN), and then
levels of selected markers were quantified using standard
methods of immuno-diagnostics. Enzyme-Linked Immu-
nosorbent Assay (ELISA) was used for assessment of leptin
(DRG Diagnostics) and osteopontin (R&D Systems),
Chemiluminescent Microparticle Immunoassay (CMIA)
for assessment of CEA (Abbott), Trace Resolved Amplified
Cryptate Emission (TRACE) for assessment of CYFRA 21.1
(Brahms), and Microparticle Enzyme Immunoassay
(MEIA) for assessment of CA15.3 (Abbott). In addition,
the level of osteopontin was analyzed in serum samples as
described above.
Journal of Translational Medicine 2009, 7:60 />Page 4 of 13
(page number not for citation purposes)
Data Processing and Statistical Analysis
The preprocessing of data that included averaging of tech-
nical repeats, interpolation of missing or non-aligned
points, binning of neighboring points to reduce data com-
plexity, removal of the spectral area below baseline and
the total ion current (TIC) normalization was performed
according to procedures considering to be standard in the
field [45,46]. In the second step the spectral components,
which reflected [M+H]
+
ions recorded at defined m/z val-
ues, were identified using decomposition of mass spectra
into their Gaussian components. The spectra were mod-
eled as a sum of Gaussian bell-shaped curves, then models
were fitted to the experimental data by a variant of the
expectation maximization (EM) algorithm [47]. In a few
cases when the standard deviation of a Gaussian exceeded
a value of 50 the corresponding spectral component was
excluded from further more detailed analyses. Based on
the decomposition of the average mass spectrum into the
Gaussian components, the classifier features were com-
puted by the scalar product with the Gaussian curves
treated as kernel functions. The classification used version
of the Support Vector Machine (SVM) algorithm
described by Schölkopf and coworkers [48]. The size of
the training sample was changed from 20% to 90% of the
whole dataset, and for each size the two-step training/val-
idation procedure was repeated 1000 times to estimate
the average error rate and its 95% confidence interval,
which characterized the accuracy of classification. In order
to further characterize the quality of classification, receiver
operating curves (ROC) were computed by changing the
value of the classification threshold in the SVM classifiers,
and averaging the obtained specificity/sensitivity propor-
tions over 1000 random validation experiments. We
tested the performance of classification with classifiers
built of different numbers of spectral components by esti-
mating the level of total errors, as well the number of false
positive and false negative classifications. Construction
and validation of a classifier is a statistical process, i.e.
many different classifiers built of a given number of spec-
tral components were tested (1000 random splits of the
dataset), and those which pass the quality threshold could
be built of different spectral components. Thus, to identify
the components that are the best determinants of a spe-
cific proteome pattern we looked for the most frequent
components in classifiers that correctly classified samples.
The performance of classifiers built of optimized compo-
nents was assessed by standard logistic regression (1000
iterations with a 50/50 split of the training/validation
set).
Results and discussion
Classifiers built on spectral components that determine
proteome patterns
The low-molecular-weight fraction of the blood serum
proteome consists of numerous peptides, proteins and
their fragments. Some of these interact with each other,
and a substantial fraction of this blood proteome com-
partment is carried by albumin as cargo peptides [49,50].
For this reason we implemented dilution of serum sam-
ples with a denaturing organic solvent (acetonitrile) that
destroyed the majority of protein interactions and
allowed analysis of individual peptides dissociated from
(not interacting with) other proteins (e.g., albumin).
Characteristic features of MALDI ionization are that most
ions created during laser irradiation are singly charged
(multiply charged ions, especially those with low m/z val-
ues, have very low abundances and can be are neglected),
and that these ions are not fragmented under the ioniza-
tion conditions applied. In other words, peaks registered
in a MALDI mass spectrum correspond to mono-proto-
nated peptide/protein molecular ions [M+H]
+
described
by m/z values that reflect actual molecular weights
increased by the mass of the proton. However, when
MALDI mass spectra are recorded over a wide range of m/
z values (like the 2–10 kDa range in this study) the
expected mass accuracy is relatively low and reaches 0.01–
0.1% of the analyte's molecular mass, which corresponds
to a few Daltons in the range of m/z values analyzed. In
consequence, the relative broadening of spectral peaks
recorded for the [M+H]
+
ions could reflect the low resolu-
tion of the analyzer operating in the linear mode or might
result in overlapping of ions originating from protein/
peptides of very similar molecular masses. In addition,
because of technological imperfections there might be
some shift in the positions of peptide ions between meas-
urements, which adds more complexity to analyses of
large datasets. For this reason, some approaches used for
analysis of large datasets relay on alignment of identified
spectral peaks [45], which requires numerical "stretching"
of spectra before further analyses.
Here we decided to implement an original mathematical
procedure based on modeling average spectra and then
fitting actual experimental spectra into such a model.
Averaging was performed over either the whole dataset or
data for cancer patients only, depending on whether the
model was used to discriminate cancer and normal sam-
ples or different clinical outcomes of patients. We tested
models with different numbers of components, and
found that for the mass spectra analyzed in the present
work 300 components ensured both sufficient fidelity of
the model and its efficient computation (not shown). As
a result of computation an "average" spectrum was
decomposed into spectral components characterized by
the exact molecular weight (m/z values of recorded
[M+H]
+
ions) and the interval where fit corresponding
peaks in at least 95% of actual spectra expected in the
dataset (+/-95% CI). The resulting spectral components
reflect peaks recorded in multiple samples during mass
spectrometric analysis, which contained either single pep-
tide/protein ions or a combination of a few ions of very
similar m/z values. This approach allowed us to avoid arti-
Journal of Translational Medicine 2009, 7:60 />Page 5 of 13
(page number not for citation purposes)
facts resulting from the peak alignment and facilitated
quantitative analysis of data by simple assessment of sig-
nal volumes that fitted to a given component within its
95% CI. Having identified and quantified spectral compo-
nents, one could find certain whose abundances were sig-
nificantly different between groups of samples (e.g.
between cancer patient and healthy samples) which could
be defined as "differentiating". However, to obtain more
reliable classification of samples we used spectral compo-
nents to build multi-component classifiers that deter-
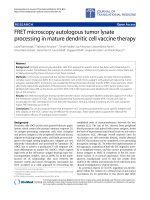
Characterization of spectral components essential for cancer classificationFigure 2
Characterization of spectral components essential
for cancer classification. A – The three most frequent dif-
ferentiating components are marked with arrows along the
mass spectra of serum samples of cancer patients (red lines)
and healthy controls (green lines). B – Actual spectral plots
of three selected components for cancer patients (red lines)
and healthy controls (green lines), as well as modeled Gaus-
sian kernels (blue curves); X-axes represent the m/z values,
Y-axes represent intensities. Box-plots on the right repre-
sent quantification of the abundance of spectral components
in samples from cancer patients (red) and healthy controls
(green) (shown are minimum, lower quartile, median, upper
quartile and maximum values; outliers are marked by aster-
isks).
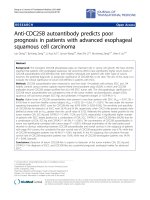
Estimation of the performance of classification of breast can-cer samplesFigure 1
Estimation of the performance of classification of
breast cancer samples. A – The total error rate was plot-
ted against the number of features (i.e. spectral components)
in the classifier. Shown are average error rates and 95% con-
fidence intervals calculated based on 1000 random validation
experiments with 50:50 training/validation split of data. B –
Estimation of the sensitivity and specificity of the classifica-
tion for classifiers built of three or four spectral components.
The ROC curve was computed by changing the value of the
probability threshold in the SVM classifier from 0.0 to 1.0,
and averaging the specificity obtained versus sensitivity rate
over 1000 random repeats of training and validation.
Journal of Translational Medicine 2009, 7:60 />Page 6 of 13
(page number not for citation purposes)
mined proteome patterns characteristic for groups, and
looked for the most frequent components in classifiers
that classified samples correctly.
Identification of components that determine proteome
patterns specific for healthy persons and breast cancer
patients
At first we compared the serum proteome patterns of 104
healthy women and 92 early stage breast cancer patients.
Spectral components corresponding to protein/peptide
[M+H]
+
ions recorded in MALDI mass spectra were used to
built classifiers to perform cancer/healthy control classifi-
cations as described above. The best classification per-
formance was obtained with classifiers built of 2–5
features, i.e. spectral components (Fig. 1A). To estimate
the sensitivity and specificity of classification, ROC curves
[51] were computed for classifiers built of 3 or 4 spectral
components. According to our estimations these classifi-
ers allowed classification of cancer patients with 85% spe-
cificity and 82–83% sensitivity (Fig. 1B).
In further analyses we looked for the most frequent spec-
tral components in classifiers that correctly classified
breast cancer samples. The three most important compo-
nents corresponded to the following [M+H]
+
peptide ions:
m/z = 2865.54, m/z = 3578.73, and m/z = 2303.48 (Fig.
2A). Most interestingly, two of these (m/z = 2865.54 and
m/z = 3578.73) were present in nearly all well-performing
classifiers, while the third (m/z = 2303.48) was present in
78% of classifiers; it was noteworthy that all other spectral
components appeared in classifiers less frequently (<50%;
Table 1). Importantly, these most frequent components of
cancer classifiers had very high potency to differentiate
control and cancer samples by themselves; the statistical
significance of differences obtained in univariant analyses
for these three peaks were at the level of p-values from 10
-
Table 1: Characteristics of spectral components that differentiated samples from breast cancer patients and healthy controls.
Component
m/z value
-95% CI + 95% CI S.D. p-value Corrected
p-value
Frequency Change
2294.67 2283.38 2305.96 5.76 1.28e-12 3.84e-10 46% D
2303,48 2296,88 2310,09 3,37 6.25e-14 1.88e-11 78% D
2554.37 2540.32 2568.41 7.16 4.13e-07 1.24e-04 1% U
2845.58 2838.34 2852.81 3.69 3.59e-12 1.08e-09 21% D
2865.54 2864.46 2866.62 7.73 4.19e-20 1.26e-17 100% D
3283.73 3265.34 3302.13 9.39 6.60e-07 1.98e-04 1% U
3360.19 3352.06 3368.31 4.15 5.69e-11 1.71e-08 22% D
3427.46 3401.71 3453.21 13.14 8.11e-11 2.43e-08 7% D
3578.73 3577.42 3580.04 9.36 5.84e-18 1.75e-15 99% D
3874.18 3863.89 3884.47 5.25 8.08e-09 2.42e-06 3% D
3895.05 3882.03 3908.06 6.64 1.58e-11 4.74e-09 6% D
4965.77 4945.35 4986.19 10.42 1.91e-08 5.73e-06 5% D
6061.80 6050.15 6073.45 5.94 9.53e-09 2.86e-06 5% D
6743.99 6734.13 6753.85 5.03 2.99e-08 8.97e-06 2% D
Shown are the most frequent spectral components (m/z values), their 95% confidence intervals, standard deviations of the corresponding model
Gaussians, and relative frequencies in cancer classifiers built of 4 features. The p-values are for differences between patients and healthy controls
measured by the Mann-Whitney U test for each individual component (also shown after the Bonferroni correction against multiple testing). The
change refers to either increased (U) or decreased (D) abundance of a given peptide in cancer samples compared to control samples. The three
most frequent components are underlined.
Journal of Translational Medicine 2009, 7:60 />Page 7 of 13
(page number not for citation purposes)
20
to 10
-14
(they remained highly significant after applica-
tion of the Bonferroni correction for multiple testing;
Table 1). Fig. 2B shows fragments of mass spectra in the
near vicinity of the components that were the most fre-
quent features of these breast cancer classifiers; the actual
spectral lines for samples from all 196 individuals are
shown together with the model component. The levels of
such components in samples from individual breast can-
cer patients and healthy controls were quantified and are
shown as box-plots (Fig. 2B).
We also found that 49 out of 300 modeled spectral com-
ponents (i.e., 16%) had themselves a high potential to dif-
ferentiate control and cancer samples in univariant
analyses (p-value < 0,05 after the Bonferroni correction).
Furthermore, all 14 spectral components that appeared in
at least 1% of classifiers built of 4 features retained a very
high differentiation potential in univariant analyses (p-
value < 0.0002 after the Bonferroni correction; Table 1).
In addition, we cross-compared spectral components that
showed some differentiating power in our study (90 spec-
tral components with uncorrected p-value < 0.005) with
spectral peaks that were reported in some other published
studies to differentiate breast cancer from healthy control
samples (uncorrected p-value < 0.005). The correspond-
ence of [M+H]
+
ions was based on ± 0.2% of the m/z val-
ues. We found that at least 15 of these spectral
components had a corresponding differentiating peak in
comparable studies (although not always showing the
same tendency; Table 2). This reproducibility, observed in
Table 2: Comparison of discriminating spectral components/peptide peaks found in this study and in other published work.
This study Other studies
m/z value p-value Change m/z value p-value Change Ref. Study design Identity
2303.48 6.25e-14 D 2306.20 1.09e-06 U 35 MALDI/serum/A C4a
2356.91 2.47e-04 D 2359.09 4.07e-12 U 35 MALDI/serum/A ITIH4
2378.80 8.91e-06 D 2380.03 1.26e-07 U 35 MALDI/serum/A Fibrinogen
2510.80 4.65e-08 D 2509.16 5.56e-13 U 35 MALDI/serum/A ApoA-IV
2599.75 6.03e-04 U 2603.15 2.08e-07 U 35 MALDI/serum/A Factor XIIIa
3020.51 5.49e-03 U 3017.85 1.50e-03 U 43 SELDI/NAF/M
3273.96 1.08e-03 U 3278.71 1.05e-05 D 42 SELDI/serum/M
3281.5 1.77e-04 U 38 MALDI/serum/M
3283.73 6.80e-07 U 3284.74 3.00e-04 U 43 SELDI/NAF/M
3973.35 1.51e-06 D 3975.99 3.06e-05 D 42 SELDI/serum/M
4648.09 3.48e-07 U 4648 4.13e-03 D 42 SELDI/serum/M
5105.44 4.66e-03 U 5101.8 4.90e-03 U 43 SELDI/NAF/M
6802.40 1.42e-03 D 6807.26 1.90e-03 D 42 SELDI/serum/M
8116.60 3.41e-04 D 8116 1.00e-06 U 29,33 SELDI/serum/M C3a
8134.75 9.61e-04 D 8138.56 7.89e-07 U 42 SELDI/serum/M
8656.46 2.73e-04 U 8657.2 1.00e-03 U 37 SELDI/Serum/E
Uncorrected p-values are based on Mann-Whitney U tests in this study. Correspondence of peptide peaks is based on a difference of less than ±
0.2% of the m/z values of [M+H]
+
ions. The column "Change" refers to an increased (U) or decreased (D) abundance of a given peptide in breast
cancer samples comparing to control samples, and the column "Identity" shows the protein from which the corresponding fragment is derived.
Corresponding peptide peaks were found in six studies based on either MALDI or SELDI spectrometry; patient groups consisted of either early (E),
advanced (A) or mixed (M) stages. One study analyzed the nipple aspirate fluid (NAF).
Journal of Translational Medicine 2009, 7:60 />Page 8 of 13
(page number not for citation purposes)
spite of large differences in experimental and computa-
tional design, indicates a potency of convergence toward
a common proteome pattern specific for breast cancer
samples. Interestingly, two spectral components that
appeared the most important for cancer classification in
our study (i.e., m/z = 2865.54 and m/z = 3578.73) were
not reported as differentiating peaks in other studies. We
note, however, that in our study serum was analyzed after
removal of albumin and components bound to it, which
apparently influenced the pattern of mass spectra of the
low-molecular-weight fraction of the blood proteome. We
observed markedly increased levels of some spectral com-
ponents in albumin-depleted samples as compared to
those analyzed directly (not shown), which could possi-
bly be explained by a reduced efficiency of ionization and
detection of certain less abundant peptides in the presence
of albumin [49].
Serum proteome patterns identified by MALDI-ToF
analyses are similar for different sub-groups of early stage
breast cancer patients
Having established that MALDI-ToF analysis of serum
peptides identified proteome patterns characteristic for
cancer patients, we next examined whether features of
peptide profiles would differentiate specific subgroups of
patients. First, the group of patients was divided into two
equal subgroups according to their age (younger or older
then 56.5 years, which was the median), and then spectral
classifiers were built according to the methodology
described above. In this particular case the performance of
classification was about 50% independently of the
number of spectral components (features) in classifiers
(Fig. 3A), and consequently the classifier had about 50%
specificity and 50% sensitivity as shown on the corre-
sponding ROC curve (Fig. 3B). This indicated that there
was no real difference in serum proteome patterns
between subgroups of patients divided according to their
age. This result could be expected because in the whole
group there was only 1 patient younger then 35 years
which is normally considered an early appearance of can-
cer, and thus our two age-related subgroups most possibly
reflect a random division of the group. Having this "nega-
tive control" classification, we next aimed to identify
serum proteome patterns specific for subgroups of
patients with different clinical and molecular outcomes.
We compared patients with different primary tumor size
(T1 vs. T2), lymph node status (N0 vs. N1), histopatho-
logical grade (G1 and G2 vs. poorly differentiated G3),
and also two well-established breast cancer prognostic
and predictive molecular markers, expression of estrogen
receptor or progesterone receptor [rev. in: [52-54]]. For
each comparison the performance of classification (total
error of classifiers built of 1 to 20 features) and the corre-
sponding ROC curves for classifiers built of 15 spectral
components (these were representative of ROC curves
Estimation of differences of serum proteome patterns between sub-groups of breast cancers patientsFigure 3
Estimation of differences of serum proteome pat-
terns between sub-groups of breast cancers patients.
Patients were differentiated by age, primary tumor size (T),
lymph nodal status (N), histopathological grade (G), and
estrogen (ER) and progesterone (PR) receptor expression. A
– The total error rates of classification plotted against the
number of features in the classifiers as in Fig. 1A; the actual
line width corresponded to 95% confidence intervals. B –
ROC curves computed for classifiers built of 15 spectral
components for each comparison (computation was done as
described in Fig. 1B).
Journal of Translational Medicine 2009, 7:60 />Page 9 of 13
(page number not for citation purposes)
Table 3: Comparison of serum proteome patterns among different sub-groups of breast cancer patients.
Component
m/z value
S.D. p-value Frequency [%]
Age (median = 56.5 years) >median (n = 42) vs. <median (n = 42)
5353.64 11.54 0.020 48.4
2475.96 2.37 0.029 19.9
4098.35 25.90 0.032 22.5
3024.45 11.71 0.035 20.2
4070.43 5.58 0.048 19.2
T – primary tumor size T1 (n = 44)vs. T2 (n = 40)
5353.64 11.54 0.033 21.9
2873.93 7.13 0.038 20.5
5343.98 6.26 0.051 15.8
3024.45 11.71 0.073 32.8
3249.64 5.24 0.075 12.4
N – nodal status N0 (n = 63)vs. N1 (n = 20)
8618.25 10.83 0.024 45.1
8602.25 29.35 0.036 29.5
2909.04 10.58 0.038 32.5
8607.98 5.60 0.040 25.7
8682.92 8.83 0.047 28.2
G – histopathological grade G1+G2 (n = 54)vs. G3 (n = 20)
2937.50 6.76 0.004 34.1
2556.63 8.07 0.007 44.1
2909.04 10.58 0.011 36.8
7547.58 12.44 0.022 37.7
4793.63 5.91 0.026 8.1
ER – estrogen receptor status ER(-) (n = 29) vs. ER(+) (n = 51)
7915.93 29.15 0.038 42.4
6302.67 4.03 0.039 23.6
8246.58 14.13 0.043 27.5
Journal of Translational Medicine 2009, 7:60 />Page 10 of 13
(page number not for citation purposes)
Table 4: Levels of tumor markers in plasma of breast cancer patients and healthy controls.
Group n Median Mean S.D. Lower-upper quartile p-value
CEA (ng/ml)
healthy controls 58 1.13 1.62 1.46 0.84 – 1.75 0.04
cancer patients 37 1.54 2.45 3.11 1.00 – 2.11
CA15-3 (U/ml)
healthy controls 58 12.3 13.28 5.45 9.5 – 16.4 0.63
cancer patients 37 14.0 13.74 5.79 8.3 – 18.5
CYFRA 21.1 (ng/ml)
healthy controls 58 0.41 0.53 0.48 0.24 – 0.60 0.06
cancer patients 37 0.54 0.63 0.44 0.35 – 0.75
Leptin (ng/ml)
healthy controls 58 27.70 33.51 23.01 17.80 – 41.80 0.05
cancer patients 37 23.01 24.19 16.09 10.02 – 31.11
Osteopontin (ng/ml)
healthy controls 50 45.90 47.13 11.9 38.70 – 52.20 0.0003
cancer patients 73 54.73 59.47 15.37 47.13 – 66.98
Shown are median, mean and S.D. values, as well as lower and upper quartiles. The p-values are for differences between patients and healthy
controls measured by the Kruskal-Wallis test.
2599.96 3.93 0.044 28.9
3367.65 13.43 0.061 22.4
PR – progesterone receptor status ER(-) (n = 32) vs. ER(+) (n = 49)
7101.57 8.39 0.002 50.7
9965.62 16.77 0.014 37.3
7750.49 24.72 0.015 30.6
3367.65 13.43 0.018 30.5
9934.38 23.21 0.020 28.3
The five spectral components with the lowest p-values were selected for each comparison. Shown are spectral components (m/z values), S.Ds. of
the corresponding model Gaussians, and their relative frequencies in classifiers. The p-values (uncorrected) are for differences measured by the
Mann-Whitney U test for each individual component.
Table 3: Comparison of serum proteome patterns among different sub-groups of breast cancer patients. (Continued)
Journal of Translational Medicine 2009, 7:60 />Page 11 of 13
(page number not for citation purposes)
computed for classifiers built of 1 to 20 features) are
shown in Fig. 3. Most importantly, we observed a low per-
formance of putative classification with a high level of
errors for all analyses carried out. Although analyses based
on the nodal status and the histopathological grade
showed relatively moderate levels of total error (Fig. 3A),
they had a very high level of false negative classifications
(not shown) which was related to the unbalanced number
of subgroups compared (see Table 3); the shape of the cor-
responding ROC curves also reflect this unbalance
(Fig. 3B).
The spectral components identified by Gaussian model
decomposition were also used for univariant analyses of
differences between the subgroups described above. Table
3 presents examples of the top five spectral components
with the lowest p-values identified for each of such com-
parisons. Most importantly, although in standard analy-
ses the levels of some components were different between
the subgroups compared, none of these differences
appeared significant after application of the Bonferroni
test for multiple testing correction (not shown). This
result was in complete agreement with results of classifica-
tion by multi-component classifiers (Fig. 3), which clearly
showed similar serum proteome patterns identified by
MALDI-ToF analyses in different sub-groups of the early
stage breast cancer group. This finding suggested that the
multi-component cancer classifier described above might
be potentially applicable for early detection of breast can-
cer, independent of further more detailed clinical and
pathological features.
A classifier built on MS-based serum proteome pattern
outperforms available protein biomarkers analyzed in
blood by immunoassays
To further assess potential diagnostic power of multi-com-
ponent classifier described above we compared reliability
of classification based on biomarker identified by mass
spectrometry with the one that based on available protein
biomarkers analyzed in blood by immunoassays. Five
markers were selected: carcinoembryonic antigen (CEA),
carbohydrate antigen CA15.3, cytokeratin fragment
CYFRA-21.1, leptin and osteopontin, which had putative
diagnostic value for breast cancer, especially at advanced
clinical stages, yet none of them was routinely used for
early diagnostics of breast cancer [55-60]. The plasma lev-
els of these biomarkers were quantified in a group of early
stage breast cancer patients (which largely overlapped
with the group examined using MALDI-ToF mass spec-
trometry) and compared with corresponding levels in a
group of healthy donors (Table 4). We observed that the
level of osteopontin was markedly increased in plasma of
cancer patients, and the difference had a high level of sta-
tistical significance (p = 0.0003). The differences were
much less significant for the four other markers, and
therefore osteopontin alone was used in further analyses.
The anti-osteopontin antibody used for ELISA recognized
all four isoforms (OPN-a, OPN-b, OPN-c, OPN-d) and
their different proteolytic fragments present in blood, and
thus direct correlation of the ELISA results with MALDI-
ToF analyses was not possible. When the plasma level of
osteopontin was used for cancer classification it showed
88% sensitivity but only 28% specificity (as tested by the
standard logistic regression method).
With the aim of constructing a putative marker useful in
early diagnosis of breast cancer, we decided to combine
features of the serum proteome pattern identified by
MALDI-ToF MS analysis and the level of osteopontin
measured by ELISA. Three spectral components, m/z =
2865.54, m/z = 3578.73, and m/z = 2303.48 Da, which
were the most frequent components of the cancer classi-
fier described above, were selected for these analyses. The
marker built of this three spectral components showed
78% specificity and 88% sensitivity when tested by the
standard logistic regression method. Then, the level of
osteopontin was re-tested in serum samples from the can-
cer patients and healthy individuals subjected to the MS-
based study. In this case, however, the average concentra-
tion of osteopontin in serum was about two-fold lower as
compared to that in plasma, and the difference between
cancer patients and healthy persons was much less pro-
nounced. The biomarker built of the serum level of oste-
opontin alone showed 84% specificity and but only 12%
sensitivity when tested by the standard logistic regression
method. Finally we tested the performance of a marker
built of four features, the three most frequent spectral
components (m/z = 2303.48, 2865.54, and 3578,73) and
osteopontin. This combined marker showed 78% specifi-
city and 88% sensitivity, the same as the marker built of
three spectral peaks alone.
Conclusion
Here we confirmed the high potential of serum proteome
pattern analysis by MALDI-ToF spectrometry for the dif-
ferentiation between early breast cancer patients and
healthy controls. Most importantly, a classifier built on
this analysis outperforms those based on available protein
biomarkers analyzed by immunoassays in blood. How-
ever, further combination of MS-based serum proteome
pattern analysis with traditional cancer markers might
possibly result in a biomarker with a reliability high
enough for practical implementation in the early detec-
tion and diagnostics of breast cancer.
Competing interests
The authors declare that they have no competing interests.
Authors' contributions
MP – performed experiments, interpreted results, LM –
performed experiments, interpreted results, JP – per-
formed mathematical modeling and statistical analyses,
Journal of Translational Medicine 2009, 7:60 />Page 12 of 13
(page number not for citation purposes)
KB – collected and interpreted clinical data, EN – collected
and interpreted clinical data, AW – performed experi-
ments, AC – performed immunoassyas, RD – performed
immunoassays, MS – designed and interpreted MS data,
drafted manuscript, AP – designed mathematical mode-
ling, drafted manuscript, RT – designed and interpreted
clinical part of the study, drafted manuscript, PW –
designed and interpreted experiment, prepared final man-
uscript. All authors read and approved the final manu-
script.
Acknowledgements
We thank Prof. Ronald Hancock for help in preparation of the manuscript.
This work was supported by the Polish Ministry of Science and Higher Edu-
cation, grant 2 P05E 067 30.
References
1. Hanash S: Disease proteomics. Nature 2003, 422:226-232.
2. Wulfkuhle JD, Liotta LA, Petricoin EF: Proteomic applications for
the early detection of cancer. Nat Rev Cancer 2003,
3(4):267-275.
3. van't Veer L, Dai H, Vijver M van de, He YD, Hart AAM, Mao M,
Peterse HL, Kooy K van der, Marton MJ, Witteveen AT, Schreiber GJ,
Kerkhoven RM, Roberts C, Linsley PS, Bernards R, Friend SH: Gene
expression profiling predicts clinical outcome of breast can-
cer. Nature 2002, 415:530-536.
4. Buyse M, Loi S, van't Veer L, Viale G, Delorenzi M, Glas AM,
Saghatchian d'Assignies M, Bergh L, Lidereau R, Ellis P, Harris A,
Bogaerts J, Therasse P, Floore A, Amakrane M, Piette F, Rutgers E,
Sotiriou C, Cardoso F, Piccard MJ: Validation and clinical utility
of a 70-gene prognostic signature for women with node-neg-
ative breast cancer. J Natl Cancer Inst. 2006, 98(17):1183-1192.
5. Aebersold R, Mann M: Mass spectrometry-based proteomics.
Nature 2003, 422:198-207.
6. Liotta LA, Ferrari M, Petricoin EF: Clinical proteomics: written in
blood. Nature 2003, 425:905.
7. Rosenblatt KP, Bryant-Greenwood P, Killian JK, Mehta A, Geho D,
Espina V, Petricoin EF, Liotta LA: Serum proteomics in cancer
diagnosis and management. Annu Rev Med 2004, 55:97-112.
8. Liotta LA, Petricoin EF: Serum peptidome for cancer detection:
spinning biological trash into diagnostic gold. J Clin Invest 2006,
116:26-30.
9. Rodland KD: Proteomics and cancer diagnosis: the potential
of mass spectrometry. Clin Biochem 2004, 37:579-583.
10. Petricoin EF, Ardekani AM, Hitt BA, Levine PJ, Fusaro VA, Steinberg
SM, Mills GB, Simone C, Fishman DA, Kohn EC, Liotta LA: Use of
proteomic patterns in serum to identify ovarian cancer. Lan-
cet 2002, 359:572-577.
11. Ransohoff DF: Lessons from controversy: ovarian cancer
screening and serum proteomics.
J Natl Cancer Inst 2005,
97:315-319.
12. Posadas EM, Simpkins F, Liotta LA, MacDonald C, Kohn EC: Pro-
teomic analysis for the early detection and rational treat-
ment of cancer-realistic hope? Ann Oncol 2005, 16:16-22.
13. Azad NS, Rasool N, Annunziata CM, Minasian L, Whiteley G, Kohn
EC: Proteomics in clinical trials and practice. Mol Cell Proteom-
ics 2006, 5:1819-1829.
14. Cho WCS: Contribution of oncoproteomics to cancer
biomarker discovery. Mol Cancer 2007, 6:25.
15. Conrads TP, Hood BL, Issaq HJ, Veenstra TD: Proteomic patterns
as a diagnostic tool for early-stage cancer: a review of its
progress to a clinically relevant tool. Mol Diagn 2004, 8:77-85.
16. Solassol J, Jacot W, Lhermitte L, Boulle N, Maudelonde T, Mangé A:
Clinical proteomics and mass spectrometry profiling for can-
cer detection. Expert Rev Proteomics 2006, 3:311-320.
17. Dworzanski JP, Snyder AP: Classification and identification of
bacteria using mass spectrometry-based proteomics. Expert
Rev Proteomics 2005, 2:863-878.
18. Somorjai RL: Pattern recognition approaches for classifying
proteomic mass spectra of biofluids. Methods Mol Biol 2008,
428:383-396.
19. Li L, Tang H, Wu Z, Gong J, Gruidl M, Zou J, Tockman M, Clark RA:
Data mining techniques for cancer detection using serum
proteomic profiling. Artif Intell Med 2004, 32:71-83.
20. Hutchens TW, Yip TT: New desorption strategies for the mass
spectrometric analysis of macromolecules. Rapid Commun
Mass Spectrom 1993, 7:576-80.
21. Petricoin EF, Liotta LA: SELDI-TOF-based serum proteomic
pattern diagnostics for early detection of cancer. Curr Opin
Biotech 2004, 15:24-30.
22. Yang SY, Xiao XY, Zhang WG, Zhang LJ, Zhang W, Zhou B, Chen G,
He DC: Application of serum SELDI proteomic patterns in
diagnosis of lung cancer. BMC Cancer 2005, 5:83.
23. Liu XP, Shen J, Li ZF, Yan L, Gu J: A serum proteomic pattern for
the detection of colorectal adenocarcinoma using surface
enhanced laser desorption and ionization mass spectrome-
try. Cancer Invest 2006, 24:747-753.
24. Lin YW, Lin CY, Lai HC, Chiou JY, Chang CC, Yu MH, Chu TY:
Plasma proteomic pattern as biomarkers for ovarian cancer.
Int J Gynecol Cancer 2006, 16(Suppl 1):139-146.
25. Lim JY, Cho JY, Paik YH, Chang YS, Kim HG: Diagnostic applica-
tion of serum proteomic patterns in gastric cancer patients
by ProteinChip surface-enhanced laser desorption/ioniza-
tion time-of-flight mass spectrometry. Int J Biol Markers 2007,
22:281-286.
26. Palmblad M, Tiss A, Cramer R: Mass spectrometry in clinical pro-
teomics – from the present to the future. Proteomics Clin Appl
2009, 3:6-17.
27. McPherson K, Steel CM, Dixon JM: Breast cancer – epidemiol-
ogy, risk factors, and genetics. BMJ 2000, 321:624-628.
28. Astley SM: Computer-based detection and prompting of
mammographic abnormalities. Br J Radiol 2004, 77:S194-S200.
29. Li J, Zhang Z, Rosenzweig J, Wang YY, Chan DW: Proteomics and
bioinformatics approaches for identification of serum
biomarkers to detect breast cancer. Clin Chem 2002,
48:1296-1304.
30. Laronga C, Becker S, Watson P, Gregory B, Cazares L, Lynch H, Perry
RR, Wright GL, Drake RR, Semmes OJ: SELDI-TOF serum profil-
ing for prognostic and diagnostic classification of breast can-
cers. Dis Markers 2003, 19:229-238.
31. Vlahou A, Laronga C, Wilson L, Gregory B, Fournier K, McGaughey
D, Perry RR, Wright GL, Semmes OJ: A novel approach toward
development of a rapid blood test for breast cancer. Clin
Breast Cancer 2003, 4:203-209.
32. Caputo E, Lombardi ML, Luongo V, Moharram R, Tornatore P, Pirozzi
G, Guardiola J, Martin BM: Peptide profiling in epithelial tumor
plasma by the emerging proteomic techniques. J Chromatogr
B Analyt Technol Biomed Life Sci 2005, 819(1):59-66.
33. Li J, Orlandi R, White CN, Rosenzweig J, Zhao J, Seregni E, Morelli D,
Yu Y, Meng X-Y, Zhang Z, Davidson NE, Fung ET, Chan DW: Inde-
pendent validation of candidate breast cancer serum
biomarkers identified by mass spectrometry. Clin Chem 2005,
51:2229-2235.
34. Mathelin C, Cromer A, Wendling C, Tomasetto C, Rio MC: Serum
biomarkers for detection of breast cancers: a prospective
study. Breast Cancer Res Treat 2006, 96:83-90.
35. Villanueva J, Shaffer DR, Philip J, Chaparro CA, Erdjument-Bromage
H, Olshen AB, Fleisher M, Lilja H, Brogi E, Boyd J, Sanchez-Carbayo
M, Holland EC, Cordon-Cardo C, Scher HI, Tempst P: Differential
exoprotease activities confer tumor-specific serum peptid-
ome patterns. J Clin Invest 2006, 116:271-284.
36. de Noo ME, Deelder A, Werff M van der, Özalp A, Mertens B, Tol-
lenaar R: MALDI-TOF serum protein profiling for the detec-
tion of breast cancer. Onkologie 2006, 29:501-506.
37. Belluco C, Petricoin EF, Mammano E, Facchiano F, Ross-Rucker S,
Nitti D, Di Maggio C, Liu C, Lise M, Liotta LA, Whiteley G: Serum
proteomic analysis identifies a highly sensitive and specific
discriminatory pattern in stage 1 breast cancer. Ann Surg
Oncol. 2007, 14(9):2470-2476.
38. Callesen AK, Vach W, Jørgensen PE, Cold S, Tan Q, dePont Chris-
tensen R, Mogensen O, Kruse TA, Jensen ON, Madsen JS: Com-
bined experimental and statistical strategy for mass
spectrometry based serum protein profiling for diagnosis of
breast cancer: a case-control study. J Proteome Res 2008,
7:1419-1426.
39. Pusztai L, Gregory BW, Baggerly KA, Peng B, Koomen J, Kuerer HM,
Esteva FJ, Symmans WF, Wagner P, Hortobagyi GN, Laronga C,
Publish with BioMed Central and every
scientist can read your work free of charge
"BioMed Central will be the most significant development for
disseminating the results of biomedical research in our lifetime."
Sir Paul Nurse, Cancer Research UK
Your research papers will be:
available free of charge to the entire biomedical community
peer reviewed and published immediately upon acceptance
cited in PubMed and archived on PubMed Central
yours — you keep the copyright
Submit your manuscript here:
/>BioMedcentral
Journal of Translational Medicine 2009, 7:60 />Page 13 of 13
(page number not for citation purposes)
Semmes OJ, Wright GL, Drake RR, Vlahou A: Pharmacopro-
teomic analysis of prechemotherapy and postchemotherapy
plasma samples from patients receiving neoadjuvant or adju-
vant chemotherapy for breast carcinoma. Cancer 2004,
100:1814-1822.
40. Goncalves A, Esterni B, Bertucci F, Sauvan R, Chabannon C, Cubi-
zolles M, Bardou VJ, Houvenaegel G, Jacquemier J, Granjeaud S, Meng
XY, Fung ET, Birnbaum D, Maraninchi D, Viens P, Borg JP: Postop-
erative serum proteomic profiles may predict metastatic
relapse in high-risk primary breast cancer patients receiving
adjuvant chemotherapy. Oncogene 2006, 25:981-989.
41. Heike Y, Hosokawa M, Osumi S, Fujii D, Aogi K, Takigawa N, Ida M,
Tajiri H, Eguchi K, Shiwa M, Wakatabe R, Arikuni H, Takaue Y,
Takashima S: Identification of serum proteins related to
adverse effects induced by docetaxel infusion from protein
expression profiles of serum using SELDI ProteinChip sys-
tem. Anticancer Res 2005, 25:1197-1203.
42. Becker S, Cazares LH, Watson P, Lynch H, Semmes OJ, Drake RR,
Laronga C: Surfaced-enhanced laser desorption/ionization
time-of-flight (SELDI-TOF) differentiation of serum protein
profiles of BRCA-1 and sporadic breast cancer. Ann Surg Oncol
2004, 11:907-914.
43. Pawlik TM, Fritsche H, Coombes KR, Xiao L, Krishnamurthy S, Hunt
KK, Pusztai L, Chen JN, Clarke CH, Arun B, Hung MC, Kuerer HM:
Significant differences in nipple aspirate fluid protein expres-
sion between healthy women and those with breast cancer
demonstrated by time-of-flight mass spectrometry. Breast
Cancer Res Treat 2005, 89:149-157.
44. Callesen AK, Vach W, Jørgensen PE, Cold S, Mogensen O, Kruse TA,
Jensen ON, Madsen JS: Reproducibility of mass spectrometry
based protein profiles for diagnosis of breast cancer across
clinical studies: a systematic review. J Proteome Res 2008,
7:1395-1402.
45. Karpievitch YV, Hill EG, Smolka AJ, Morris JS, Coombes KR, Baggerly
KA, Almeida JS: PrepMS: TOF MS Data Graphical Preprocess-
ing Tool. Bioinformatics 2007, 23:264-265.
46. Hilario M, Kalousis A, Pellegrini C, Müller M: Processing and clas-
sification of protein mass spectra. Mass Spectrom Rev 2006,
25:409-449.
47. Hastie T, Tibshirani R, Friedman JH: The Elements of Statistical
Learning. Springer Verlag; 2001.
48. Schölkopf B, Smola AJ, Williamson RC, Bartlett PL: New Support
Vector algorithms.
Neural Comput 2000, 12:1207-1245.
49. Tirumalai RS, Chan KC, Prieto DRA, Issaq HJ, Conrads TP, Veenstra
TD: Characterization of the low molecular weight human
serum proteome. Mol Cell Proteomics 2003, 2:1096-1103.
50. Mehta AI, Ross S, Lowenthal MS, Fusaro V, Fishman DA, Petricoin EF,
Liotta LA: Biomarker amplification by serum carrier protein
binding. Dis Markers 2003, 19:1-10.
51. Zweig MH, Campbell G: ROC plots: a fundamental evaluation
tool in clinical medicine. Clin Chem 1993, 39:561-577.
52. Dowsett M, Dunbier AK: Emerging biomarkers and new under-
standing of traditional markers in personalized therapy for
breast cancer. Clin Cancer Res 2008, 14:8019-8026.
53. Hayashi S, Yamaguchi Y: Estrogen signaling pathway and hor-
monal therapy. Breast Cancer 2008, 15:256-261.
54. Payne SJ, Bowen RL, Jones JL, Wells CA: Predictive markers in
breast cancer-the present. Histopathology 2008, 52:82-90.
55. Giovanella L, Ceriani L, Giardina G, Bardelli D, Tanzi F, Garancini S:
Serum cytokeratin fragment 21.1 (CYFRA 21.1) as tumour
marker for breast cancer: comparison with carbohydrate
antigen 15.3 (CA 15.3) and carcinoembryonic antigen
(CEA). Clin Chem Lab Med 2002, 40:298-303.
56. Nakata B, Ogawa Y, Ishikawa T, Ikeda K, Kato Y, Nishino H, Hirakawa
K: Serum CYFRA 21-1 is one of the most reliable tumor
markers for breast carcinoma. Cancer 2000, 89:1285-1290.
57. Furger KA, Menon RK, Tuck AB, Bramwell VH, Chambers AF: The
functional and clinical roles of osteopontin in cancer and
metastasis. Curr Mol Med 2001, 1:621-632.
58. Tuck AB, Chambers AF, Allan AL: Osteopontin overexpression
in breast cancer: knowledge gained and possible implications
for clinical management. J Cell Biochem 2007, 102:859-868.
59. Mantzoros CS, Bolhke K, Moschos S, Cramer DW: Leptin in rela-
tion to carcinoma in situ of the breast: a study of pre-meno-
pausal cases and controls. Int J Cancer 1999, 80:523-526.
60. Garofalo C, Koda M, Cascio S, Sulkowska M, Kanczuga-Koda L,
Golaszewska J, Russo A, Sulkowski S, Surmacz E: Increased expres-
sion of leptin and the leptin receptor as a marker of breast
cancer progression: possible role of obesity-related stimuli.
Clin Cancer Res 2006, 12:1447-1453.