báo cáo hóa học:" Mycophenolate pharmacokinetics and pharmacodynamics in belatacept treated renal allograft recipients – a pilot study" doc
Bạn đang xem bản rút gọn của tài liệu. Xem và tải ngay bản đầy đủ của tài liệu tại đây (366.67 KB, 14 trang )
BioMed Central
Page 1 of 14
(page number not for citation purposes)
Journal of Translational Medicine
Open Access
Research
Mycophenolate pharmacokinetics and pharmacodynamics in
belatacept treated renal allograft recipients – a pilot study
Sara Bremer
1,2
, NilsTVethe
1,2
, Helge Rootwelt
1
, Pål F Jørgensen
3
,
Jean Stenstrøm
4
, Hallvard Holdaas
4
, Karsten Midtvedt
4
and Stein Bergan*
1,5
Address:
1
Department of Medical Biochemistry, Rikshospitalet University Hospital, 0027 Oslo, Norway,
2
Institute of Clinical Biochemistry,
University of Oslo, 0027 Oslo, Norway,
3
Section for Transplant Surgery, Rikshospitalet University Hospital, Oslo, 0027 Oslo, Norway,
4
Department of Medicine, Rikshospitalet University Hospital, 0027 Oslo, Norway and
5
School of Pharmacy, University of Oslo, 0316 Oslo,
Norway
Email: Sara Bremer - ; Nils T Vethe - ;
Helge Rootwelt - ; Pål F Jørgensen - ;
Jean Stenstrøm - ; Hallvard Holdaas - ;
Karsten Midtvedt - ; Stein Bergan* -
* Corresponding author
Abstract
Background: Mycophenolic acid (MPA) is widely used as part of immunosuppressive regimens following allograft
transplantation. The large pharmacokinetic (PK) and pharmacodynamic (PD) variability and narrow therapeutic range of
MPA provide a potential for therapeutic drug monitoring. The objective of this pilot study was to investigate the MPA
PK and PD relation in combination with belatacept (2
nd
generation CTLA4-Ig) or cyclosporine (CsA).
Methods: Seven renal allograft recipients were randomized to either belatacept (n = 4) or cyclosporine (n = 3) based
immunosuppression. Samples for MPA PK and PD evaluations were collected predose and at 1, 2 and 13 weeks
posttransplant. Plasma concentrations of MPA were determined by HPLC-UV. Activity of inosine monophosphate
dehydrogenase (IMPDH) and the expressions of two IMPDH isoforms were measured in CD4+ cells by HPLC-UV and
real-time reverse-transcription PCR, respectively. Subsets of T cells were characterized by flow cytometry.
Results: The MPA exposure tended to be higher among belatacept patients than in CsA patients at week 1 (P = 0.057).
Further, MPA concentrations (AUC
0–9 h
and C
0
) increased with time in both groups and were higher at week 13 than at
week 2 (P = 0.031, n = 6). In contrast to the postdose reductions of IMPDH activity observed early posttransplant,
IMPDH activity within both treatment groups was elevated throughout the dosing interval at week 13. Transient
postdose increments were also observed for IMPDH1 expression, starting at week 1. Higher MPA exposure was
associated with larger elevations of IMPDH1 (r = 0.81, P = 0.023, n = 7 for MPA and IMPDH1 AUC
0–9 h
at week 1). The
maximum IMPDH1 expression was 52 (13–177)% higher at week 13 compared to week 1 (P = 0.031, n = 6). One patient
showed lower MPA exposure with time and did neither display elevations of IMPDH activity nor IMPDH1 expression.
No difference was observed in T cell subsets between treatment groups.
Conclusion: The significant influence of MPA on IMPDH1 expression, possibly mediated through reduced guanine
nucleotide levels, could explain the elevations of IMPDH activity within dosing intervals at week 13. The present
regulation of IMPDH in CD4+ cells should be considered when interpreting measurements of IMPDH inhibition.
Published: 27 July 2009
Journal of Translational Medicine 2009, 7:64 doi:10.1186/1479-5876-7-64
Received: 11 May 2009
Accepted: 27 July 2009
This article is available from: />© 2009 Bremer et al; licensee BioMed Central Ltd.
This is an Open Access article distributed under the terms of the Creative Commons Attribution License ( />),
which permits unrestricted use, distribution, and reproduction in any medium, provided the original work is properly cited.
Journal of Translational Medicine 2009, 7:64 />Page 2 of 14
(page number not for citation purposes)
Background
Mycophenolic acid (MPA) is widely used in immunosup-
pressive regimens, combined with calcineurin inhibitors
(CNI), corticosteroids, and frequently also induction ther-
apy, to prevent allograft rejection after transplantation.
Currently, two MPA formulations are available, the prod-
rug ester mycophenolate mofetil (MMF) and the enteric-
coated mycophenolate sodium.
Inosine monophosphate dehydrogenase (IMPDH) cata-
lyzes the rate-limiting step of de novo guanine nucleotide
synthesis. The enzyme activity is constituted by two isoen-
zymes, encoded by IMPDH1 and IMPDH2, which have
similar kinetic properties and share 84% identity at the
amino acid level [1]. However, the regulation and expres-
sion of the isoenzymes differ, and gene knockout models
indicate distinct functions of IMPDH 1 and 2 [2,3]. Lym-
phocyte activation is associated with elevation of both
isoenzymes, while neoplastic cells display marked up-reg-
ulation of IMPDH2 [4,5]. MPA exerts its immunosuppres-
sive action by inhibiting IMPDH, and thereby the
proliferation of activated lymphocytes [6].
MPA demonstrates a narrow therapeutic range and sub-
stantial inter- and intraindividual variability of pharma-
cokinetic (PK) and pharmacodynamic (PD) parameters.
Renal function, albumin levels, concomitant medications
and genetic polymorphisms of transporters and UDP-glu-
curonosyltransferases are among factors that influence
MPA PK profiles [7,8]. Furthermore, MPA exposure is
reported to increase over time after transplantation [9].
The activity of IMPDH, representing a PD marker,
depends on cell type and cycle status and probably also
concomitant medication and genetic variants of the
IMPDH genes [4,10,11]. Despite the variability of MPA PK
and PD, most immunosuppressive protocols prescribe
fixed doses ranging from 0.75 to 1.5 g MMF twice a day.
Several strategies have been suggested to individualize
MPA therapy and improve the clinical outcome after
transplantation. The area under the MPA concentration
versus time curve (AUC) from 0 to 12 hours correlates
with clinical outcome after transplantation but is imprac-
tical for routine monitoring, and various limited sampling
schemes have been evaluated [12-14]. Measurement of
IMPDH activity may provide a more direct estimation of
drug efficacy, and is investigated as a PD approach for
individualization of MPA therapy [15,16]. Long-term
MPA treatment has been associated with induced IMPDH
activity and expression [10,17-20]. However, the results
are conflicting and depend on the investigated cell popu-
lations and methodology. Furthermore, concomitant
medications (e.g. high doses of corticosteroids) and the
transplantation surgery itself may influence the activity
and expression of IMPDH [10]. The clinical implications
of these findings remain to be elucidated and further char-
acterization of the IMPDH isoenzymes during MPA expo-
sure is needed in the process of establishing strategies for
PD based monitoring of MPA.
The introduction of CNIs resulted in dramatic improve-
ments in short-term outcome after transplantation. How-
ever, long-term CNI use is associated with nephrotoxicity
and cardiovascular morbidities that may increase the risk
of late allograft loss and death. Belatacept, a second gen-
eration cytotoxic T-lymphocyte antigen-4 (CTLA4)-Ig
fusion protein, is investigated as an alternative to CNIs
following transplantation. It binds with high affinity to
CD80 and CD86, thereby resulting in T cell anergy and
apoptosis [21]. A phase 2 trial in renal allograft recipients
(n = 218) reports similar efficacy, higher glomerular filtra-
tion rates and less frequent chronic allograft nephropathy
with belatacept compared to cyclosporine (CsA) [22].
Several studies have demonstrated a PK interaction
between CsA and MPA, resulting in lower MPA exposure
[23,24]. Data on PK and PD of MPA in combination with
belatacept are limited. The present investigation is a sup-
plemental study appended to the BENEFIT-EXT phase 3
trial in transplant patients receiving grafts from extended
criteria donors (BMS protocol IM103027) [25]. This is an
observational, pilot study in renal transplant patients
receiving MMF in combination with either belatacept or
CsA. The objective was to investigate the relation between
PD and PK characteristics of MPA in the two treatment
groups during the early posttransplantation period. Meas-
urements of MPA concentrations were used for PK evalu-
ations, while PD investigations involved determination of
IMPDH activity, analyses of IMPDH 1 and 2 expression
and characterization of T cell subpopulations. The PK and
PD profiles of MPA changed with time after transplanta-
tion.
Materials and methods
Study subjects
From October 2006 to February 2007, seven adult
patients receiving grafts from extended criteria donors
were included in the BENEFIT-EXT study at Rikshospitalet
University Hospital. Extended criteria donors were
defined as donor age above 60 years, donor age above 50
years and other donor co-morbidities, cold ischemia time
above 24 hours or donation after cardiac death. The inclu-
sion and exclusion criteria are described in detail in the
BENEFIT-EXT study protocol [25]. Biopsies were per-
formed in cases of suspected rejection (Banff '97 grading
system) [26]. Demographic and clinical data were col-
lected from medical records.
Patients were randomized into three arms with CsA in one
arm and belatacept (less intensive or more intensive,
Journal of Translational Medicine 2009, 7:64 />Page 3 of 14
(page number not for citation purposes)
respectively) in the two others. Within the study period,
both belatacept regimens included doses of 10 mg/kg
administered as a 30 minutes intravenous (iv) infusion.
Doses were given at day 1 and 5, and at weeks 2, 4, 8 and
12 for both regimens. The more intensive regimen
included additional doses at weeks 6 and 10 [25]. Addi-
tional immunosuppression consisted of MMF (CellCept
®
,
Roche, Basel, Switzerland) 1 g twice daily, corticosteroids
and induction therapy with basiliximab (Simulect
®
,
Novartis, Basel, Switzerland) 20 mg on day 0 (transplan-
tation day) and day 4. Corticosteroids were given as iv
methylprednisolone, 540 mg on day 0 and 250 mg on day
1, followed by per oral prednisolone starting at 100 mg/
day, tapered by 10 mg/day and maintained at 20 mg/day
the first month, at 15 mg/day the second month and at 10
mg/day the third month. CsA was dosed according to pro-
tocol to reach target whole blood through concentrations
(C
0
) of 150–300 μg/L the first month posttransplant, and
then lowered to 100–250 μg/L. All patients received pro-
phylactic antiviral therapy consisting of valganciclovir or
valaciclovir.
The protocols of both the BENEFIT-EXT trial and the
present sub-study were approved by the regional commit-
tee for medical research ethics. The BENEFIT-EXT protocol
was also approved by the Norwegian Medicines Agency.
Written informed consent was obtained from all partici-
pants.
Samples
Samples were collected on one occasion before transplan-
tation and for 9 hour-profiles at approximately 1, 2 and
13 weeks posttransplant (referred to as week 1, 2 and 13).
The PK-PD profiles were abbreviated to 0 to 9 hours post-
dose for practical reasons. Samples for 9 hour-profiles
were drawn after an overnight fast before administration
of the morning dose of immunosuppression, and at 0.5,
1, 1.5, 2, 3, 4, 5, 6 and 9 hours postdose. IMPDH expres-
sions were not determined at 0.5 and 1.5 hours. Cell sub-
sets were characterized in the predose and 2 hours
postdose samples only. At each time point 10 mL whole
blood was collected in EDTA tubes. Samples were imme-
diately processed for CD4+ cell isolation, separation of
plasma and staining of cells for flow cytometric character-
ization.
Enzyme activity and gene expression measurements were
performed in CD4+ cells. These cells are relevant consid-
ering their role in allograft rejection as well as being
among the target cells for the action of MPA. The cells
were isolated from whole blood within an hour after sam-
pling by the use of paramagnetic beads with antibodies
against CD4 (Dynabeads
®
CD4, Invitrogen, Carlsbad, CA)
as described in detail elsewhere [27,28]. Analyses of bio-
chemical and haematological parameters were performed
according to standard methods at the clinical laboratory.
To evaluate the variability of IMPDH activity and gene
expression without influence of medication or exposure
to alloantigens, CD4+ cells from healthy individuals (n =
5) were investigated. Samples were drawn every 2 hours
over 6 hour intervals starting at 8 AM as described in detail
elsewhere [16,29].
Concentrations of immunosuppressive drugs
Total plasma concentrations of MPA were measured by
high-performance liquid chromatography assay with UV-
detection (HPLC-UV) [30]. Routine measurement of
whole blood CsA C
0
was performed by the CEDIA
®
immu-
noassay (Microgenics corp., Fremont, CA) on a Modular
analytics instrument (Roche Diagnostics, Mannheim,
Germany).
Enzyme activity
For the quantification of IMPDH activity in CD4+ cells,
intracellular MPA concentrations were restored by incu-
bating the isolated cells in filtrated plasma originating
from the same sample. The IMPDH activity was deter-
mined in cell lysates using an HPLC-UV assay for determi-
nation of xanthine derived from xanthosine
monophosphate (XMP) [27]. Activities were expressed as
the XMP production rate (pmol XMP per 1.0 × 10
6
CD4+
cells per min). For each dosing interval, predose (A
0
),
maximum (A
max
), minimum (A
min
) and AUC enzyme
activities were determined.
Gene expression
The gene expressions of IMPDH 1 and 2 in CD4+ cells
were quantified by a validated reverse transcription-PCR
method on a LightCycler
®
480 instrument (Roche Applied
Science) as previously described [28]. Briefly, total RNA
was extracted and reverse transcribed using random prim-
ers. Sequences of IMPDH1 and IMPDH2, and the refer-
ence genes aminolevulinate delta-synthase1, β2-
microglobulin and ribosomal protein L13A, were ampli-
fied in separate reactions including hybridization probes
for specific real-time product detection. Crossing points
were defined by the second derivative maximum method
and target gene expressions were calculated relative to the
geometric mean expression of the reference genes. Based
on the dose interval samples, predose (E
0
), maximum
(E
max
), minimum (E
min
) and AUCs for IMPDH1 and 2
gene expressions were calculated for each profile.
Quantification of T cell subsets
The numbers of total T cells (CD3+), as well as subpopu-
lations of helper (CD4+) and cytotoxic (CD8+) T cells
were determined by flow cytometry. These subsets were
further characterized based on the expression of CD45RA
Journal of Translational Medicine 2009, 7:64 />Page 4 of 14
(page number not for citation purposes)
and CD45RO isoforms indicating naïve and antigen expe-
rienced (activated/memory) lymphocytes, respectively.
Absolute quantification of T cell subsets was performed
using TruCount tubes according to the manufacturer's
instructions. Briefly, 50 μL EDTA blood was added to
tubes containing a given number of beads and cells were
stained with titrated amounts of anti-CD3-PerCP, anti-
CD45 RO-PE, anti-CD45 RA-APC and anti-CD4-FITC or
anti-CD8-FITC monoclonal antibodies (mAb). Isotype-
matched control anti-mouse mAb and non-labeled cells
were included for each sample. Erythrocytes were lysed by
adding 450 μL FACS Lysing Solution. The tubes and all
reagents were supplied by BD (Becton Dickinson Bio-
sciences, Oxford, UK). Flow cytometric analyses were per-
formed within 24 hours after labeling on a FACSCalibur
(BD) flow cytometer using the CellQuest Software (BD)
for data acquisition. The bead population and CD3+ cell
versus side scatter population were manually gated.
Data analysis and statistics
Results of the RT-PCR assays were analyzed using the
LightCycler 480 Software v.1.5 (Roche Applied Science).
All gene expression measurements were performed in trip-
licate. Absolute cell counts were calculated by the Cel-
lQuest Software based on the gated bead population.
Postdose data of gene expression and enzyme activity
were normalized to individual predose levels. Based on
the steady-state of MMF dosing, AUCs were calculated by
the linear trapezoid method for intervals 0–6 hours, 0–9
hours and 4–9 hours as indicated (AUC
0–6 h
, AUC
0–9 h
,
AUC
4–9 h
, respectively). All results are presented as median
(range) unless otherwise specified.
Statistical tests were performed using SPSS statistical soft-
ware version 16.0 (SPSS Inc., Chicago, IL). The Mann-
Whitney test was used for comparisons of unpaired data,
while the Wilcoxon signed rank test was used for paired
data. Pearson's r was used for correlation analyses. Statis-
tical significance was considered at P < 0.05 (two-tailed).
Results
Patient population
The planned enrolment for the BENEFIT-EXT trial at Rik-
shospitalet University Hospital was 12 patients. However,
only 7 patients receiving allografts from extended criteria
donors were recruited at our center within the inclusion
period. Out of these, 3 patients were randomized to
receive CsA, while 4 patients received belatacept regimens.
Baseline characteristics are summarized in Table 1. There
were no significant demographic differences between the
treatment groups. One of the belatacept patients with-
drew from the study after the 6 hours postdose sampling
at week 2. Data from this profile were omitted from the
AUC calculations.
No cytomegalovirus breakthrough disease was identified
during the study period. Biopsy verified acute rejection,
graft loss and death were absent during the 13 weeks fol-
low-up. Renal function improved significantly the first
weeks after transplantation. Plasma concentrations of
albumin, total bilirubin, and ALAT were stable through-
out the study period.
MPA pharmacokinetics
Two patients, both in the belatacept arm, had their MMF
dosing reduced to 1.5 g/day between weeks 2 and 13, both
due to drops in leukocyte count. Steady-state conditions
with respect to MPA were established in both patients
before the investigations at week 13. The other patients
remained on MMF doses of 1 g twice a day throughout the
follow-up. Pharmacokinetic data of MPA are summarized
in Table 2 and concentration profiles are depicted in Fig-
ure 1. The interindividual variability in MPA concentra-
tion was substantial and highest early posttransplant.
Within the whole group, up to 4- and 7-fold differences
were observed for MPA C
0
(week 2) and AUC
0–9 h
(week
1), respectively. The first week posttransplant, MPA C
0
seemed to be higher among belatacept patients (P =
0.057, n = 4 and n = 3) and 3 of 4 belatacept patients dem-
onstrated higher MPA AUC
0–9 h
than the CsA patients.
The maximum plasma concentrations (C
max
) of MPA
appeared 1 (0.5–2) hour postdose. Following C
max
, sec-
ondary MPA concentration peaks were observed 5 (2–9)
hours postdose and were more pronounced for belatacept
patients than for CsA patients. Limited MPA concentra-
tion profiles were calculated from 4 to 9 hours to estimate
potential impact of enterohepatic circulation. The MPA
AUC
4–9 h
was numerically higher among belatacept
patients than for CsA patients at week 1, being 15.2 (10.4–
27.1) mg × h/L and 7.8 (6.2–13.3) mg × h/L, respectively
(P = 0.114, n = 4 and n = 3).
Doses of CsA were tapered according to CsA C
0
measure-
ments and were median 550 (450–825) mg, 550 (400–
575) mg and 300 (300–350) mg at week 1, 2 and 13,
respectively. The corresponding CsA C
0
were median 190
(160–380) μg/L, 265 (180–295) μg/L and 175 (140–180)
μg/L. The reduction of CsA exposure was accompanied by
increasing MPA concentrations. The association between
MPA C
0
and CsA C
0
, as well as CsA dose, displayed corre-
lation coefficients (r) of -0.74 (P = 0.023, n = 9; pooled
CsA data) and -0.79 (P = 0.012, n = 9), respectively.
Considering the entire study population, the lowest MPA
exposure was observed at week 2 and then increased with
time. At week 13, MPA C
0
was 60 (26–200)% higher (P =
0.031, n = 6), while MPA AUC
0–9 h
was 43 (11–67)%
Journal of Translational Medicine 2009, 7:64 />Page 5 of 14
(page number not for citation purposes)
higher (P = 0.031, n = 6) compared to week 2. The eleva-
tion seemed to be most pronounced in CsA patients,
although no significant difference was detected between
groups (Table 2).
At week 1, MPA exposure was inversely correlated to bod-
yweight, with correlation coefficients of -0.90 (P = 0.005,
n = 7) and -0.80 (P = 0.031, n = 7) for MPA C
0
and AUC
0–
9 h
, respectively. However, no significant relation was
detected at later observations. Adjusted for bodyweight
normalized doses, patients with belatacept displayed
numerically higher MPA C
0
, 0.22 (0.18–0.23; n = 4) mg/
L per mg/kg, than CsA patients, 0.13 (0.07–0.17; n = 3)
mg/L per mg/kg, at week 1 (P = 0.057). The MPA exposure
did not seem to be associated with plasma albumin, ALAT
or bilirubin.
Enzyme activity
Summarized data of IMPDH activity are presented in Fig-
ure 1 and Table 2. Pretransplant activity was variable and
tended to be higher among CsA patients compared to
belatacept patients. Following transplantation, predose
activities (A
0
) seemed to be influenced by the present
MPA C
0
, and no consistent trends were observed for A
0
versus time since transplantation (Table 2).
The postdose activities of IMPDH were strongly influ-
enced by MPA exposure. At week 1, the activity profiles for
6 of the patients were inversely related to MPA concentra-
Table 1: Patient characteristics
Belatacept (n = 4) CsA (n = 3)
Age, years 74 (68–78) 66 (29–71)
Gender, M/F 3/1 3/0
Bodyweight, kg 63.1 (58.7–85.6) 92.3 (75.7–96.0)
Body mass index, kg/m
2
22.9 (18.6–28.0) 26.7 (23.1–26.9)
Donor, DD/LD 4/0 3/0
Previous transplants 0 0
Dialysis pretransplant 3 1
Observation day after transplantation (day 0)
Week 1 7 (6–8) 6 (6–7)
Week 2 14.5 (13–15) 16 (14–20)
Week 13 90.5 (78–95) 91 (77–93)
Number of HLA mismatches
Total 2.5 (2–3) 1 (0–3)
DR 0.5 (0–1) 1 (0–1)
Duration of cold ischemia (h) 16.5 (9.2–23.6) 13.4 (12.7–15.1)
CMV serostatus
D+/R+ 4 1
D+/R- 0 2
CMV, cytomegalovirus; D, donor; DD, deceased donor; LD, living donor; R, recipient
Journal of Translational Medicine 2009, 7:64 />Page 6 of 14
(page number not for citation purposes)
Table 2: MPA exposure and IMPDH activity
Treatment group Total
MPA plasma concentration Week Belatacept (n = 4) Cyclosporine (n = 3)
C
0
(mg/L) 1 3.1 (2.7–3.8) 1.4 (0.7–2.3) 2.7 (0.7–3.8)
2 1.9 (1.7–5.5) 1.9 (0.8–2.3) 1.9 (0.8–5.5)
13 3.2 (2.9–7.6) 2.9 (2.4–3.0) 3.0 (2.4–7.6)
AUC
0–9 h
(mg × h/L)
1 44.4 (28.2–70.8) 37.1 (17.9–40.1) 40.1 (17.9–70.8)
2 35.1 (33.6–47.6) 26.4 (16.3–37.8) 34.4 (16.3–47.6)
13 48.5 (39.1–64.1) 37.4 (27.2–59.0) 43.8 (27.2–64.1)
C
max
(mg/L) 1 12.8 (7.7–15.4) 11.0 (5.2–19.5) 11.3 (5.2–19.5)
2 12.1 (9.7–15.1) 7.8 (4.4–10.9) 10.9 (4.4–15.1)
13 17.9 (8.1–21.4) 11.3 (5.3–13.7) 12.5 (5.3–21.4)
IMPDH activity in CD4+ cells
A
0
(pmol/10
6
cells/min)
0 0.24 (0.16–0.31) 0.61 (0.3–0.95) 0.31 (0.16–0.95)
1 0.96 (0.70–1.4) 0.63 (0.37–1.53) 0.92 (0.37–1.53)
2 0.43 (0.25–0.71) 1.1 (0.66–1.53) 0.60 (0.25–1.53)
13 0.70 (0.32–2.7) 0.28 (0.2–1.87) 0.51 (0.2–2.72)
AUC
0–9 h
(% of A
0
× h)
1 760 (472–908) 1197 (904–1491) 884 (472–1491)
2 1168 (694–3142) 760 (488–1032) 1032 (488–3142)
13 3034 (414–3784) 3044 (765–3111) 3039 (414–3784)
A
min
(% of A
0
)
1 45.5 (25.4–58.1) 46.1 (39.0–100) 46.1 (25.4–100)
2 77.4 (48.0–100) 64.3 (32.6–96.0) 77.4 (32.6–100)
13 100 (7.6–100) 100 (13.0–100) 100 (7.6–100)
A
max
(% of A
0
)
1 141 (103–184) 170 (100–254) 160 (100–254)
2 255 (113–524) 119 (100–137) 184 (100–524)
13 627 (106–707) 523 (148–525) 524 (106–707)
Data are given as median (range). The belatacept group includes 3 patients at week 13 and for the maximum, minimum and AUC calculations at
week 2. A
0
, predose activity; A
max
, maximum activity; A
min
, minimum activity; AUC, area under the variable versus time curve; C
0
, predose
concentration, C
max
, maximum concentration; C
min
, minimum concentration, IMPDH, inosine monophosphate dehydrogenase; MPA, mycophenolic
acid.
Journal of Translational Medicine 2009, 7:64 />Page 7 of 14
(page number not for citation purposes)
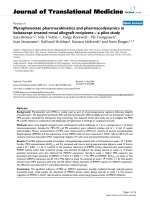
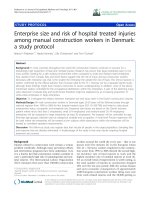
Median inosine monophosphate dehydrogenase (IMPDH) activity (% of predose) and mycophenolic acid (MPA) concentrations among renal allograft recipientsFigure 1
Median inosine monophosphate dehydrogenase (IMPDH) activity (% of predose) and mycophenolic acid
(MPA) concentrations among renal allograft recipients. The vertical lines represent the range of total observations.
Profiles of patients in the belatacept group (n = 3) at weeks 1, 2 and 13 (A, B and C) and the cyclosporine group (n = 3) at
weeks 1, 2 and 13 (D, E and F). (Observe scale on right y-axis of C.)
0
100
200
300
400
500
600
700
800
0246810
0
2
4
6
8
10
12
14
16
IMPDH activity
MPA
0
100
200
300
400
500
600
700
800
0246810
0
2
4
6
8
10
12
14
16
IMPDH activity
MPA
0
100
200
300
400
500
600
700
800
0246810
0
2
4
6
8
10
12
14
16
IMPDH activity
MPA
0
200
400
600
800
0246810
0
6
12
18
24
IMPDH ac tiv ity
MPA
0
100
200
300
400
500
600
700
800
0246810
0
2
4
6
8
10
12
14
16
IMPDH ac tiv ity
MPA
0
100
200
300
400
500
600
700
800
0246810
0
2
4
6
8
10
12
14
16
IMPDH activity
MPA
IMPDH relative activity (%)
IMPDH relative activity (%)
Hours post-dose
D week 1
E week 2
A week 1
B week 2
MPA concentration (mg/L)
MPA concentration (mg/L)
C week 13
F week 13
IMPDH relative activity (%)
IMPDH relative activity (%)
MPA concentration (mg/L)
MPA concentration (mg/L)
IMPDH relative activity (%)
IMPDH relative activity (%)
MPA concentration (mg/L)
MPA concentration (mg/L)
Belatacept Cyclosporine
Journal of Translational Medicine 2009, 7:64 />Page 8 of 14
(page number not for citation purposes)
tions with maximum 57 (42–75)% enzyme inhibition
around MPA C
max
(Figure 1). The AUC
0–9 h
activities dis-
played inverse correlations to MPA C
0
(r = -0.91, P =
0.012, n = 6) and MPA C
max
(r = -0.86, P = 0.028, n = 6),
implying greater inhibition of IMPDH with higher MPA
exposure. However, this relation changed with time post-
transplant. At week 13, IMPDH activity increased post-
dose within both treatment groups, reaching up to 7-
times A
0
before returning towards predose activities (Fig-
ure 1). Considering AUC
0–9 h
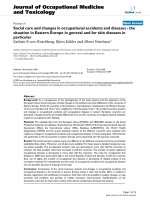
activity, 4 of 6 patients dem-
onstrated substantial increases reaching 3.6 times the
activity of week 1 (Figure 2). Compared to week 2, the
AUC
0–9 h
activity was 81 (25–322)% higher at week 13 (P
= 0.063, n = 5). Higher MPA C
max
was associated with
increasing IMPDH activity, expressed as AUC
0–9 h
(r =
0.80, P = 0.058, n = 6) and A
max
(r = 0.88, P = 0.051, n =
6). Compared to healthy controls (n = 5), the CsA treated
patients (n = 3) showed higher IMPDH AUC
0–6 h
activity
at week 13 (P = 0.036). Within the belatacept group, 2 of
3 patients displayed higher activity than the controls
(Additional file 1: IMPDH activity and IMPDH1 expres-
sion in patients on MMF therapy compared to healthy
individuals).
Gene expression
The pretransplant expression of IMPDH2 was 2.1 (1.6–
2.7) times higher than IMPDH1 in CD4+ cells. Predose
expressions (E
0
) of IMPDH 1 and 2 were highest and most
variable the first week posttransplant, being 104 (20–150)
% and 18.8 (7.2–75) % above the levels at week 13,
respectively (P = 0.031, n = 6 for both). Predose expres-
sions were comparable at week 2 and 13 (Table 3).
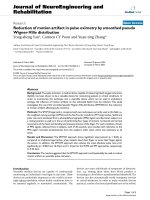
The 9 hour-profiles showed rapid changes of IMPDH1
expression postdose, while IMPDH2 expression was rela-
tively stable (Figure 3). At week 1, IMPDH1 expression
was transiently upregulated for belatacept patients, while
CsA patients displayed downregulation. With longer time
on immunosuppressive therapy, including higher MPA
exposure, increasing transient inductions of IMPDH1
expression were observed postdose for both treatment
groups (Table 3). At week 13, the maximum expression
(E
max
, % of E
0
) of IMPDH1 was 52 (13–177)% higher
than at week 1 (n = 6, P = 0.031). A similar trend was
observed for IMPDH1 AUC
0–9 h
expression (n = 6, P =
0.094). Compared to healthy controls (n = 5), the patients
(n = 6) demonstrated higher IMDPH1 E
max
at week 13 (P
= 0.004), being 101 (100–116)% and 167 (118–193)%,
respectively. Considering IMPDH1 AUC
0–6 h
expression,
CsA patients (n = 3) displayed higher levels at week 13
than controls (P = 0.036). Among belatacept patients (n =
3), IMPDH1 AUC
0–6 h
expression was elevated at week 1
(P = 0.032) and tended to be increased at week 13 (P =
0.071), compared to healthy controls (Additional file 1:
IMPDH activity and IMPDH1 expression in patients on
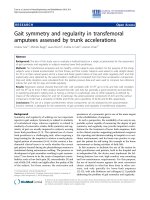
Individual 0–9 hours area under the curve (AUC) for 6 renal transplant patients at week 13 compared to week 1Figure 2
Individual 0–9 hours area under the curve (AUC) for
6 renal transplant patients at week 13 compared to
week 1. Solid lines denote belatacept patients (n = 3) while
broken lines represent CsA patients (n = 3). Data are pro-
vided for A: mycophenolic acid (MPA) AUC
0–9 h
, B: inosine
monophosphate dehydrogenase (IMPDH) activity AUC
0–9 h
and C: IMPDH1 expression AUC
0–9 h
.
0
500
1000
1500
2000
2500
3000
3500
4000
0
10
20
30
40
50
60
70
80
MPA AUC
0-9h
A
MPA AUC
0-9h
1
13
Weeks post-transplant
1
13
Weeks post-transplant
B
IMPDH AUC
0-9h
activity
IMPDH AUC
0-9h
activity
400
600
800
1000
1200
1400
1600
Belatacept
group
Cyclosporine
group
1
13
C
IMPDH1 AUC
0-9h
expression
IMPDH1 AUC
0-9h
expression
Weeks post-transplant
Pt#1 Pt#4
Pt#2 Pt#5
Pt#3 Pt#6
Journal of Translational Medicine 2009, 7:64 />Page 9 of 14
(page number not for citation purposes)
MMF therapy compared to healthy individuals). One of
the patients with MMF dose reduction experienced lower
MPA exposure with time, and did neither display eleva-
tions of IMPDH activity nor IMPDH1 expression (Figure
2). The first week posttransplant, IMPDH1 AUC
0–9 h
expression correlated with MPA C
0
(r = 0.76, P = 0.047, n
= 7) and MPA AUC
0–9 h
(r = 0.81, P = 0.027, n = 7). An
association was also observed between minimum
IMPDH1 expression (E
min
) and MPA AUC
0–9 h
(r = 0.82, P
= 0.023, n = 7). This implies that higher MPA exposure is
associated with larger increases of IMPDH1 expression
postdose.
The IMPDH1 isoform demonstrated stronger correlations
to IMPDH activity than IMPDH2. At week 1, there was an
inverse correlation of -0.88 (P = 0.02, n = 6) between
IMPDH1 E
max
and IMPDH A
max
indicating that lower
IMPDH activity was accompanied by larger elevations of
IMPDH1 expression. This relation changed with time, and
13 weeks posttransplant IMPDH1 AUC
0–9 h
expression
displayed positive correlations with IMPDH AUC
0–9 h
activity (r = 0.94, P = 0.005, n = 6) and A
max
(r = 0.90, P =
0.038, n = 5). Although IMPDH2 was the dominant iso-
form predose, the ratio of IMPDH2 to IMPDH1 expres-
sion declined after dosing toward ratios of about 1 for
some patients.
No significant associations were observed between activ-
ity or gene expressions of IMPDH and age, time since
transplantation, dialysis, infections or HLA-DR mis-
matches.
T cell subsets
Characterization of T cell subsets was only performed in 6
of the 7 patients, for technical reasons.
Before transplantation, patients demonstrated a wide
range of T cell counts, with up to 2.2- and 2.8-fold varia-
tion for both CD4+ and CD8+ cells. Following transplan-
tation, the number of both subpopulations tended to
decrease among belatacept patients while the T cell pro-
files for CsA patients were more variable. At week 2, two
Table 3: IMPDH1 expression
Treatment group Total
IMPDH1 Week Belatacept (n = 4) Cyclosporine (n = 3)
E
0
0 0.63 (0.54–0.76) 0.44 (0.37–0.79) 0.59 (0.37–0.79)
1 0.56 (0.32–1.1) 0.75 (0.67–0.75) 0.67 (0.32–1.1)
2 0.45 (0.17–0.54) 0.54 (0.43–0.62) 0.50 (0.17–0.62)
13 0.42 (0.25–0.59) 0.31 (0.30–0.43) 0.36 (0.25–0.59)
AUC
0–9 h
(% of E
0
× h)
1 1018 (866–1128) 794 (736–881) 880 (736–1128)
2 1146 (781–1278) 784 (741–1146) 1145 (741–1622)
13 1070 (911–1201) 1291 (1193–1540) 1197 (911–1540)
E
min
(% of E
0
)
1 85.3 (75.3–115) 69.3 (46.8–92.2) 82.0 (46.8–115)
2 94.4 (80.2–103) 71.1 (60.7–94.3) 87.3 (60.7–103)
13 97.0 (57.2–99.6) 113 (89.5–117) 98.3 (57.2–117)
E
max
(% of E
0
) 1 140 (108–143) 105 (102–122) 121 (102–143)
2 147 (105–189) 107 (104–151) 127 (104–189)
13 161 (133–196) 203 (173–222) 185 (133–222)
Data are given as median (range). The belatacept group includes 3 patients at week 13 and for the maximum, minimum and AUC calculations at
week 2. E
0
, predose expression; E
max
, maximum expression; E
min
, minimum expression; AUC, area under the variable versus time curve.
Journal of Translational Medicine 2009, 7:64 />Page 10 of 14
(page number not for citation purposes)
Median gene expressions of IMPDH1 and IMPDH2 (% of predose) among renal allograft recipientsFigure 3
Median gene expressions of IMPDH1 and IMPDH2 (% of predose) among renal allograft recipients. The vertical
lines correspond to the range of total observations. Profiles of patients in the belatacept group (n = 3) at weeks 1, 2 and 13 (A,
B and C) and the cyclosporine group (n = 3) at weeks 1, 2 and 13 (D, E and F).
60
80
100
120
140
160
180
200
220
0246810
IMPDH1 expression
IMPDH2 expression
60
80
100
120
140
160
180
200
220
0246810
IMPDH1 expression
IMPDH2 expression
60
80
100
120
140
160
180
200
220
0246 810
IMPDH1 expression
IMPDH2 expression
60
80
100
120
140
160
180
200
220
0246 810
IMPDH1 expression
IMPDH2 expression
60
80
100
120
140
160
180
200
220
0246810
IMPDH1 expression
IMPDH2 expression
60
80
100
120
140
160
180
200
220
0246 810
IMPDH1 expression
IMPDH2 expression
Relative gene expression (%)
Relative gene expression (%)
Hours post-dose
Relative gene expression (%)
Relative gene expression (%)
Relative gene expression (%)
Relative gene expression (%)
Belatacept Cyclosporine
D
week 1
E
week 2
A
week 1
B
week 2
C
week 13
F
week 13
Journal of Translational Medicine 2009, 7:64 />Page 11 of 14
(page number not for citation purposes)
of three CsA patients displayed up to 2-fold increases of
CD4+ and CD8+ T cells, while reductions of 16.5 (7.7–
49.5)% and 31.7 (32.0–49.6)% were observed for belata-
cept patients.
The proportions of naïve (CD45RA) and memory
(CD45RO) T cells were comparable in both treatment
groups, displaying CD45RA to CD45RO ratios of 0.61
(0.37–1.0) and 1.7 (1.1–3.0) for CD4+ and CD8+ cells (n
= 6), respectively, before transplantation. The percentage
of CD4+ cells with memory phenotype tended to decline
posttransplant within both groups. At week 13, the pro-
portion of memory CD4+ cells was 12.3 (3.5–22)% (P =
0.063, n = 6) lower than pretransplant.
The largest alteration in T cell subsets from pre- to post-
dose, was observed for CD4+ cells at week 13 with reduc-
tions of 45.8 (24.6–52.8)% (n = 6, P = 0.063). However,
the proportions of naïve and memory cells were compara-
ble before and after dose.
Discussion
This is the first study of MPA PK and PD relations among
renal allograft recipients receiving belatacept compared to
patients with CsA. Data from healthy individuals were
included to account for possible diurnal or random varia-
bility of IMPDH.
Although standard MMF doses were applied, there was a
considerable variability of MPA exposure among individ-
uals. Early posttransplant, belatacept patients showed
higher MPA concentrations, as well as more pronounced
secondary concentration peaks, than CsA patients. Other
comedication and parameters of renal and hepatic func-
tion were similar between the groups, and the inverse cor-
relation between CsA and MPA concentrations suggest an
effect of CsA on MPA exposure. Despite MMF dose reduc-
tions for two belatacept patients, the MPA exposure
increased significantly from week 2 to week 13 when con-
sidering the whole population. The elevation might be
related to the tapering of CsA and corticosteroid doses and
improvement of renal function.
The PK of MPA is reported to be influenced by renal func-
tion, albumin levels and concomitant medications [31].
Genetic polymorphisms of transporters, e.g. multidrug
resistance-associated protein 2 (MRP2), and UDP-glu-
curonosyltransferases may also contribute to variable
MPA exposure [7,8]. Several studies have reported lower
MPA concentrations when used in combination with CsA
than used with tacrolimus, sirolimus or alone [23,24].
This is probably due to CsA mediated inhibition of MRP2,
which is involved in enterohepatic circulation of MPA
[32]. Furthermore, MPA exposure is reported to increase
with time posttransplant. The mechanisms are multifacto-
rial and may include changes in comedication, protein
binding, renal function, liver disease and red blood cell
counts [33,34].
In contrast to the inverse relation between MPA concen-
trations and IMPDH activity in CD4+ cells early posttrans-
plant, prolonged MPA administration was associated with
transient elevations of activity within dose intervals. This
shifting IMPDH response is supported by the opposite
correlations at week 1 and 13 between MPA exposure and
IMPDH activity, and may provide an explanation for why
higher concentrations of MPA do not result in markedly
higher inhibition [16].
The regulation of the two IMPDH isoenzymes was further
investigated by gene expression analysis. Following dos-
ing, the expression of IMPDH1 displayed rapid and tran-
sient changes. Increasing MPA exposure was associated
with larger inductions of IMPDH1. This might contribute
to the associated elevation of IMPDH activity at week 13.
The relative increase of IMPDH1 versus IMPDH2 expres-
sion supports marked contributions of IMPDH1 to the
measured activity within dosing intervals.
The present changes of IMPDH activity and IMPDH1
expression in CD4+ cells are consistent with previous
observations in mononuclear cells from transplant
patients [20]. In addition, a study in healthy volunteers
receiving different doses of MMF reported that regulation
of IMPDH1 expression was associated with MPA exposure
[29]. The IMPDH1 gene may be regulated through
changes in guanine nucleotides, or potentially by direct
effects of MPA. Previous reports suggest negative feedback
regulation of IMPDH by guanine nucleotides in cultured
human cells and in yeast [35,36]. In CD4+ cells from
healthy individuals, low MPA exposure seemed to be
associated with elevations of guanine nucleotides and
subsequent reductions of IMPDH1 expression [16,29]. In
contrast, higher and repeated MPA exposure may lead to
depletion of intracellular guanine nucleotides and subse-
quent upregulation of IMPDH1 expression as was
observed in the present study. Concomitant measurement
of guanine nucleotides and gene expression in a larger
cohort is necessary to confirm this hypothesis. Further-
more, potential effects of comedications like corticoster-
oids, basiliximab or the antiviral prophylaxis cannot be
excluded.
Prolonged MPA administration has been associated with
increased predose IMPDH activity in whole blood and
erythrocytes but not lymphocytes [10,17-19]. The rapid
and transient induction of IMPDH in CD4+ cells contrasts
the gradual elevation in erythrocytes, which may originate
from an induction in earlier differentiation stages that
persists during erythrocyte maturation.
Journal of Translational Medicine 2009, 7:64 />Page 12 of 14
(page number not for citation purposes)
Traditionally, IMPDH1 has been regarded constitutive,
while IMPDH2 was considered to be the inducible isoen-
zyme and primary target for immunosuppression [37].
More recent findings reveal that both isoenzymes are
essential for lymphocyte proliferation and potentially
important for immunosuppressive effects [4]. Further-
more, associations between genetic variants of IMPDH1
and a form of autosomal dominant retinitis pigmentosa
have increased the interest in this isoform [38]. The cur-
rent study emphasizes different genetic control of the
isoenzymes in CD4+ cells. Although the detailed mecha-
nisms are unknown, IMPDH1 is reported to be subject to
complex regulation involving three promoters and vari-
ous transcripts [39]. Because IMPDH2 is approximately 5
times more sensitive to MPA than IMPDH1 [40], a relative
increase of IMPDH1 could have implications for the MPA
effect.
Previous studies have described reduced CD4+ cell counts
after initiation of immunosuppression [41]. This was also
observed for the belatacept patients in the present study.
In contrast, the increased CD4+ cell counts for two CsA
patients at week 2 may be attributed to immune activa-
tion. Furthermore, the tendency towards reduced propor-
tions of CD4+ memory cells within both treatment groups
at week 13 may be explained by the current immunosup-
pression. It has generally been accepted that memory T
cells do not require CD28-CD80/CD86 costimulation for
recall responses. Recent studies have suggested that T cell
costimulation is required for optimal IL-2 production and
proliferation of both naïve and memory CD4+ T cells
[42]. Despite having different mechanisms of action, both
belatacept and CsA interfere with the IL-2 pathway, sup-
porting the similar effects on T cell subsets. However, sev-
eral exogenous (e.g. other immunosuppressants) and
endogenous factors (e.g. circadian rhythm, stress) may
also influence lymphocyte subsets and should be
accounted for in further studies.
The isolation of variable numbers of CD4+ cells in each
sample was compensated by relating IMPDH activity to
cell counts and gene expressions to a reference gene index.
However, various subsets of peripheral CD4+ T cells may
display different levels of IMPDH activity and gene expres-
sions. Alterations in these subsets could thereby influence
the measured activity and gene expression. Although
CD4+ cell counts changed, the proportions of naïve and
memory cells remained stable after dose, indicating that
IMPDH changes are not an effect of altered CD4+ cell
populations.
The potential of a PD approach for MPA individualization
has been supported by correlations between IMPDH lev-
els and posttransplant outcomes. Sanquer et al. reported
an up-regulation of predose IMPDH1 expression in
mononuclear cells at acute rejection episodes [20]. More-
over, high pretransplant IMPDH activity in mononuclear
cells and IMPDH2 expression in CD4+ cells have been
associated with acute rejection episodes [10,15]. Recently,
polymorphisms within the IMPDH1 and IMPDH2 genes
have been suggested to impact baseline IMPDH activity
and outcomes after transplantation [43,44]. Indeed, fur-
ther investigations of IMPDH activity and regulation of
the two isoenzymes are essential to elucidate the level of
IMPDH inhibition that yields adequate immunosuppres-
sion. The present study suggests that MPA has a significant
influence on IMPDH1 expression within the dose interval.
This is an important aspect to consider when interpreting
measurements of IMPDH inhibition.
The major limitation of this study is the low number of
enrolled patients. This implies that the results should be
interpreted with caution and that future prospective stud-
ies with larger cohorts are required to confirm the find-
ings. The clinical outcome, including renal function, is
investigated in detail in the ongoing BENEFIT-EXT trial
[25].
Conclusion
In the present pilot study, the IMPDH activity in CD4+
cells throughout dose intervals was significantly increased
by week 13 compared to early posttransplant. This was
observed both in cyclosporine and belatacept treated
patients, and irrespective of higher MPA exposure. A
marked increase of IMPDH1 expression within dose inter-
vals, possibly mediated by reduced guanine nucleotide
levels, may explain this paradox. The differences in MPA
exposure between CsA and belatacept treated patients
were as anticipated with reference to the documented CsA
induced reductions in MPA exposure. No pronounced
effects were observed of belatacept per se on MPA PK or
PD.
Competing interests
The authors declare that they have no competing interests.
Authors' contributions
SB, StB, PFJ, HH, KM and JS participated in the design of
the study. PFJ, HH, KM and JS provided the patients. The
samples were collected by JS. SB, NTV, HR and StB con-
tributed to the development of analytical methods. SB
and NTV prepared the samples and performed sample
and data analyzes. NTV, HR and StB helped to interpret
data and draft the manuscript written by SB. All authors
read and approved the manuscript.
SB, Sara Bremer; StB, Stein Bergan.
Journal of Translational Medicine 2009, 7:64 />Page 13 of 14
(page number not for citation purposes)
Additional material
Acknowledgements
The authors gratefully acknowledge Karin Apneseth for her skillful technical
assistance and Laila Gjerdalen for organization of the laboratory facilities.
References
1. Natsumeda Y, Ohno S, Kawasaki H, Konno Y, Weber G, Suzuki K:
Two distinct cDNAs for human IMP dehydrogenase. J Biol
Chem 1990, 265:5292-5295.
2. Gu JJ, Tolin AK, Jain J, Huang H, Santiago L, Mitchell BS: Targeted
disruption of the inosine 5'-monophosphate dehydrogenase
type I gene in mice. Mol Cell Biol 2003, 23:6702-6712.
3. Gu JJ, Stegmann S, Gathy K, Murray R, Laliberte J, Ayscue L, Mitchell
BS: Inhibition of T lymphocyte activation in mice hetero-
zygous for loss of the IMPDH II gene. J Clin Invest 2000,
106:599-606.
4. Dayton JS, Lindsten T, Thompson CB, Mitchell BS: Effects of human
T lymphocyte activation on inosine monophosphate dehy-
drogenase expression. J Immunol 1994, 152:984-991.
5. Nagai M, Natsumeda Y, Konno Y, Hoffman R, Irino S, Weber G:
Selective up-regulation of type II inosine 5'-monophosphate
dehydrogenase messenger RNA expression in human leuke-
mias. Cancer Res 1991, 51:3886-3890.
6. Eugui EM, Almquist SJ, Muller CD, Allison AC: Lymphocyte-selec-
tive cytostatic and immunosuppressive effects of mycophe-
nolic acid in vitro: role of deoxyguanosine nucleotide
depletion. Scand J Immunol 1991, 33:161-173.
7. Kuypers DR, Naesens M, Vermeire S, Vanrenterghem Y: The
impact of uridine diphosphate-glucuronosyltransferase 1A9
(UGT1A9) gene promoter region single-nucleotide poly-
morphisms T-275A and C-2152T on early mycophenolic acid
dose-interval exposure in de novo renal allograft recipients.
Clin Pharmacol Ther 2005, 78:351-361.
8. Naesens M, Kuypers DR, Verbeke K, Vanrenterghem Y: Multidrug
resistance protein 2 genetic polymorphisms influence myco-
phenolic acid exposure in renal allograft recipients. Transplan-
tation 2006, 82:1074-1084.
9. van Gelder T, Hilbrands LB, Vanrenterghem Y, Weimar W, de Fijter
JW, Squifflet JP, Hene RJ, Verpooten GA, Navarro MT, Hale MD,
Nicholls AJ: A randomized double-blind, multicenter plasma
concentration controlled study of the safety and efficacy of
oral mycophenolate mofetil for the prevention of acute
rejection after kidney transplantation. Transplantation 1999,
68:261-266.
10. Bremer S, Mandla R, Vethe NT, Rasmussen I, Rootwelt H, Line PD,
Midtvedt K, Bergan S: Expression of IMPDH1 and IMPDH2 after
transplantation and initiation of immunosuppression. Trans-
plantation 2008, 85:55-61.
11. Wang J, Zeevi A, Webber S, Girnita DM, Addonizio L, Selby R, Hutch-
inson IV, Burckart GJ: A novel variant L263F in human inosine
5'-monophosphate dehydrogenase 2 is associated with
diminished enzyme activity. Pharmacogenet Genomics 2007,
17:283-290.
12. Hale MD, Nicholls AJ, Bullingham RE, Hene R, Hoitsma A, Squifflet JP,
Weimar W, Vanrenterghem Y, Woude FJ Van de, Verpooten GA:
The pharmacokinetic-pharmacodynamic relationship for
mycophenolate mofetil in renal transplantation. Clin Pharma-
col Ther 1998, 64:672-683.
13. Le Meur Y, Buchler M, Thierry A, Caillard S, Villemain F, Lavaud S,
Etienne I, Westeel PF, de Ligny BH, Rostaing L, Thervet E, Szelag JC,
Rerolle JP, Rousseau A, Touchard G, Marquet P: Individualized
mycophenolate mofetil dosing based on drug exposure sig-
nificantly improves patient outcomes after renal transplan-
tation. Am J Transplant 2007, 7:2496-2503.
14. van Gelder T, Silva HT, de Fijter JW, Budde K, Kuypers D, Tyden G,
Lohmus A, Sommerer C, Hartmann A, Le MY, Oellerich M, Holt DW,
Tonshoff B, Keown P, Campbell S, Mamelok RD: Comparing myc-
ophenolate mofetil regimens for de novo renal transplant
recipients: the fixed-dose concentration-controlled trial.
Transplantation 2008, 86:1043-1051.
15. Glander P, Hambach P, Braun KP, Fritsche L, Giessing M, Mai I,
Einecke G, Waiser J, Neumayer HH, Budde K: Pre-transplant ino-
sine monophosphate dehydrogenase activity is associated
with clinical outcome after renal transplantation. Am J Trans-
plant 2004, 4:2045-2051.
16. Vethe NT, Bremer S, Rootwelt H, Bergan S: Pharmacodynamics
of mycophenolic acid in CD4+ cells: A single-dose study of
IMPDH and purine nucleotide responses in healthy individu-
als. Ther Drug Monit 2008, 30:647-655.
17. Sanquer S, Breil M, Baron C, Dhamane D, Astier A, Lang P: Induction
of inosine monophosphate dehydrogenase activity after
long-term treatment with mycophenolate mofetil. Clin Phar-
macol Ther 1999, 65:640-648.
18. Weigel G, Griesmacher A, Zuckermann AO, Laufer G, Mueller MM:
Effect of mycophenolate mofetil therapy on inosine mono-
phosphate dehydrogenase induction in red blood cells of
heart transplant recipients. Clin Pharmacol Ther 2001,
69:
137-144.
19. Vethe NT, Mandla R, Line PD, Midtvedt K, Hartmann A, Bergan S:
Inosine monophosphate dehydrogenase activity in renal allo-
graft recipients during mycophenolate treatment. Scand J Clin
Lab Invest 2006, 66:31-44.
20. Sanquer S, Maison P, Tomkiewicz C, Maquin-Mavier I, Legendre C,
Barouki R, Lang P: Expression of inosine monophosphate dehy-
drogenase type I and type II after mycophenolate mofetil
treatment: a 2-year follow-up in kidney transplantation. Clin
Pharmacol Ther 2008, 83:328-335.
21. Larsen CP, Pearson TC, Adams AB, Tso P, Shirasugi N, Strobertm E,
Anderson D, Cowan S, Price K, Naemura J, Emswiler J, Greene J,
Turk LA, Bajorath J, Townsend R, Hagerty D, Linsley PS, Peach RJ:
Rational development of LEA29Y (belatacept), a high-affin-
ity variant of CTLA4-Ig with potent immunosuppressive
properties. Am J Transplant 2005, 5:443-453.
22. Vincenti F, Larsen C, Durrbach A, Wekerle T, Nashan B, Blancho G,
Lang P, Grinyo J, Halloran PF, Solez K, Hagerty D, Levy E, Zhou W,
Natarajan K, Charpentier B: Costimulation blockade with
belatacept in renal transplantation. N Engl J Med 2005,
353:770-781.
23. Cattaneo D, Merlini S, Zenoni S, Baldelli S, Gotti E, Remuzzi G, Perico
N: Influence of co-medication with sirolimus or cyclosporine
on mycophenolic acid pharmacokinetics in kidney transplan-
tation. Am J Transplant 2005, 5:2937-2944.
24. van Gelder T, Klupp J, Barten MJ, Christians U, Morris RE: Compar-
ison of the effects of tacrolimus and cyclosporine on the
pharmacokinetics of mycophenolic acid. Ther Drug Monit 2001,
23:119-128.
25. Study of Belatacept in Subjects Who Are Undergoing a
Renal Transplant [ />NCT00114777?term=belatacept&rank=8]
26. Racusen LC, Solez K, Colvin RB, Bonsib SM, Castro MC, Cavallo T,
Croker BP, Demetris AJ, Drachenberg CB, Fogo AB, Furness P,
Gaber LW, Gibson IW, Glotz D, Goldberg JC, Grande J, Halloran PF,
Hansen HE, Hartley B, Hayry PJ, Hill CM, Hoffman EO, Hunsicker LG,
Lindblad AS, Yamaguchi Y: The Banff 97 working classification of
renal allograft pathology. Kidney Int 1999, 55:713-723.
27. Vethe NT, Bergan S: Determination of inosine monophosphate
dehydrogenase activity in human CD4+ cells isolated from
whole blood during mycophenolic acid therapy. Ther Drug
Monit 2006, 28:608-613.
28. Bremer S, Rootwelt H, Bergan S: Real-time PCR determination
of IMPDH1 and IMPDH2 expression in blood cells. Clin Chem
2007, 53:1023-1029.
Additional file 1
IMPDH activity and IMPDH1 expression in patients on MMF therapy
compared to healthy individuals*. Data represent median (range)
IMPDH activity and IMPDH1 expression in CD4+ cells from patients on
MMF therapy (1, 2 and 13 weeks posttransplant) and healthy individu-
als.
Click here for file
[ />5876-7-64-S1.doc]
Publish with BioMed Central and every
scientist can read your work free of charge
"BioMed Central will be the most significant development for
disseminating the results of biomedical research in our lifetime."
Sir Paul Nurse, Cancer Research UK
Your research papers will be:
available free of charge to the entire biomedical community
peer reviewed and published immediately upon acceptance
cited in PubMed and archived on PubMed Central
yours — you keep the copyright
Submit your manuscript here:
/>BioMedcentral
Journal of Translational Medicine 2009, 7:64 />Page 14 of 14
(page number not for citation purposes)
29. Bremer S, Vethe NT, Rootwelt H, Bergan S: Expression of
IMPDH1 is regulated in response to mycophenolate concen-
tration. Int Immunopharmacol 2009, 9:173-180.
30. Svensson JO, Brattstrom C, Sawe J: A simple HPLC method for
simultaneous determination of mycophenolic acid and myc-
ophenolic acid glucuronide in plasma. Ther Drug Monit 1999,
21:322-324.
31. van Hest RM, Mathot RA, Pescovitz MD, Gordon R, Mamelok RD, van
Gelder T: Explaining variability in mycophenolic acid expo-
sure to optimize mycophenolate mofetil dosing: a popula-
tion pharmacokinetic meta-analysis of mycophenolic acid in
renal transplant recipients. J Am Soc Nephrol 2006, 17:871-880.
32. Hesselink DA, van Hest RM, Mathot RA, Bonthuis F, Weimar W, de
Bruin RW, van Gelder T: Cyclosporine interacts with mycophe-
nolic acid by inhibiting the multidrug resistance-associated
protein 2. Am J Transplant 2005, 5:987-994.
33. Bullingham RE, Nicholls AJ, Kamm BR: Clinical pharmacokinetics
of mycophenolate mofetil. Clin Pharmacokinet 1998, 34:429-455.
34. van Gelder T, Shaw LM: The rationale for and limitations of
therapeutic drug monitoring for mycophenolate mofetil in
transplantation. Transplantation 2005, 80:S244-S253.
35. Glesne DA, Collart FR, Huberman E: Regulation of IMP dehydro-
genase gene expression by its end products, guanine nucle-
otides. Mol Cell Biol 1991, 11:5417-5425.
36. Escobar-Henriques M, Daignan-Fornier B: Transcriptional regula-
tion of the yeast gmp synthesis pathway by its end products.
J Biol Chem 2001, 276:1523-1530.
37. Vannozzi F, Filipponi F, Di Paolo A, Danesi R, Urbani L, Bocci G, Cat-
alano G, De Simone P, Mosca F, Del Tacca M: An exploratory
study on pharmacogenetics of inosine-monophosphate
dehydrogenase II in peripheral mononuclear cells from liver-
transplant recipients. Transplant Proc 2004, 36:2787-2790.
38. Bowne SJ, Sullivan LS, Blanton SH, Cepko CL, Blackshaw S, Birch DG,
Hughbanks-Wheaton D, Heckenlively JR, Daiger SP: Mutations in
the inosine monophosphate dehydrogenase 1 gene
(IMPDH1) cause the RP10 form of autosomal dominant
retinitis pigmentosa. Hum Mol Genet 2002, 11:559-568.
39. Gu JJ, Spychala J, Mitchell BS: Regulation of the human inosine
monophosphate dehydrogenase type I gene. Utilization of
alternative promoters. J Biol Chem 1997, 272:4458-4466.
40. Carr SF, Papp E, Wu JC, Natsumeda Y: Characterization of
human type I and type II IMP dehydrogenases. J Biol Chem
1993, 268:27286-27290.
41. Chavez H, Beaudreuil S, Abbed K, Taoufic Y, Kriaa F, Charpentier B,
Durrbach A: Absence of CD4CD25 regulatory T cell expan-
sion in renal transplanted patients treated in vivo with
Belatacept mediated CD28-CD80/86 blockade. Transpl Immu-
nol 2007, 17:243-248.
42. Ndejembi MP, Teijaro JR, Patke DS, Bingaman AW, Chandok MR,
Azimzadeh A, Nadler SG, Farber DL: Control of memory CD4 T
cell recall by the CD28/B7 costimulatory pathway. J Immunol
2006, 177:7698-7706.
43. Wang J, Yang JW, Zeevi A, Webber SA, Girnita DM, Selby R, Fu J,
Shah T, Pravica V, Hutchinson IV, Burckart GJ: IMPDH1 gene pol-
ymorphisms and association with acute rejection in renal
transplant patients. Clin Pharmacol Ther 2008, 83:711-717.
44. Grinyo J, Vanrenterghem Y, Nashan B, Vincenti F, Ekberg H, Lind-
paintner K, Rashford M, Nasmyth-Miller C, Voulgari A, Spleiss O, Tru-
man M, Essioux L: Association of four DNA polymorphisms
with acute rejection after kidney transplantation. Transpl Int
2008, 21:879-891.