báo cáo hóa học:" yuDetecting the percent of peripheral blood mononuclear cells displaying p-STAT-3 in malignant glioma patients" pot
Bạn đang xem bản rút gọn của tài liệu. Xem và tải ngay bản đầy đủ của tài liệu tại đây (411.19 KB, 9 trang )
BioMed Central
Page 1 of 9
(page number not for citation purposes)
Journal of Translational Medicine
Open Access
Research
yuDetecting the percent of peripheral blood mononuclear cells
displaying p-STAT-3 in malignant glioma patients
William Humphries
†1
, Yongtao Wang
†1
, Wei Qiao
2
, Chantal Reina-Ortiz
1
,
Mohamed K Abou-Ghazal
1
, Lamonne M Crutcher
1
, Jun Wei
1
, Ling-
Yuan Kong
1
, Raymond Sawaya
1
, Ganesh Rao
1
, Jeffrey Weinberg
1
,
Sujit S Prabhu
1
, Gregory N Fuller
3
and Amy B Heimberger*
1
Address:
1
Department of Neurosurgery, The University of Texas M. D. Anderson Cancer Center, Houston, TX, USA,
2
Department of Biostatistics,
The University of Texas M. D. Anderson Cancer Center, Houston, TX, USA and
3
Department of Pathology, The University of Texas M. D. Anderson
Cancer Center, Houston, TX, USA
Email: William Humphries - ; Yongtao Wang - ; Wei Qiao - ;
Chantal Reina-Ortiz - ; Mohamed K Abou-Ghazal - ;
Lamonne M Crutcher - ; Jun Wei - ; Ling-Yuan Kong - ;
Raymond Sawaya - ; Ganesh Rao - ; Jeffrey Weinberg - ;
Sujit S Prabhu - ; Gregory N Fuller - ; Amy B Heimberger* -
* Corresponding author †Equal contributors
Abstract
Background: The signal transducer and activator of transcription 3 (STAT-3) is frequently
overexpressed in cancer cells, propagates tumorigenesis, and is a key regulator of immune
suppression in cancer patients. The presence of phosphorylated STAT-3 (p-STAT-3) in the tumor
can induce p-STAT-3 in tumor-associated immune cells that can return to the circulatory system.
We hypothesized that the number of peripheral blood mononuclear cells (PBMCs) displaying p-
STAT-3 would be increased in glioma patients, which would correlate with the extent of tumor-
expressed p-STAT-3, and that higher p-STAT-3 levels in peripheral blood would correlate with a
higher fraction of immune-suppressive regulatory T cells (Tregs).
Methods: We measured the percentage of PBMCs displaying p-STAT-3 in 19 healthy donors and
45 patients with primary brain tumors. The level of p-STAT-3 in tumor tissue was determined by
immunohistochemistry. The degree of immune suppression was determined based on the fraction
of Tregs in the CD4 compartment.
Results: Healthy donors had 4.8 ± 3.6% of PBMCs that expressed p-STAT-3, while the mean
proportion of PBMCs displaying p-STAT-3 in patients with GBM was 11.8 ± 13.5% (P = 0.03). We
did not observe a correlation by Spearman correlation between the degree of p-STAT-3 levels in
the tumor and the percent of PBMCs displaying p-STAT-3. Furthermore, the percent of PBMCs
displaying p-STAT-3 in glioma patients was not directly correlated with the fraction of Tregs in the
CD4 compartment.
Conclusion: We conclude that the percent of PBMCs displaying p-STAT-3 may be increased in
malignant glioma patients.
Published: 9 November 2009
Journal of Translational Medicine 2009, 7:92 doi:10.1186/1479-5876-7-92
Received: 24 June 2009
Accepted: 9 November 2009
This article is available from: />© 2009 Humphries et al; licensee BioMed Central Ltd.
This is an Open Access article distributed under the terms of the Creative Commons Attribution License ( />),
which permits unrestricted use, distribution, and reproduction in any medium, provided the original work is properly cited.
Journal of Translational Medicine 2009, 7:92 />Page 2 of 9
(page number not for citation purposes)
Background
Malignant brain tumors have the capability to evade
immune surveillance and impede antitumor immune
responses, which may lead to continued growth and
increased malignancy. In many malignancies, the signal
transducer and activator of transcription 3 (STAT-3) plays
an integral role in modulating oncogenesis, inhibiting
apoptosis, and suppressing immunity [1,2]. STAT-3 has
been found to be constitutively activated in 50-90% of all
malignant tumors, including 53% of anaplastic astrocyto-
mas and 53% of glioblastomas [3]. In gliomas, cytokines,
such as interleukin (IL)-6 (IL-6) [4,5] and epidermal
growth factor [5], can cause subsequent phosphorylation
and activation of STAT-3. The phosphorylated STAT-3 (p-
STAT-3) then translocates into the nucleus and induces a
variety of transcriptional factors that propagate tumori-
genesis [1] and up-regulate tumor-mediated immunosup-
pressive factors [2]. These factors include IL-10 [6,7] that
adversely influences Th1-mediated cytotoxic immune
responses at multiple levels and is essential for regulatory
T cells (Tregs) function [8,9], vascular endothelial growth
factor [10] that inhibits dendritic cell maturation and acti-
vation by inhibiting co-stimulatory molecule expression
[11], PGE
2
[12] that induces the immune suppressive
Th17 cell [13], and TGF-β [14] that induces Tregs, inhibits
T cell proliferation and down-modulates the IL-2 receptor.
These STAT-3-regulated tumor secreted factors then acti-
vate STAT-3 in diverse immune cells [15] including mac-
rophages and monocytes [16-18], dendritic cells [2], T
cells [19], and Tregs [20]. More specifically, IL-2 has been
shown to regulate FoxP3 expression in human
CD4
+
CD25
+
Tregs by inducing STAT-3 binding of the first
intron of the FoxP3 gene [20]. Because STAT-3 target genes
encode many factors that activate STAT-3 in the immune
cells, possibly a feed-forward mechanism for activation of
STAT-3 in both the tumor cells and the immune cells
within the tumor microenvironment is initiated as pro-
posed by Kortylewski [21]. The cumulative response of
activating the STAT3 pathway in the immune system is
anti-inflammatory by a combination of suppressing mac-
rophage activation [22,23], reducing the cellular cytotox-
icity of natural killer cells and neutrophils, reducing the
expression of major histocompatibility complex (MHC)
II, CD80, CD86, and IL-12 in dendritic cells rendering
them unable to stimulate T cells and generate antitumor
immunity [15] and enhancing Treg activity [20]. Within
the immune cells, γ-IFN has been shown to be down-reg-
ulated by p-STAT-3 [15] and accordingly γ-IFN levels have
been shown to be decreased in glioma patient PBMCs
[24]. The ablation of STAT-3 activity in only the immune
cells results in marked antitumor effects in vivo, indicating
that STAT-3 expression within the immune cells is what
restrains antitumor eradication [15]. Furthermore, we
have shown that p-STAT-3 blockade in immune cells
restores immune responses [25] and inhibits Treg induc-
tion [26]. Overall, p-STAT-3 regulates immune suppres-
sion and tumor progression via multiple redundant
mechanisms [18,22,23,27,28].
Primed CD8
+
cytotoxic T cells have been shown to gain
central nervous system (CNS) access [29,30], and
immune cells are present in tumors and the surrounding
brain parenchyma [30]. These immune cells may then
traffic outside the CNS [31,32] by following the lymphatic
drainage through the brain via the Virchow-Robin spaces
to lymphatics beneath the cribriform plate, ultimately
reaching the cervical lymph nodes [33,34]. Thus, CNS
tumor-elaborated substances are capable of reaching the
immune system and peripheral blood stream. Therefore,
we hypothesized that the percent of peripheral blood
mononuclear cells (PBMCs) displaying p-STAT-3 may be
increased in malignant glioma patients. The p-STAT-3 lev-
els may be increased in the peripheral blood in two ways:
(1) a tumor with p-STAT-3 would subsequently induce p-
STAT-3 in tumor-associated immune cells, which would
then reenter systemic circulation or (2) p-STAT-3 tran-
scriptional induced tumor-secreted products could induce
p-STAT-3 in immune cells in the cervical lymph nodes,
which then are detected in the peripheral circulation.
Therefore, we measured p-STAT-3 in glioma patients'
peripheral blood mononuclear cells (PBMCs) and com-
pared these levels to those of healthy donors. We also
tested the hypothesis that the level of p-STAT-3 in a tumor
would correlate with the percent of PBMCs displaying p-
STAT-3. To evaluate whether the percent of PBMCs dis-
playing p-STAT-3 correlated with immune suppression,
we tested for a correlation between the percent of PBMCs
displaying p-STAT-3 and the fraction of enhanced Tregs in
the systemic circulation [35] especially since p-STAT-3
binds to the first intron of the FoxP3 gene [20] and
because STAT-3 inhibitors have been shown to inhibit
Tregs [26,36].
Materials and methods
Acquisition of peripheral blood and tumor specimens
Peripheral blood samples (N = 45) were collected from
patients prospectively, usually intraoperatively before
skin incision and after the administration of 10 mg of dex-
amethasone, or during a routine clinic visit during a 1 year
time period (3/3/08-2/18/09). Eligible participants
included any glioma patients undergoing surgical resec-
tion or treatment at The University of Texas M. D. Ander-
son Cancer Center and their tumor pathology was
characterized by a neuropathologist at The University of
Texas M. D. Anderson Cancer Center according to the
2007 criteria of the World Health Organization (WHO)
[37]. This study was conducted under protocol # LAB03-
0687, which was approved by the institutional review
board of M. D. Anderson Cancer Center, and informed
consent was obtained. Since M. D. Anderson Cancer
Journal of Translational Medicine 2009, 7:92 />Page 3 of 9
(page number not for citation purposes)
Center is focused exclusively on the oncological patient
population, controls of non-oncological patients under-
going surgery are not routinely available. The normal,
healthy volunteers did not undergo surgical procedures
but their blood was collected and transported in an iden-
tical manner compared to the surgical patients.
Isolation of PBMCs and staining for p-STAT-3
Approximately 30-40 mL of peripheral blood was col-
lected in sodium heparin tubes (BD Vacutainer, Becton
Dickinson, Franklin Lakes, NJ) and transported on ice to
our laboratory. Blood samples were then subjected to
density gradient centrifugation using Ficoll-Paque (Amer-
sham Biosciences, Piscataway, NJ). PBMCs were isolated
and washed twice in sterile phosphate-buffered saline
(PBS) solution at 1700 rpm for 5 min. After washing, 20
× 10
6
cells were resuspended in 0.5 mL of PBS. Parafor-
maldehyde (0.5 mL), prewarmed to 37°C, was added to
achieve a final concentration of 2%, and the solution was
incubated for 10 min at 37°C and then chilled on ice for
1 min. Next, 5 × 10
6
cells were transferred into 4 separate
wells of a 96-well U-bottomed plate (Corning Incorpo-
rated, Lowell, MA). To make the cells permeable, we
removed the paraformaldehyde by pelleting the cells at
1500 rpm for 5 min, resuspending them in prechilled
90% methanol, and incubating them on ice for 30 min.
The cells were then pelleted at 1500 rpm in fluorescence-
activated cell sorter (FACS) buffer (PBS with 0.5% bovine
serum albumin) for 2.5 min at 1500 rpm. The cells were
resuspended in 45 μL of FACS buffer/well, and 5 μL of
mouse phycoerythrin (PE)-labeled antihuman p-STAT-3
(Y705) antibody (BD Biosciences, San Jose, CA) was
added. Matched control wells included 5 μL of PE-labeled
IgG2a-κ isotype control (eBioscience, San Diego, CA). The
cells were incubated for 60 min at room temperature and
washed with 200 μL of FACS buffer/well for 2.5 min at
1500 rpm. The cells were then resuspended in 250 μL of
FACS buffer/well and transferred to FACS tubes for flow
cytometry (FACSCalibur; BD Biosciences). Duplicate
specimens were parallel processed in most cases, but
insufficient collection of intraoperative blood sometimes
precluded this analysis.
Determination of Tregs in peripheral blood of patients
withgliomas
For subset analysis, after we became proficient at analyz-
ing PBMC p-STAT-3, after the isolation of PBMCs as
described above, additional aliquots of approximately 2.5
× 10
6
cells were plated into duplicate wells of 96-well V-
bottomed plates. The cells were then centrifuged at 1500
rpm for 2.5 min, after which they were washed twice with
FACS buffer at 1500 rpm for 2.5 min. Surface staining was
done using 5 μL of FITC labeled antihuman CD4
(Pharmingen, San Diego, CA) in 45 μL of FACS buffer and
5 μL of APC-labeled antihuman CD25 (Pharmingen) for
15 min at 4°C. Cells were then washed with FACS buffer
and permeabilized with 1:3 Cytofix/Cytoperm (eBio-
science) for 2 h at 4°C. The cells were then centrifuged at
1500 rpm for 2.5 min and washed once with FACS buffer
and 3 times with 1:3 PermWash (eBioscience). The cells
were stained intracellularly with 5 μL PE-antihuman
FoxP3 antibody (eBioscience) diluted in 45 μL PermWash
for 30 min at 4°C. For an isotype control, 5 μL PE-anti-
mouse IgG antibody (eBioscience) diluted in 45 μL Per-
mWash was added to matched wells. Cells were washed
with 200 μL PermWash (BD Biosciences) and then with
200 μL FACS buffer, and then were transferred into FACS
tubes for flow cytometry analysis. The calculated Treg frac-
tion was designated as the number of CD4
+
CD25
+
FoxP3
+
cells divided by the total CD4
+
population.
Immunohistochemical analysis of p-STAT-3 in gliomas
After formalin-fixed, paraffin-embedded sections of the
gliomas were deparaffinized in xylene, they were rehy-
drated in ethanol. Endogenous peroxidase was blocked
with 0.3% hydrogen peroxide/methanol for 10 min at
room temperature before antigen retrieval was begun.
Antigen retrieval for p-STAT-3 consisted of immersing the
sections in a citrate-buffered solution (pH 6.0) and heat-
ing them in a microwave oven for 20 min. The sections
were then cooled to room temperature for 40 min. After
blocking with a protein-block serum-free solution
(DAKO, Carpinteria, CA), anti-p-STAT-3 (tyrosine
705
)
antibody (1:50; Cell Signaling Technology, Danvers, MA,
that recognizes the same epitope as Y705) was added, and
specimens were incubated overnight in a humidified box
at 4°C. Slides were secondarily stained with biotin-
labeled secondary antibody (biotinylated link universal
solution) (DAKO) for 60 min at room temperature.
Finally, streptavidin-horseradish peroxidase (DAKO) was
added, and slides were incubated for 30 min at room tem-
perature. Diaminobenzidine (DAKO) was used as the
chromogen, and color development was stopped by gen-
tly dipping slides into distilled water. The nuclei were then
counterstained with hematoxylin. A glioma tissue micro-
array [3] served as a positive control for p-STAT-3 staining.
The negative control was created by omitting the primary
antibody from the immunohistochemical analysis and
replacing it with the protein-block serum-free solution.
Three independent observers (WH, YW, GNF) quantita-
tively evaluated p-STAT-3 by analyzing the core of each
specimen using high-power fields (maximum: × 40 objec-
tive and × 10 eyepiece, Axioskop 40, Carl Zeiss, Inc). Each
observer recorded the absolute number of tumor cells
staining positive for nuclear p-STAT-3 per × 200 high-
power field. The endothelial cells and infiltrating immune
cells displaying p-STAT-3 were not included in this
number. If there were discrepancies between observers'
recorded numbers, the observers recounted the number of
Journal of Translational Medicine 2009, 7:92 />Page 4 of 9
(page number not for citation purposes)
positively stained cells in each specimen; if they still disa-
greed, the neuropathologist (GNF) conducted the final
arbitration.
Statistical analysis
For each specimen, we attempted to analyze duplicate
samples to measure the percentage of PBMCs displaying
p-STAT-3. The sample size is denoted as N and the
number of measurements is represented as n. Mixed mod-
els were used to compare differences in the percent of
PBMCs displaying p-STAT-3 between patients with glioma
and healthy donors. In this way, the correlation between
the two samples from each subject was taken into consid-
eration. The Spearman correlation was used to analyze the
association between the Treg fraction and the scatter plot
with Loess smooth curves were presented to demonstrate
the relationship. Comparison of Treg fraction difference
between normal and tumor patients was conducted using
Wilcoxon tests. All computations were carried out in SAS
software (version 9.1; SAS Institute, Cary, NC) and SPLUS
software (version 8.0.;TIBCO, Palo Alto, CA). Values at
which differences were considered statistically significant
were P < 0.05.
Results
Study population
This study included blood samples from 45 patients with
gliomas who were treated at M. D. Anderson. Table 1 sum-
marizes the overall composition of the study group and
includes characteristics of the cohort, including age, gen-
der, Karnofsky performance status score, and pathologic
diagnosis. The glioblastoma multiforme (GBM) cases
were further characterized according to whether the gli-
oma was newly diagnosed, recurrent, or without tumor
progression. The GBM patients without tumor progres-
sion on MRI consisted of two patients undergoing treat-
ment with temozolomide and immunotherapy that were
at least six months from their initial surgery and two
patients undergoing surgical debridement for infection.
One GBM patient undergoing stereotactic biopsy for
determination of radiation necrosis was placed in the
GBM without tumor progression group. The mean age for
the healthy donors was 44 ± 12.8 and 47% were male.
Determination of p-STAT-3 in PBMCs of glioma patients
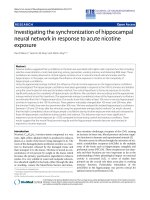
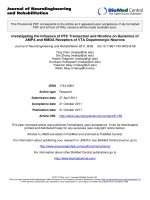
Representative positive specimens are shown in Fig. 1.
Sequential measurements of the same sample over time
demonstrated a loss of p-STAT-3 in fresh specimens after
24 h (data not shown) and in frozen specimens, indicat-
ing samples should be processed and analyzed as soon as
possible after being collected from the patient. The MFI of
p-STAT-3 among samples was similar.
Higher percentage of PBMCs expresses p-STAT-3 in
glioma patients than in healthy donors
The mean percentage of PBMCs displaying p-STAT-3 from
all healthy donors (denoted by the diamonds) (N = 19; n
= 38) was 4.8 ± 3.6%. In all GBM patients (N = 33; n = 66),
whether their disease was newly diagnosed (denoted by
the cross symbol) or recurrent (denoted by the triangles),
the mean number of PBMCs displaying p-STAT-3 was ele-
vated to 11.8 ± 13.5%, which was significantly higher
than that in healthy donors (P = 0.03) (Fig. 2). Among
patients with recurrent GBM (denoted by the triangles) (N
= 13; n = 24), the mean percentage of PBMCs displaying
p-STAT-3 was 18.8 ± 17.1%, which was significantly
higher than that in healthy donors (P = 0.0002). However,
in newly diagnosed GBM patients (N = 15; n = 30) the
mean p-STAT-3 level was 8.4 ± 8.8%, which was not sig-
nificantly different from that of healthy donors (P = 0.3),
although there was a trend toward increased levels in the
GBM group.
Table 1: Patient characteristics across different tumor types
Pathology WHO grade Age KPS Gender
Mean Median (min, max) Median (min, max) Female Male
N% N%
Ganglioglioma II 34.7 ± 3.6 34.7 (32.1, 37.2) 100 (100, 100) 1 50.00 1 50.0
AA/AO III 47.3 ± 8.6 49.4 (29.3, 56.8) 90 (90, 100) 3 30.00 7 70.0
New GBM IV 57.2 ± 12.8 57.4 (26.4, 77.0) 90 (60, 100) 7 46.6 8 53.3
Not Progressing
GBM
IV 54.2 ± 12.9 61.5 (39.3, 61.8) 100 (90, 100) 1 20.0 4 80.0
Recurrent GBM IV 46.4 ± 19.4 47.1 (20.6, 68.9) 80 (50, 100) 4 30.8 9 62.2
WHO World Health Organization; KPS Karnofsky Performance Status
Journal of Translational Medicine 2009, 7:92 />Page 5 of 9
(page number not for citation purposes)
Among grade III glioma patients (denoted by squares)(N
= 10; n = 20; six patients were progressive from grade II
and two were recurrent), the mean percentage of PBMCs
displaying p-STAT-3 was 14.3 ± 9.4%, an elevation that
was also statistically significant (P = 0.02) relative to
healthy donor values. Because of insufficient patient num-
bers, no statistically meaningful conclusion can be drawn
regarding differences in p-STAT-3 levels between newly
diagnosed and recurrent grade III gliomas. Because of the
referral pattern of patients to M. D. Anderson, insufficient
sample numbers were obtained from patients with low-
grade gliomas (denoted by stars), precluding a sufficiently
powered conclusion; however, the low-grade glioma sam-
ples that were analyzed and also drawn during general
anesthesia did not express p-STAT-3 levels above levels
expressed in samples from healthy donors. Additionally,
we did not detect elevations of the mean percentage of
PBMC displaying p-STAT-3 (7.6 + 2.9%)(data not shown)
in patients with a variety of metastasis to the CNS (n = 6;
including four lung carcinomas, one bladder and one
parotid gland), indicating that general anesthesia is not a
contributing factor in the percent of PBMCs displaying p-
STAT-3.
Mean percentage of PBMCs displaying p-STAT-3 in
patients whose GBM is without tumor progression is within
the range of healthy donors
To determine if the mean percentage of PBMCs displaying
p-STAT-3 continued to be elevated in GBM patients who
had undergone gross total resection and whose disease
appeared not to be progressing clinically or on magnetic
resonance imaging (MRI)(denoted by circles), we
obtained peripheral blood from these patients. The mean
percentage of p-STAT-3 displaying PBMCs was 3.9 ± 3.5%,
which was within the range of healthy donors (Fig. 2).
Representative examples of PBMCs isolated from blood sam-ples obtained from a healthy donor, a patient with an anaplas-tic astrocytoma with positive p-STAT-3 expression, and a patient with a recurrent GBM with positive p-STAT-3 expressionFigure 1
Representative examples of PBMCs isolated from
blood samples obtained from a healthy donor, a
patient with an anaplastic astrocytoma with positive
p-STAT-3 expression, and a patient with a recurrent
GBM with positive p-STAT-3 expression. The samples
were fixed in paraformaldehyde, permeabilized, stained with
mouse PE-labeled antihuman p-STAT-3 (Y705) antibody, and
analyzed by FACS. The isotype control is in green.
Expression of p-STAT-3 is enhanced in PBMCs from glioma patientsFigure 2
Expression of p-STAT-3 is enhanced in PBMCs from
glioma patients. PBMCs were isolated from blood samples
obtained from healthy donors (N = 19) and glioma patients (N
= 45). The samples were intracellularly stained with antihu-
man p-STAT-3 and analyzed by FACS. The percentage of p-
STAT-3-positive PBMCs differed significantly between healthy
donors and glioma patients. Abbreviations used: Anaplastic
astrocytoma, AA; Anaplastic oligodendroglioma, AO; Gliob-
lastoma multiforme, GBM; Normal, healthy donor, HD;
Recurrent, REC; No progression, NP.
Journal of Translational Medicine 2009, 7:92 />Page 6 of 9
(page number not for citation purposes)
Percentage of PBMCs displaying p-STAT-3 does not
correlate with the percentage of p-STAT-3 positive tumor
cells in the glioma
To determine if the level of p-STAT-3 positive cells in the
glioma correlated to the mean percent of PBMCs display-
ing p-STAT-3, we performed a subgroup analysis in which
glioma specimens were stained with an antibody against
p-STAT-3 and compared to the same patient's percentage
of p-STAT-3 positive PBMCs. In pair-wise scatter plots
with Loess smooth curves showing the relationship
between the mean percentage of PBMCs displaying p-
STAT-3 and the percentage of tumor cells displaying p-
STAT-3, the Spearman correlation was 0.46 and a nonlin-
ear trend indicated that there was no correlation between
tumor and PBMC p-STAT-3 expression (P = 0.15) (Fig. 3
and Table 2). When excluding the outlier (N = 10), the
Spearmen correlation is 0.51 (P = 0.13).
Percentage of Tregs in the CD4+ lymphocyte population
does not correlate with amount of p-STAT-3 expression
To determine if the percentage of PBMCs displaying p-
STAT-3 correlated with the degree of immune suppression
as measured by the fraction of Tregs in the CD4+ compart-
ment in glioma patients, we measured the percentage of
FoxP3-positive Tregs in the CD4
+
lymphocyte population
in a subset of GBM patients and compared the measure-
ment to the same patient's percentage of p-STAT-3 posi-
tive PBMCs. In pair-wise scatter plots with Loess smooth
curves examining the relationship between the mean per-
cent of PBMCs displaying p-STAT-3 and the Treg fraction,
the Spearman correlation was 0.03 and a nonlinear trend
indicated that there was no correlation between the mean
PBMC p-STAT-3 expression and an enhanced Treg fraction
(P = 0.91) (Fig. 4). In healthy donors, the average fraction
of FoxP3+ positive Tregs in the CD4
+
population was 10 ±
0.02% compared to 19 ± 21.0% in the GBM patient pop-
ulation, indicating that the Treg fraction was elevated in
GBM patients with p value of 0.86
Discussion
In this study, we found that a higher percentage of PBMCs
expressed p-STAT-3 in glioma patients than in healthy
donors. Compared to healthy donors, patients with ana-
plastic astrocytoma (WHO grade III) and recurrent GBM
(WHO grade IV) had statistically significantly higher lev-
els of the percent of PBMCs displaying p-STAT-3. Moreo-
ver, in patients with glioma that were without
progression, p-STAT-3 levels were within the healthy
donor range. These findings suggest that p-STAT-3 levels
may be elevated in PBMCs when a tumor is present but
not when there is no radiographic evidence of a tumor;
however longitudinal data will be needed to correlate
tumor progression and p-STAT-3 expression. One of the
GBM patients whose MRI was questionable for tumor
progression had radiation necrosis confirmed by biopsy;
the mean percent of PBMCs displaying p-STAT-3 in this
patient was 0.1%, suggesting an absence of tumor. This
type of assay may be able to resolve the diagnostic
dilemma of radiation necrosis versus tumor necrosis;
Table 2: Correlation of the percentage of PBMCs displaying p-STAT-3 compared to glioma expression
Pathology % of PBMCs displaying p-STAT-3 % of glioma cells displaying nuclear p-STAT-3
Ganglioglioma 10.6 ± 0 87
Ganglioglioma 0.2 ± 0 33
Recurrent AA 12.8 ± 0.4 60
Newly diagnosed GBM 16.1 ± 0.4 83
Newly diagnosed GBM 0.1 ± 0 47
Newly diagnosed GBM 8.9 ± 0.4 43
Recurrent GBM 6.8 ± 0.4 68
Recurrent GBM 7.6 ± 0.2 70
Recurrent GBM 10.0 ± 0 43
Recurrent GBM 3.1 ± 0 47
Recurrent GBM 26.2 ± 23.7 53
Journal of Translational Medicine 2009, 7:92 />Page 7 of 9
(page number not for citation purposes)
however, this possibility will need to be validated in a sep-
arate study.
A limitation of this assay is that an increase in the mean
percentage of PBMCs displaying p-STAT-3 was not
detected in all cases of malignant gliomas; however, an
elevation in this value during follow-up could alert the cli-
nician that additional diagnostic testing may be indicated.
We do not believe that steroids are a mitigating factor in
the analysis of percentage of PBMCs displaying p-STAT-3
since all of the blood specimens from the surgical patients
were obtained intraoperatively at which time all patients
routinely receive dexamethasone. Within this group, were
patients with both the highest and lowest percentage of
PBMCs displaying p-STAT-3. We can't completely rule out
a role for steroids in the percentage of PBMCs displaying
p-STAT-3 since patients both receiving and not receiving
steroids within the same histology could not be compared
due to the routine administration of intraoperative dex-
amethasone. Furthermore, insufficient numbers of
patients with lower grade tumors receiving similar doses
of steroids precluded a statistically meaningful compari-
son to patients with malignant gliomas. The overall trend
is supportive of a malignant glioma diagnosis playing a
more meaningful role compared to steroids in elevated p-
STAT-3 levels in this study; however, patients with other
types of malignancies also have elevated PBMC p-STAT-3
expression [26] and the PBMC p-STAT-3 levels may be ele-
vated in other medical conditions. Ultimately the percent-
age of PBMCs displaying p-STAT-3 will most likely be
useful as a biomarker to monitor response to treatment to
a variety of anti-STAT-3 agents, such as JSI-124 (cucur-
bitacin I) [38], WP1066 [26], arsenic trioxide [39-41], and
antisense approaches [42], which are in various stages of
preclinical and clinical trial testing.
We and others have shown that p-STAT-3 is upregulated
in the vast majority of malignant gliomas [3,43]. It was
somewhat surprising that the mean percentage of PBMCs
displaying p-STAT-3 did not correlate with the number of
tumor cells displaying p-STAT-3. However, many factors
have been identified that induce p-STAT-3 expression,
including growth factors and cytokines, such as IL-6 [44],
elaborated by reactive astrocytes [45], epidermal growth
factor [43], and Janus kinase 2 [46], and it is uncertain
which of these, either individually or in combination, is
the etiological agent for inducing p-STAT-3 in PBMC.
Alternatively, there may be other yet-unidentified factors
that induce p-STAT-3 in PBMCs. For example, Kortylewski
et al. [47] recently showed that p-STAT-3 signaling in the
tumor microenvironment induces IL-23, which is mainly
produced by tumor-associated macrophages. Tumor-asso-
ciated Tregs express the IL-23 receptor, which activates
STAT-3 in this cell type, leading to upregulation of the
Treg-specific transcription factor FoxP3 and the immuno-
suppressive cytokine IL-10 [47]. Perhaps it is the tumor
expression of IL-23, IL-6, epidermal growth factor or Janus
kinase 2 or an undefined factor that ultimately regulates
the expression of PBMC p-STAT-3 levels, but this was not
determined in our current study.
Pair-wise scatter plots (with Loess smooth curves added) examining the relationship between tumor p-STAT-3 and PBMC p-STAT-3 expressionFigure 3
Pair-wise scatter plots (with Loess smooth curves
added) examining the relationship between tumor p-
STAT-3 and PBMC p-STAT-3 expression. The lack of a
straight trend of the Loess curves indicates that there was
not a correlation between tumor and PBMC expression of p-
STAT-3.
Pair-wise scatter plots (with Loess smooth curves added) examining the relationship between PBMC p-STAT-3 and Treg fraction expressionFigure 4
Pair-wise scatter plots (with Loess smooth curves
added) examining the relationship between PBMC p-
STAT-3 and Treg fraction expression. The lack of a
straight trend of the Loess curves indicates that there was
not a correlation between PBMC expression of p-STAT-3
and the induction of Tregs in malignant glioma patients.
Journal of Translational Medicine 2009, 7:92 />Page 8 of 9
(page number not for citation purposes)
To ascertain if PBMC expression of p-STAT-3 correlated
with the degree of immune suppression, we directed our
attention specifically to the Treg fraction in the CD4 com-
partment since the Treg fraction is elevated in patients
with malignant glioma patients [35]. Furthermore, we
selected this particular marker of immune suppression
because IL-2 has been shown to regulate FoxP3 expression
in human CD4+CD25+ Tregs [48] by inducing STAT-3
binding of the first intron of the FoxP3 gene [20] and
because STAT-3 inhibitors have been shown to inhibit
Tregs [26,36]. However, we did not find a statistically sig-
nificant correlation between PBMC expression of p-STAT-
3 and an increase in the Treg fraction; this is similar to our
previous finding of a lack of correlation between glioma-
expressed p-STAT-3 and the presence of intratumoral
Tregs [3]. Although p-STAT-3 may be a transcriptional fac-
tor related to induction of FoxP3 expression, it may not be
the only factor that influences Treg generation. STAT-3 has
been shown to be a potent regulator of many types of anti-
inflammatory responses, including suppressing macro-
phage activation [22,23,27], natural killer cell and neu-
trophil cytotoxicity, and dendritic cell maturation and
function [15]. Thus, secondary to the redundancy and
multiplicity of immunosuppressive mechanisms that the
p-STAT-3 pathway mediates, it was not entirely surprising
that a single marker of immune suppression (i.e., Tregs)
failed to correlate with PBMC expression of p-STAT-3.
Conclusion
In summary, identifying diagnostic tests that alert us to
the presence or recurrence of cancer in patients is advan-
tageous for treatment and prognosis. An easy-to-perform,
inexpensive blood test affords distinct advantages to the
practicing neuro-oncologist, especially in the confound-
ing conundrum of assessing treatment effects versus gli-
oma progression. Ultimately, we have demonstrated that
the percentage of PBMCs displaying p-STAT-3 may have
utility as a clinical trial biomarker, but larger sample num-
bers will be required to validate the sensitivity and specif-
icity of the assay.
Abbreviations
APC: antigen presenting cell; CNS: central nervous system;
FACS: fluorescence-activated cell sorter; FITC: Fluorescein
isothiocyanate; FoxP3: forkhead box P3; GBM: glioblast-
oma multiforme; MRI: magnetic resonance imaging; N:
sample size; n: number of measurements;PBMC: periph-
eral blood mononuclear cell; PBS: phosphate-buffered
saline; PE: phycoerythrin; p-STAT-3: phosphorylated sig-
nal transducer and activator of transcription 3;STAT-3: sig-
nal transducer and activator of transcription 3; Treg:
regulatory T cells
Competing interests
The authors declare that they have no competing interests.
Authors' contributions
WH, YW, CR-O, MKA-G, L-YK, RW, GNF and ABH con-
tributed to the conception and design of the study. LMC,
RW, GR, JW, SSP and ABH provided materials and
patients for the study. WH, YW, CR-O, MKA-G, JW, L-YK,
GNF, and ABH participated in data collection, and WH,
YW, WQ, CR-O, JW, GFN and ABH participated in the
data analysis and the interpretation of results. WH, YW
and ABH contributed to the writing of the manuscript. All
authors have approved the final version of the manu-
script.
Acknowledgements
This work was supported by grants from the Dr. Marnie Rose Foundation,
the National Brain Tumor Society, and the National Institutes of Health
(R01 CA120813). We would like to thank Adelina Fuentes and Sue Moreau
for their editorial assistance.
References
1. Yu H, Jove R: The STATs of cancer new molecular targets
come of age. Nat Rev Cancer 2004, 4:97-105.
2. Yu H, Kortylewski M, Pardoll D: Crosstalk between cancer and
immune cells: role of STAT3 in the tumour microenviron-
ment. Nat Rev Immunol 2007, 7:41-51.
3. Abou-Ghazal M, Yang DS, Qiao W, Reina-Ortiz C, Wei J, Kong LY,
Fuller GN, Hiraoka N, Priebe W, Sawaya R, Heimberger AB: The
incidence, correlation with tumor-infiltrating inflammation,
and prognosis of phosphorylated STAT3 expression in
human gliomas. Clin Cancer Res 2008, 14:8228-8235.
4. Lau LT, Yu AC: Astrocytes produce and release interleukin-1,
interleukin-6, tumor necrosis factor alpha and interferon-
gamma following traumatic and metabolic injury. J Neuro-
trauma 2001, 18:351-359.
5. Li B, Chang CM, Yuan M, McKenna WG, Shu HK: Resistance to
small molecule inhibitors of epidermal growth factor recep-
tor in malignant gliomas. Cancer Res 2003, 63:7443-7450.
6. Steinbrink K, Wolfl M, Jonuleit H, Knop J, Enk AH: Induction of tol-
erance by IL-10-treated dendritic cells. J Immunol 1997,
159:4772-4780.
7. Williams L, Bradley L, Smith A, Foxwell B: Signal transducer and
activator of transcription 3 is the dominant mediator of the
anti-inflammatory effects of IL-10 in human macrophages. J
Immunol 2004, 172:567-576.
8. DiMeo D, Tian J, Zhang J, Narushima S, Berg DJ: Increased inter-
leukin-10 production and Th2 skewing in the absence of 5-
lipoxygenase. Immunology 2008, 123:250-262.
9. Asseman C, Mauze S, Leach MW, Coffman RL, Powrie F: An essen-
tial role for interleukin 10 in the function of regulatory T
cells that inhibit intestinal inflammation. J Exp Med 1999,
190:995-1004.
10. Niu G, Bowman T, Huang M, Shivers S, Reintgen D, Daud A, Chang
A, Kraker A, Jove R, Yu H: Roles of activated Src and Stat3 sig-
naling in melanoma tumor cell growth. Oncogene 2002,
21:7001-7010.
11. Gabrilovich DI, Chen HL, Girgis KR, Cunningham HT, Meny GM,
Nadaf S, Kavanaugh D, Carbone DP: Production of vascular
endothelial growth factor by human tumors inhibits the
functional maturation of dendritic cells[erratum appears in
Nat Med 1996 Nov;2(11):1267]. Nat Med 1996, 2:1096-1103.
12. Rummel C, Sachot C, Poole S, Luheshi GN: Circulating inter-
leukin-6 induces fever through a STAT3-linked activation of
COX-2 in the brain. Am J Physiol Regul Integr Comp Physiol 2006,
291:R1316-1326.
13. Boniface K, Bak-Jensen KS, Li Y, Blumenschein WM, McGeachy MJ,
McClanahan TK, McKenzie BS, Kastelein RA, Cua DJ, de Waal Malefyt
R: Prostaglandin E2 regulates Th17 cell differentiation and
function through cyclic AMP and EP2/EP4 receptor signal-
ing. J Exp Med 2009, 206:535-548.
14. Kinjyo I, Inoue H, Hamano S, Fukuyama S, Yoshimura T, Koga K,
Takaki H, Himeno K, Takaesu G, Kobayashi T, Yoshimura A: Loss of
Journal of Translational Medicine 2009, 7:92 />Page 9 of 9
(page number not for citation purposes)
SOCS3 in T helper cells resulted in reduced immune
responses and hyperproduction of interleukin 10 and trans-
forming growth factor-β1. J Exp Med 2006, 203:1021-1031.
15. Kortylewski M, Kujawski M, Wang T, Wei S, Zhang S, Pilon-Thomas
S, Niu G, Kay H, Mule J, Kerr WG, et al.: Inhibiting Stat3 signaling
in the hematopoietic system elicits multicomponent antitu-
mor immunity. Nat Med 2005, 11:1314-1321.
16. Matsukawa A, Kudo S, Maeda T, Numata K, Watanabe H, Takeda K,
Akira S, Ito T: Stat3 in resident macrophages as a repressor
protein of inflammatory response. J Immunol 2005,
175:3354-3359.
17. Frisullo G, Angelucci F, Caggiula M, Nociti V, Iorio R, Patanella AK,
Sancricca C, Mirabella M, Tonali PA, Batocchi AP: pSTAT1,
pSTAT3, and T-bet expression in peripheral blood mononu-
clear cells from relapsing-remitting multiple sclerosis
patients correlates with disease activity. J Neurosci Res 2006,
84:1027-1036.
18. Lin T, Bost K: STAT3 activation in macrophages following
infection with Salmonella. Biochem Biophys Res Commun 2004,
321:828-834.
19. Yaroslavskiy B, Watkins SC, Alber S, Steinman RA: Dynamic
changes in p27kip1 variant expression in activated lym-
phocytes. J Cell Biochem 2001, 83:380-389.
20. Zorn E, Nelson EA, Mohseni M, Porcheray F, Kim H, Litsa D, Bellucci
R, Raderschall E, Canning C, Soiffer RJ, et al.: IL-2 regulates FOXP3
expression in human CD4+CD25+ regulatory T cells through
a STAT-dependent mechanism and induces the expansion of
these cells in vivo. Blood 2006, 108:1571-1579.
21. Kortylewski M, Yu H: Role of Stat3 in suppressing anti-tumor
immunity. Curr Opin Immunol 2008, 20:228-233.
22. Lang R, Patel D, Morris JJ, Rutschman RL, Murray PJ: Shaping gene
expression in activated and resting primary macrophages by
IL-10. J Immunol 2002, 169:2253-2263.
23. O'Farrell AM, Liu Y, Moore KW, Mui AL: IL-10 inhibits macro-
phage activation and proliferation by distinct signaling
mechanisms: evidence for Stat3-dependent and -independ-
ent pathways. EMBO J 1998, 17:1006-1018.
24. Urbani F, Maleci A, La Sala A, Lande R, Ausiello CM: Defective
expression of interferon-gamma, granulocyte-macrophage
colony-stimulating factor, tumor necrosis factor alpha, and
interleukin-6 in activated peripheral blood lymphocytes
from glioma patients. J Interferon Cytokine Res 1995, 15:421-429.
25. Hussain SF, Kong LY, Jordan J, Conrad C, Madden T, Fokt I, Priebe
W, Heimberger AB: A novel small molecule inhibitor of signal
transducers and activators of transcription 3 reverses
immune tolerance in malignant glioma patients. Cancer Res
2007, 67:9630-9636.
26. Kong LY, Abou-Ghazal MK, Wei J, Chakraborty A, Sun W, Qiao W,
Fuller GN, Fokt I, Grimm EA, Schmittling RJ, et al.: A novel inhibitor
of signal transducers and activators of transcription 3 activa-
tion is efficacious against established central nervous system
melanoma and inhibits regulatory T cells. Clin Cancer Res 2008,
14:5759-5768.
27. Takeda K, Clausen BE, Kaisho T, Tsujimura T, Terada N, Forster I,
Akira S: Enhanced Th1 activity and development of chronic
enterocolitis in mice devoid of Stat3 in macrophages and
neutrophils. Immunity 1999, 10:39-49.
28. Heimberger AB, Sun W, Kong L-Y, Abou-Ghazal M, Wei J, Gumin J,
Coleman H, Priebe W, Lang FF: Glioblastoma multiforme stem
cells mediate immune suppression that can be inhibited with
JAK2/STAT3 blockade. J Clin Oncol 2008, 26((Suppl, part 1 of
2)15S):.
29. Calzascia T, Masson F, Di Berardino-Besson W, Contassot E,
Wilmotte R, Aurrand-Lions M, Ruegg C, Dietrich PY, Walker PR:
Homing phenotypes of tumor-specific CD8 T cells are pre-
determined at the tumor site by crosspresenting APCs.
Immunity 2005, 22:175-184.
30. Hickey WF, Hsu BL, Kimura H: T-lymphocyte entry into the cen-
tral nervous system. J Neurosci Res 1991, 28:254-260.
31. Williams KC, Hickey WF: Traffic of hematogenous cells
through the central nervous system. Curr Top Microbiol Immunol
1995, 202:221-245.
32. Hickey WF:
Basic principles of immunological surveillance of
the normal central nervous system. GLIA 2001, 36:118-124.
33. Cserr HF, Harling-Berg CJ, Knopf PM: Drainage of brain extracel-
lular fluid into blood and deep cervical lymph and its immu-
nological significance. Brain Pathol 1992, 2:269-276.
34. Cserr HF, Knopf PM: Cervical lymphatics, the blood-brain bar-
rier and the immunoreactivity of the brain: a new view.
Immunol Today 1992, 13:507-512.
35. Fecci PE, Mitchell DA, Whitesides JF, Xie W, Friedman AH, Archer
GE, Herndon JE, Bigner DD, Dranoff G, Sampson JH: Increased reg-
ulatory T-cell fraction amidst a diminished CD4 compart-
ment explains cellular immune defects in patients with
malignant glioma. Cancer Res 2006, 66:3294-3302.
36. Kong LK, Wei J, Sharma AK, Barr J, Abou-Ghazal MK, Fokt I, Wein-
berg J, Rao G, Grimm E, Priebe W, Heimberger AB: A novel phos-
phorylated STAT3 inhibitor enhances T cell cytotoxicity
against melanoma through inhibition of regulatory T cells.
Cancer Immunol Immunother 2008, 58:1023-1032.
37. Louis DN, Ohgaki H, Wiestler OD, Cavenee WK, Burger PC, Jouvet
A, Scheithauer BW, Kleihues P: The 2007 WHO classification of
tumours of the central nervous system[erratum appears in
Acta Neuropathol. 2007 Nov;114(5):547]. Acta Neuropathol
2007, 114:97-109.
38. Fujita M, Zhu X, Sasaki K, Ueda R, Low KL, Pollack IF, Okada H: Inhi-
bition of STAT3 promotes the efficacy of adoptive transfer
therapy using type-1 CTLs by modulation of the immunolog-
ical microenvironment in a murine intracranial glioma. J
Immunol 2008, 180:2089-2098.
39. Bael TE, Peterson BL, Gollob JA: Phase II trial of arsenic trioxide
and ascorbic acid with temozolomide in patients with meta-
static melanoma with or without central nervous system
metastases. Melanoma Res 2008, 18:147-151.
40. Kim KB, Bedikian AY, Camacho LH, Papadopoulos NE, McCullough
C: A phase II trial of arsenic trioxide in patients with meta-
static melanoma. Cancer 2005, 104:1687-1692.
41. Tarhini AA, Kirkwood JM, Tawbi H, Gooding WE, Islam MF, Agarwala
SS:
Safety and efficacy of arsenic trioxide for patients with
advanced metastatic melanoma. Cancer 2008, 112:1131-1138.
42. Leong PL, Andrews GA, Johnson DE, Dyer KF, Xi S, Mai JC, Robbins
PD, Gadiparthi S, Burke NA, Watkins SF, Grandis JR: Targeted inhi-
bition of Stat3 with a decoy oligonucleotide abrogates head
and neck cancer cell growth. Proc Natl Acad Sci USA 2003,
100:4138-4143.
43. Mizoguchi M, Betensky RA, Batchelor TT, Bernay DC, Louis DN,
Nutt CL: Activation of STAT3, MAPK, and AKT in malignant
astrocytic gliomas: correlation with EGFR status, tumor
grade, and survival. J Neuropathol Exp Neurol 2006, 65:1181-1188.
44. Nakajima K, Yamanaka Y, Nakae K, Kojima H, Ichiba M, Kiuchi N,
Kitaoka T, Fukada T, Hibi M, Hirano T: A central role for Stat3 in
IL-6-induced regulation of growth and differentiation in M1
leukemia cells. EMBO J 1996, 15:3651-3658.
45. Ghirnikar RS, Lee YL, Eng LF: Inflammation in traumatic brain
injury: role of cytokines and chemokines. Neurochem Res 1998,
23:329-340.
46. Winston LA, Hunter T: JAK2, Ras, and Raf are required for acti-
vation of extracellular signal-regulated kinase/mitogen-acti-
vated protein kinase by growth hormone. J Biol Chem 1995,
270:30837-30840.
47. Kortylewski M, Xin H, Kujawski M, Lee H, Liu Y, Harris T, Drake C,
Pardoll D, Yu H: Regulation of the IL-23 and IL-12 balance by
Stat3 signaling in the tumor microenvironment. Cancer Cell
2009, 15:114-123.
48. Fontenot JD, Rudensky AY: A well adapted regulatory contriv-
ance: regulatory T cell development and the forkhead family
transcription factor Foxp3. Nat Immunol 2005, 6:331-337.