Báo cáo hóa học: " Prognostic impact of ZAP-70 expression in chronic lymphocytic leukemia: mean fluorescence intensity T/B ratio versus percentage of positive cells" pot
Bạn đang xem bản rút gọn của tài liệu. Xem và tải ngay bản đầy đủ của tài liệu tại đây (942.39 KB, 11 trang )
RESEARC H Open Access
Prognostic impact of ZAP-70 expression in
chronic lymphocytic leukemia: mean fluorescence
intensity T/B ratio versus percentage of positive
cells
Francesca M Rossi
1
, Maria Ilaria Del Principe
2
, Davide Rossi
3
, Maria Irno Consalvo
2
, Fabrizio Luciano
2
,
Antonella Zucchetto
1
, Pietro Bulian
1
, Riccardo Bomben
1
, Michele Dal Bo
1
, Marco Fangazio
3
, Dania Benedetti
1
,
Massimo Degan
1
, Gianluca Gaidano
3
, Giovanni Del Poeta
2†
, Valter Gattei
1*†
Abstract
Background: ZAP-70 is an independent negative prognostic marker in chronic lymphocytic leukemia (CLL). Usually,
its expression is investigated by flow cytometric protocols in which the percentage of ZAP-70 positive CLL cells is
determined in respect to isotypic control (ISO-method) or residual ZAP-70 positive T cells (T-method). These
methods, however, beside suffering of an inherent subjectivity in their application, may give discordant results in
some cases. The aim of this study was to assess the prognostic significance of these methods in comparison with
another in which ZAP-70 expression was evaluated as a Mean-Fluorescence-Intensity Ratio between gated T and
CLL cells (T/B Ratio-method).
Methods: Cytometric files relative to ZAP-70 determination according to the three readouts were retrospectively
reviewed on a cohort of 173 patients (test set), all with complete clinical and biological prognostic assessment and
time-to-treatment (TTT) available. Findings were then validated in an independent cohort of 341 cases from a
different institution (validation set).
Results: The optimal prognostic cut-offs for ZAP-70 expression were selected at 11% (ISO-method) or 20% of
positive cells (T-method), as well as at 3.0 (T/B Ratio-method) in the test set; these cut-offs yielded 66, 60 and 73
ZAP-70
+
cases, respectively. Univariate analyses resulted in a better separation of ZAP-70
+
vs. ZAP-70
-
CLL patients
utilizing the T/B Ratio, compared to T- or ISO-methods. In multivariate analyses which included the major clinical
and biological prognostic markers for CLL, the prognostic impact of ZAP-70 appeared stronger when the T/B-Ratio
method was applied. These findings were confirmed in the validation set, in which ZAP-70 expression, evaluated
by the T- (cut-off = 20%) or T/B Ratio- (cut-off = 3.0) methods, yielded 180 or 127 ZAP-70
+
cases, respectively.
ZAP-70
+
patients according to the T/B Ratio-method had shorter TTT, both if compared to ZAP-70
-
CLL, and to
cases classified ZAP-70
+
by the T-method only.
Conclusions: We suggest to evaluate ZAP-70 expression in routine settings using the T/B Ratio-method, given the
operator and laboratory independent feature of this approach. We propose the 3.0 T/B Ratio value as optimal cut-
off to discriminate ZAP-70
+
(T/B Ratio less than 3.0) from ZAP-70
-
(T/B Ratio more/equal than 3.0) cases.
* Correspondence:
† Contributed equally
1
Clinical and Experimental Onco-Hematology Unit, Centro di Riferimento
Oncologico, I.R.C.C.S., Aviano (PN), Italy
Rossi et al. Journal of Translational Medicine 2010, 8:23
/>© 2010 Rossi et al; licensee BioMed Central Ltd. This is an Open Access article distributed under the terms of the Creative Commons
Attribution L icense ( which permits unrestricted use, distribution, and rep rodu ction in
any medium, provided the original wor k is properly cited.
Background
The T cell specific zeta-associated protein 70 (ZAP-70),
first identified by gene expression profiling of chronic
lymphocytic leukemia (CLL) cells [1], has been the focus
of many studies in the last few years, due to the ability
of this molecule to act as an independent prognostic
marker in CLL, when its expression is investigated by
flow cytometry [2-5].
At least two approaches are currently employed to
define ZAP-70 positivity in CLL by flow cytometry. The
first approach is based on the signal obtained using an
isotype-matched antibody as negative control [3,4]
Accordingly, a CLL sample is defined as ZAP-70 posi-
tive when at least 20% of CLL cells have a signal exceed-
ing that of isotypic control. The second approach is
based on the expression of ZAP-70 in normal T cells,
that constitutively express the protein and hence are uti-
lized as an internal positive control. Following this strat-
egy, a CLL sample is defined as ZAP-70 positive when
at least 20% of CLL cells express ZAP-70 at levels com-
parable to those found in the residual T cell component
[2,6] Given the different readouts utilized to define
ZAP-70 positivity in CLL, it is not unexpected that a
fraction of cases may result discordant when both
approaches are applied to the same cohort of patients
[7]. In particular, ZAP-70 expression intensity by T cells
has been found to influence the evaluation of ZAP-70
positivity by CLL cells when the latter method is
employed [6,7]. However, both approaches indistinctly
suffer of an inherent variability, due to subjectivity in
cursor placement to determine the percentage of ZAP-
70 positive cells. To overcome the latter issue, subse-
quent reports suggested to evaluate ZAP-70 expression
with methods relying upon evaluation of mean fluores-
cence intensity (MFI) values, as measured in the context
of both CLL cells and residual normal B or T cells,
rather than computing the percentage of p ositive cells
[6,8-15]. Notably, these methods have been demon-
strated to be more re producible in multicenter compari-
sons, and more ea sily adaptable to thawed m aterial
[8,14,15].
In the present study, we used a test and validation
strategy to evaluate the clinical impact of ZAP-70
expression, as determined by computing the ratio
between MFI values separately obtained on T and CLL
cells (T/B Ratio-method). As a test set, we took advan-
tage of a consecutive series of 173 CLL cases, all with a
complete clinical and biological prognostic assessment.
Methods
Patient characteristics and prognostic assessment
This study analyzed two separate cohorts of peripheral
blood (PB) samples of untreated CLL patients overall
accounting for 514 cases. Diagnosis of CLL was con-
firmed by morphology and cytometric immunopheno-
type, according to the recently published guidelines
[16,17]. The first cohort (hereafter “test set”)included
173 patients enrolled at the Division of Hematology,
University of Eastern Piedmont, Novara. Samples w ere
79 females and 94 males, with a median age of 70
(rang e 42-91). A complete clinical and biological assess-
ment was a vailable for all samples, including Rai stage
at diagnosis, b2-microglobulin, interphase fluorescence
in situ hybridization (FISH) analysis, immunoglobulin
heavy chain variable (IGHV) genes mutational status,
and flow cytometric analysis of CD38 and CD49d
expression. The second cohort (hereafter “validation
set” ) included 341 patients enrolled at the Division of
Hematology, S. Eugenio Hospital and University of Tor
Vergata, Rome. These patients were 152 females and
189 males, with a median age of 65 (range 33-89).
Cytogeneticabnormalitiesweredetectedbystandard
interphase FISH carried out with locus-specific (on
chromosomes 11, 13 and 17) or a-satellite DNA (on
chromosome 12) Vysis probes (Abbott, London, UK)
[18]. IGHV genes mutational status was analyzed as
extensively described in previous reports by our groups
[19,20] Flow cytometric analyses of CD38 and CD49d
were done as previously described [18], using the cut-off
point of 30% of positive cells for both markers
[18,21-23]. Patients provided informed consent in accor-
dance with local Internal Review Board requirements
and Declaration of Helsinki.
Flow cytometric analysis of ZAP-70 expression
All flow cytometric detections of ZAP-7 0 expression in
PB samples belonging to the test set were performed at
the Clinical and Experimental Onco-Hematology Unit of
the Centro di Riferimento Oncologico (Aviano, Italy).
Samples were either processed within 48 hours since
collection (50 cases), or cryopreserved until analysis
(123 cases). Cells were labeled with anti-CD19-APC,
anti-CD5-PE-Cy7 and anti-CD3-PE-conjugated mono-
clonal antibodies (mAbs, Becton-Dickinson, San Jose,
CA) for 20 minutes, then treated with fixing and per-
meabilizing reagents (Fix&Perm kit, Caltag, Burlingame,
CA) according to the manufacturer’s instructions, and
finally stained with the Alexa-488- conjugated anti-ZAP-
70 mAb (clone 1E7.2, Caltag). A second tube was p re-
pared exactly as above, but s ubstituting the Alexa-488-
conjugated anti-ZAP-70 mAb with an isotype-matched
Alexa-488-conjugated control mAb (Caltag). All samples
were acquired on a FACSCanto flow cytometer and ana-
lyzed with DiVa software (Becton-Dickinson). No signif-
icant differences in term of ZAP-70 Mean Fluorescence
Intensity (MFI) values were found by comparing fresh
Rossi et al. Journal of Translational Medicine 2010, 8:23
/>Page 2 of 11
versus thawed samples, as judged by evaluating the T
cell component (p = 0.14; see Additional file 1).
Flow cytometric det ections of ZAP-70 in PB samples
belonging to the validation set, all performed at the
laboratory of the Hematology Unit, S. Eugenio Hospita l,
University of Tor Vergata (Rome, Italy), were an updat-
ing of previously reported analyses [22]. Briefly, PB
mononuclear cells, separated on a density gradient
(Ficoll-Hypaque, Pharmacia), were stained with anti-
CD19-PerCP, anti-CD5-APC, anti-CD3/anti-CD56-PE
mAbs, treated with the Fix&Perm kit (Caltag), and
finally stained with the Alexa-488- conjugated anti-ZAP-
70 mAb (clone 1E7.2, Caltag). Samples were acquired
on a FACSCalibur flow cytometer and ana lyzed with
CellQuest software (Becton-Dickinson).
In all cases, at least 15 000 mononucleated cells and
2 000 T cells were acquired per tube. The lymphocyte
population was gated based on morphological para-
meters on a forward- versus side-scatter (FSC/SSC) plot,
excluding potential debris and lymphocyte doublets
from the analysis. CLL and T cells were defined respec-
tively as CD19
+
/CD5
+
/CD3
-
or CD19
-
/CD5
+
/CD3
+
lym-
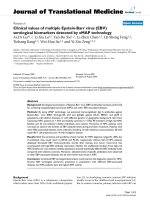
phocytes (Fig. 1A).
ZAP-70 expression was evaluated according to three
different approaches (Figure 1B): i) a 2-tubes protocol,
modified from the original protocol described by Ras-
senti et al. [4,7,24] (ISO-method); ii) a single-tube proto-
col, as originally described by Crespo et a l. [2] (T-
method); iii) a single-tube method calculating the ratio
between the ZAP-70 Mean Fluorescence Intensity (MFI)
Figure 1 Flow cytometric analysis of ZAP-70 expression (test set). PB cells of CLL samples were analyzed after staining with anti-CD19-APC,
anti-CD3-PE, anti-CD5-PECy7 and AlexaFluor488-conjugated isotype control or anti-ZAP-70 antibodies. Panel A shows the gating strategies used
to select lymphocytes in the left plot, CLL cells (CD19+/CD5+/CD3-) or T cells (CD19-/CD5+/CD3+) in middle and right plots, upon gating on
lymphocytes. Panel B contains plots showing a representative ZAP-70 negative (upper row) and a representative ZAP-70 positive (lower row)
sample, both analyzed according to the three different approaches utilized to evaluated ZAP-70 expression. The ISO- T-, and T/B Ratio-method
readouts are shown respectively in the left, middle and right panels. For the ISO-method marker was set to have <1% CLL positive cells with
isotypic control. For the T-method, marker was set on the left edge of T cells cluster, to have about 98% of positive cells. For the T/B Ratio-
method the ratio was calculated directly from MFI values as separately read from T cell and CLL cell gates defined in panel A.
Rossi et al. Journal of Translational Medicine 2010, 8:23
/>Page 3 of 11
values obtain ed from T and CLL cells (T/B Rati o-
method).
According to the ISO-method (Fig. 1B, left panels),
non-specific staining was e valuated on gated CLL cells
in a CD19/isotypic control plot, setting the marker in
order to have no more than 1% of positive cells (tube
1). This marker was then used to evaluate the percen-
tage of ZAP-70 labeled CLL cells, as detected in tube 2.
The T-method (Fig. 1B, middle panels) implied the
positioning of a marker close to the left edge of the T
cell cluster in a ZAP-70/CD3 plot, and t he use of this
marker to calculate, in the same plot, the percentage of
CLL positive cells. Although a skewed distribution of
ZAP-70 in T cells was sometime observed [7], and con-
sidered in the positioning of the marker, this was usually
set to have 98% of positive T cells.
The third approach (Fig. 1B, right panels) was based on
the evaluation of ZAP-70 expression levels in terms of
MFI, as measured on a CD3/ZAP-70 plot, utilizing the
“mean” parameter, respectively on gated T lymphocytes
(T-MFI), or CLL cells (B-MFI) as defined in plot A.
These values were used to calculate the ratios between
corresponding T-MFI and B-MFI (T/B Ratio-method).
Statistical analysis
Statistical analyses were performed using the R statistical
package with Design library [25]. Time-to-treatment
(TTT) was measured from diagnosis to first line treat-
ment, or last follow-up, and was available for all CLL
cases entering the study. No deaths were recorded in the
untreated patients or prior the start of therapy. Treat-
ments were establish ed following National Cancer Insti-
tute-Working Group guidelines [16]. The concordance
index (c index) was used to determine the predictive abil-
ity of ZAP-70 positivity in a TTT model. Briefly, the c
index is a probability of concordance between predicted
and observed survival, with c = 0.5 for random predic-
tions and c = 1 for a perfectly discriminating model [25].
An optimal cut-off for each of the three ZAP-70 readouts
was chosen at the highest value of the c index, calculated
for all the possible cut-off values of ZAP-70 [25]. TTT
were estimated using Kaplan-Meier curves and compari-
son between groups were made by log-rank test. The
Cox proportional hazard regression model was used to
assess the independent effect of cova riables, treated as
dichotomous, on the TTT, with a backward procedure to
select for significant variables. Coefficients of variation
(CV) were calculated according to one way ANOVA test.
Results and discussion
ZAP-70 expression according to the ISO-, T- and T/B
Ratio-methods
We first considered the cohort of 173 CLL patients
included in the test set. Flow cytometric data files were
re-analyzed according to the three different readouts
applied to evaluate ZAP-70 expression (Fig. 1).
According to the ISO-method, in which ZAP-70 eva-
luation is driven by an isotypic control, 66/173 (38%)
cases were defined as ZAP-70 positive using a cut-off
value set at 11% of positive cells (Fig. 2A). This cut-off,
in keeping with some pioneering studies on ZAP-70
expression and prognosis in CLL [3], was determined by
selecting the value associated to the highest value of the
c index. It was preferred to the standard 20% of positive
cells, employed by other studies [4,24,26], which yielded
in our series 28/173 ZAP-70 positive cases (16.2%), but
a worse separation of ZAP-70+ vs. ZAP-70-cases (Fig.
2A). This result may be in part explained considering
that CLL samples from the test set were analyzed either
upon shipment by overnight courier or following thaw-
ing procedures, two conditions reported to potentially
reduce ZAP-70 expression levels by CLL cells [14,27].
Consistently, a cut-off set at 15% of positive cells was
also found to be more informative as a prognosti c mar-
ker than the standard 20% in a series of frozen CLL
samples retrospectively tested for ZAP-70 expression
[27].
The T-method, in which ZAP-70 evaluation is driven
by the residual population of normal T cells, yielded 60/
173 positive cases (34.7%), by choosing the standard
cut-off value of 20% positive cells to discriminate ZAP-
70 positi ve vs. ZAP -70 negative C LL (Fig. 2B). At
variance with the ISO- method, this cut-off was also
associated with the best predictive ability as determined
by the c index (Fig. 2B).
In the case of the T/B Ratio-method, in which ZAP-70
expression is evaluated taking into account T-MFI and
B-MFI, the optimal cut-off value was ag ain estimated by
calculating the c index. As shown in Fig. 2C, a 3.0 T/B
Ratio value was very near to the best cut-off selected for
prognostic purposes. In our series, 100 CLL had T/B
Ratio values greater or equal to 3.0 (i.e. ZAP-70 nega-
tive), while 73 CLL had values lower than 3.0, and were,
therefore, considered as ZAP-70 positive cases (42.2%;
Fig. 2C).
Approaches for evaluating ZAP-70 expression levels
by computing the ratio between MFI values of CLL vs.
T cells or T vs. CLL cells have been already proposed,
although either applied to relatively small patient series,
or without evaluating its prognostic relevance compared
to the other methods currently employed in routine
prognostic assessment of CLL patients [9-11,14,15,28].
Data presented here, suggesting a T/B Ratio value of 3.0
as the optimal cut-off point to discriminate ZAP-70
positive (i.e. with T/B Ratio values lower than 3.0) vs.
ZAP-70 negative (i.e. with T/B Ratio values greater than
or equal to 3.0) CLL, was obtained by ut ilizing the
Alexa-488-conjugated 1E7.2 anti-ZAP-70 mAb.
Rossi et al. Journal of Translational Medicine 2010, 8:23
/>Page 4 of 11
Although this mAb is one of the most frequently
employed anti-ZAP-70 mAbs [4,5,24], several other
mAbs have been reported, with different reactivity,
fluorochrome conjugation, hence with different com-
parative performances [10,29]. Therefore, it would be
not surprising that the 3.0 cut-off indi cated by us could
be influenced by the use of a particular anti-ZAP-70
mAb. As an example, a 4.5 was recently employed in a
CLL series in which ZAP-70 expression was investigated
by using the PE-conjugated SBZAP mAb [28]. More-
over, in a study by Le Garff-Tavernier et al. [14] a posi-
tivity threshold set at 4.0 was chosen by conside ring the
mean value determined in a series of normal blood sam-
ples in which the ratio between expression of ZAP-70 in
T vs. B cells was computed. Additional studied are
therefore needed to validate the 3.0 cut-off, utilizing
other anti-ZAP-70 clones and/or fluorochrome
combinations.
In an attempt to evaluate the robustness of the T/B
Ratio-method, as compared to the other approaches,
ZAP-70 expression was independently evalua ted by two
operators (F.M.R. and A.Z.) in a series of 42 CLL. As
reported in Additional file 2, although analyses were
made by expert cytometrists, mean CV values co mputed
for the three methods revealed a significantly higher
variability when ZAP-70 expression was evaluated by
the ISO-method (CV = 19.4) or the T-method (CV =
29.2) compared to the T/B Ratio-method (CV = 3.6).
Accordingly, a technical report aimed at harmonizing
different procedures for ZAP-70 evaluation among sev-
eral laboratories, proposed an approach similar to our
T/B Ratio-method as the method yielding the most
accurate and reproducible results in both ZAP-70 posi-
tive and ZAP-70 negative cases [15].
ZAP-70 expression according to the ISO-, T- and T/B
Ratio-methods: prognostic significance
As summarized in Fig. 2, regardless of the readout cho-
sen to evaluate ZAP-70 expression, high ZAP-70 levels
always correlated with shorter TTT in CLL. This is in
keeping with previous studies in which both ISO- and T-
methods were proven to have prognostic relevance, also
in wide cohorts of patients [5,24]. Nevertheless, a parallel
comparison of the prognostic impact of different meth-
ods for ZAP-70 evaluation in a relatively wide CLL series
is still lacking. In this regard, the Kaplan-Meier curves
reported in Fig. 2 clearly showed that an evaluation of
ZAP-70 expression utilizing the T/B Ratio-method
yiel ded the best separation between ZAP-70 positive and
ZAP-70 negative cases (p value = 5.6 × 10
-6
), followed by
T- (p value = 1.3 × 10
-5
) and ISO- (p value = 0.009)
methods.
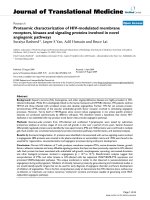
Figure 2 C index and Kaplan-Meier curves for ZAP-70 evaluation according to ISO-, T- and T/B Ratio-methods (test set). Upper panels
in A, B, and C show c index curves applied to ZAP-70 expression values to estimate the optimal cut-off capable to split patients into groups
with different time to treatment (TTT) probabilities. X-axes report expression values for ZAP-70, expressed as percent of positive cells (A and B),
or T/B ratio values (C); y-axes report the corresponding c index values. For each method, solid line indicates the chosen cut-off value. Lower
panels show Kaplan-Meier curves obtained comparing TTT of patients affected by CLL expressing or not ZAP-70, as evaluated according to ISO-
(A), T- (B) or T/B Ratio- (C) methods. In all plots, solid lines indicate ZAP-70 negative CLL, while dashed line indicate ZAP-70 positive CLL,
according to the three readouts. In (A) Kaplan-Meier curves obtained by dividing CLL patients according to two different cut-offs (11% and 20%)
for ZAP-70 evaluation are reported.
Rossi et al. Journal of Translational Medicine 2010, 8:23
/>Page 5 of 11
This suggestion was confirmed by multivariate ana-
lyses, carried out in the whole series of 173 cases, in
which ZAP-70 expression, as computed according to the
three readouts, was included in a Cox proport ional
hazard regression model along with the main clinical
and biological parameters (i.e. Rai stage, b2-microglobu-
lin, FISH group, CD 49d and CD38 expression, and
IGHV gene mutational status) to test its relative
strength as independent prognostic marker for TTT
[18,30-33]. All the investigated parameters had prognos-
ticimpactbyunivariateanalyses(Additionalfile3).
When included in a multivariate model, ZAP-70 expres-
sion, irrespective to the readout utilized, and FISH
group were the sole biological parameters selected as
independent prognostic markers along with the two
clinical covariates (Table 1). Notably, regarding the
prognostic impact of ZAP-70 expression in the three
multivariate models, the highest value of hazard ratio
(HR) was associated with the T/B Ratio-method, while
lower HR values were found when ISO- or T-methods
were considered (Table 1).
ZAP-70 expression according to ISO-, T- and T/B
Ratio-methods: concordant and discordant cases
According to the three readouts examined, a percentage
ranging from 34.7% (T-method) to 42.2% (T/B Ratio-
method) of ZAP-70 positive cases was found. These
values were lower than those reported by some litera-
ture studies, in which ZAP-70 positive cases were
around or even exceeded 50% of CLL cases [24]. On th e
other hand, our results are in keeping with other studies
investigating unselected, consecutive CLL series [34].
These differences can be explained considering the
greater number of patients with low risk CLL usually
enrolled by primary care centers. In the present series,
105/173 (66.5%) cases were classified as low-risk CLL by
the modified Rai staging (Additional file 3), and 115/173
(60.7%) cases had a mutated IGHV gene status (see
below). A similar proportion of ZAP-70 p ositive cases
was found in other monocenter and multicenter Italian
studies [5,18,19,35,36].
Overall, a total number of 103/173 cases (59.5%)
turned out t o be ZAP-70 positive utilizing at least one
of the three readouts employed for ZAP-70 evaluation.
These cases had a TTT significantly shorter than that of
the remaining 70 cases, which were unequivocal ly nega-
tive for ZAP-70 expression, irrespective to the method
employed for its evaluation (p = 0.001; Additional file
4). However , among these cases, only 37/103 were clas-
sified as ZAP-70 positive by all methods employed (i.e.
concordant cases), while the remaining 66 CLL (disc or-
dant cases) were either ZAP-70 positive according to at
least two methods (22 cases) or according to a single
method (44 cases). A Venn diagram depicting concor-
dant and discordant cases, as obtained by merging ZAP-
70 positive cases according to the three readouts is
reported in Fig. 3A. Notably, significantly shorter TTT
intervals (p = 0.013) were observed in patients affected
by ZAP-70 positive CLL according to the T/B Ratio-
method (73 cases), compared to patients identified as
ZAP-70 positive by the ISO- or the T-methods but not
by the T/B Ratio-method (30 cases; Fig. 3B).
ZAP-70 expression according to the ISO-, T- and T/B
Ratio-methods: correlation with IGHV gene mutational
status
IGHV gene mutational status represents an additional
and commendable prognostic marker for CLL [20,21,37].
In the present series, 58/173 CLL had UM IGHV genes
(33.5%). Again, this result is consistent with a consecutive
CLL series without referral bias, and therefore relatively
enriched in low risk cases [5,18,19,35,36]. As reported in
Table 2, when IGHV gene mutational status and ZAP-70
positivity, determined according to the t hree readouts,
were correlated, a significant concordance of 75%, 74%
and 67% (p < 0.0001 for all readouts) was found by
applying the ISO-, T- or the T/B Ratio-methods, respec-
tively. This concordance rate is overall in keeping with
other reports [2-5,24,38,39].
Validation set: ZAP-70 expression by CLL and T cells
To validate the results obtained in the test set, we
reviewed a different dataset of 341 CLL from another
Table 1 Multivariate Cox regression analyses of TTT.
HR (95% CI)* p value
Model 1 (ISO-method)
b
2
M (>2.2 g/L) 3.48 (1.73-7.03) 5.1 × 10
-4
Rai stages (II-III-IV) 5.76 (3.56-9.33) <1 × 10
-4
FISH (+12,11q
-
,17p
-
) 1.76 (1.34-2.31) 5.6 × 10
-5
ZAP-70 (≥ 11%) 2.11 (1.24-3.57) 5.7 × 10
-3
Model 2 (T-method)
b
2
M (>2.2 g/L) 3.16 (1.58-6.33) 1.2 × 10
-3
Rai stages (II-III-IV) 5.97 (3.69-9.68) <1 × 10
-4
FISH (+12,11q
-
,17p
-
) 1.65 (1.26-2.17) 2.7 × 10
-4
ZAP-70 (≥ 20%) 2.19 (1.29-3.72) 3.5 × 10
-3
Model 3 (T/B Ratio-method)
b
2
M (>2.2 g/L) 3.11 (1.55-6.23) 1.5 × 10
-3
Rai stages (II-III-IV) 5.95 (3.65-9.71) <1 × 10
-4
FISH (+12,11q
-
,17p
-
) 1.64 (1.25-2.15) 4.1 × 10
-4
ZAP-70 (<3.0) 2.72 (1.56-4.75) 4.5 × 10
-4
Multivariate Cox regression analyses of TTT were performed on the 173 cases
of the test set including the fol lowing covariates treated as dichotomous: b
2
-
microglobulin (>2.2 g/L vs. ≤2.2 g/L); modified Rai staging (0-I vs. II-III-IV); FISH
group (normal/13q
-
vs. +12/11q
-
/17p
-
); CD38 (≥ 30% vs. <30%); CD49d (≥ 30%
vs. <30%); IGHV mutational status (UM vs. M); and ZAP-70.
*Based on the final model after backward selection of covariates.
Abbreviations: TTT, Time-To-first-Treatment; HR, hazard ratio; CI, confidence
interval.
Rossi et al. Journal of Translational Medicine 2010, 8:23
/>Page 6 of 11
Institution, in which ZAP-70 staining and analyses were
performed utilizing a different procedure and instru-
mentation. In thi s validation set, ZAP-70 expression was
evaluated with the T-method utilizing the standard cut-
off of 20% positive cells, as well as with the T/B Ratio-
method; in the latter case, the cut-off of 3.0 identified in
the test set was chosen.
According to the T-method, 180/341 cases (53%) were
considered ZAP-70 positive, while when ZAP-70 expres-
sion was evaluated according to the T/B Ratio-method,
the percentage of ZAP-70 positive cases decreased to
37.2% (127/341 cases). Again, a para llel comparison of
the prognostic impact of the two methods for ZAP-70
evaluation clearly indicated a better separation between
ZAP-70 positive and ZAP-70 negative cases when the
T/B Ratio-method was applied (p value = 7.7 × 10
-16
vs.
1.2 × 10
-12
; Fig. 4AB).
As shown by the Venn di agram reported in Fig. 4C,
185 cases were overall classified as ZAP-70 positive by
at least one procedure. Among them, 122 cases were
concordantly positive, 58 cases were judged as ZAP-70
positive by th e T-method only, while 5 cases were con-
sidered ZAP-70 positive solely by the T/B Ratio-method.
Finally 156 cases were classified as ZAP-70 negative by
both procedures. Notably, patients ZAP-70 positive
according to the T/B Ratio-method (127 cases) experi-
enced significantly shorter TTT intervals, both if com-
pared to the 156 ZAP-70 negative cases, and to the 58
cases classified as ZAP-70 positive by the T-method
only (Fig. 4D).
CLL samples belonging to the validation co hort were
classified as positive for ZAP-70 expression according to
data-defined criteria, as determined in the test set. Never-
theless, according to the c index curve computed also in
the context of this dataset, we could confirm the 3.0 Ratio
value for the T/B Ratio-method (actual value 3.15) as the
optimal cut-off yielding the best segregation of ZAP-70
positive and ZAP-70 negative cases into two classes with
different TTT probabilities (Additional file 5).
Conclusions
In the present study, we had the opportunity to com-
pare three different approaches for ZAP-70 evaluation
Figure 3 Analysis of ZAP-70 concordant and discordant cases
among ISO-, T- and T/B Ratio-methods (test set). (A) Venn
diagram depicting concordant and discordant cases, as obtained by
merging the ZAP-70 positive cases determined by ISO-, T- and T/B
Ratio-methods. (B) Kaplan-Meyer curves obtained comparing TTT of
patients affected by CLL expressing ZAP-70 according to T/B Ratio-
method (73), or expressing ZAP-70 according to either ISO- or T-
methods (30).
Table 2 Correlation of ZAP-70 analyses with IGHV mutational status as prognostic markers.
ISO-method T-method T/B Ratio-method
<11 ≥ 11 % conc <20 ≥ 20 % conc ≥ 3 <3 % conc
M IGHV 90 25 75 92 23 74 79 36 67
UM IGHV 17 41 (p < 0.00001) 21 37 (p < 0.00001) 21 37 (p < 0.00001)
Abbreviations: M IGHV, mutated IGHV genes status; UM IGHV, unmutated IGHV genes status; % conc, overall percentage of co ncordancy between the two
prognostic parameters.
Rossi et al. Journal of Translational Medicine 2010, 8:23
/>Page 7 of 11
in two separate cohorts of CLL patients, overall
accounting for 514 cases. Notably, although in the
two cohorts ZAP-70 was evaluated by utilizing the
same antibody, two different mAb combinations, stain-
ing procedures and flow cytometers for data acquisi-
tion and analysis were employed. Despite this,
the obtained results concordantly indicate that ZAP-
70 expression, as evaluated by utilizing the T/B
Ratio-method, appears to be a better predictor than
the percentage of positive cells for progressive disease
in CLL.
The underlying biological reasons explaining the stron-
ger prognostic impact of ZAP-70 determinat ion per-
formed according to the T/B Ratio-method, compared to
the other approaches based upon computation of percen-
tages of positive cells, are still to be determined. In this
regard, however, it has to be reminded that T/B Ratio
values lower than the established 3.0 cut-off, as they are
in CLL cases marked as ZAP-70 positive, can theoreti-
cally represent the result of a high expression level of
ZAP-70 in the CLL component, but also of a low expres-
sion level of ZAP-70 by residual T cells. Previous studies
Figure 4 ZAP-70 expression in the validation set. (A-B) Kaplan-Meier curves obtained comparing TTT of patients affected by CLL expressing
ZAP-70 according to T-method (A) or T/B Ratio-method (B). In all plots solid line indicates ZAP-70 negative CLL, while dashed line indicates ZAP-
70 positive CLL. (C) Venn diagram depicting concordant and discordant cases, as obtained by merging the ZAP-70 positive cases determined by
the two readouts. (D) Kaplan-Meyer curves obtained comparing TTT of patients affected by CLL expressing ZAP-70 according to T/B Ratio-
method (127 cases), expressing ZAP-70 according to sole T-method (58 cases), or ZAP-70 negative according to both methods (156 cases).
Rossi et al. Journal of Translational Medicine 2010, 8:23
/>Page 8 of 11
by us and by other groups [6,7,40] documented highly
heterogeneous levels of ZAP-70 by the residual T cell
component of CLL samples. As an example, in the test
set of the present study, MFI levels ranged from 370 to
3785. It is therefore tempting to speculate that peculiar
biological features of the residual T cell component in
CLL, as it could be identified by the variable expression
of specific markers, e.g. CD38, telomeres, CD25 and
CD54 [41-45] or, as shown here, ZAP-70, might be the
result of interactions of T c ells themselves with CLL
cells, which might eventually contribute to define the
clinical features of the disease [40,46].
The prognostic relevance of ZAP-70 determination in
CLL has been emphasized in several retrospective ana-
lyses of wide cohorts of patients [5,24]. However, a stan-
dardize d procedure for ZAP-70 evaluation, which allows
to overcome the great interlaboratory variation asso-
ciated with the different strategies and analytical
approaches employed so far [47], although strongly
recommended [48], is still lacking. Re-analyses of flow
cytometric files by applying the T/B Ratio-method, as
proposed here, could be useful for clarifying the real
prognostic impact of this approach.
Additional file 1: ZAP-70 expression in thawed vs. fresh samples.
Box and whiskers diagrams comparing the expression levels of ZAP-70,
expressed as MFI values, in the T cell component of the 50 fresh vs. the
123 thawed CLL samples of the test set.
Click here for file
[ />S1.PDF ]
Additional file 2: ZAP-70 reading comparison between two different
operators. The table shows ZAP-70 expression levels calculated
according to the ISO-, T-, and T/B Ratio-methods by two different
operators on 42 cases belonging to the test set.
Click here for file
[ />S2.PDF ]
Additional file 3: Effect of the major clinical and biological
prognosticators as TTT predictors in CLL from the test set. Kaplan-
Meier curves obtained comparing TTT of CLL patients split according to
b2-microglobulin levels (A; >2.2 g/L vs. ≤ 2.2 g/L); modified Rai staging
(B; low vs. intermediate vs. high risk); FISH groups (C; normal/13q
-
vs.
+12/11q
-
/17p
-
); IGHV gene mutational status (D; Mutated vs. Unmutated
IGHV); CD49d (E; ≥ 30% vs. <30%); CD38 (F; ≥ 30% vs. <30%).
Click here for file
[ />S3.PDF ]
Additional file 4: Effect of ZAP-70 positivity as TTT predictor in CLL
from the test set. Kaplan-Meyer curves obtained comparing TTT of
patients affected by CLL which were ZAP-70 positive (103) according to
at least one readout (ISO-, T- and T/B Ratio-methods), or ZAP-70 negative
(70) according to all readouts.
Click here for file
[ />S4.PDF ]
Additional file 5: C index curve for ZAP-70 evaluation in the
validation set. C index curve was used to estimate the optimal cut-off
capable to split patients into groups with different time to treatment
(TTT) probabilities applied to ZAP-70 expression values determined
according to T/B Ratio-method. X-axis report expression values for ZAP-
70, expressed as T/B ratio values; y-axis report the corresponding c index
values.
Click here for file
[ />S5.PDF ]
Acknowledgements
Supported in part by: Ministero della Salute (Ricerca Finalizzata I.R.C.C.S. and
“Alleanza Contro il Cancro”), Rome; Associazione Italiana contro le Leucemie,
linfomi e mielomi (A.I.L.), Venezia Section, Pramaggiore Group; Ricerca
Scientifica Applicata, Regione Friuli Venezia Giulia, Trieste ("Linfonet”);
Associazione Italiana per la Ricerca sul Cancro (Investigator Grant IG-8701),
Milan, Italy; Programmi di Ricerca di Interesse Nazionale (P.R.I.N.) and Fondo
per gli Investimenti per la Ricerca di Base (F.I.R.B.), M.I.U.R., Rome; Novara-A.I.
L. Onlus, Novara; Ricerca Sanitaria Finalizzata Regione Piemonte, Torino.
Author details
1
Clinical and Experimental Onco-Hematology Unit, Centro di Riferimento
Oncologico, I.R.C.C.S., Aviano (PN), Italy.
2
Division of Hematology, S. Eugenio
Hospital and Universi ty of Tor Vergata, Rome, Italy.
3
Division of Hematology -
Department of Clinical and Experimental Medicine & BRMA - Amedeo
Avogadro University of Eastern Piedmont, Novara, Italy.
Authors’ contributions
Contribution: FMR wrote the manuscript, performed part of
immunophenotypical studies and data analyses; MIDP and DR provided
clinical data of patients and contributed to data analysis; RB, MDB. and MD
performed the IGHV gene mutation and contributed to data analyses; AZ,
DB, FL, and MIC performed part of immunophenotypical studies and
contributed to data analysis; PB contributed to data analyses; M.F. provided
clinical data of patients; GG provided patient samples and contributed to
write the manuscript; GDP and VG coordinated the study and data analyses,
and contributed to write the manuscript. All authors have read and
approved the final manuscript.
Competing interests
The authors declare that they have no competing interests.
Received: 18 November 2009 Accepted: 8 March 2010
Published: 8 March 2010
References
1. Rosenwald A, Alizadeh AA, Widhopf G, Simon R, Davis RE, Yu X, Yang L,
Pickeral OK, Rassenti LZ, Powell J, Botstein D, Byrd JC, Grever MR,
Cheson BD, Chiorazzi N, Wilson WH, Kipps TJ, Brown PO, Staudt LM:
Relation of gene expression phenotype to immunoglobulin mutation
genotype in B cell chronic lymphocytic leukemia. J Exp Med 2001,
194:1639-1647.
2. Crespo M, Bosch F, Villamor N, Bellosillo B, Colomer D, Rozman M, Marce S,
Lopez-Guillermo A, Campo E, Montserrat E: ZAP-70 expression as a
surrogate for immunoglobulin-variable-region mutations in chronic
lymphocytic leukemia. N Engl J Med 2003, 348:1764-1775.
3. Orchard JA, Ibbotson RE, Davis Z, Wiestner A, Rosenwald A, Thomas PW,
Hamblin TJ, Staudt LM, Oscier DG: ZAP-70 expression and prognosis in
chronic lymphocytic leukaemia. Lancet 2004, 363:105-111.
4. Rassenti LZ, Huynh L, Toy TL, Chen L, Keating MJ, Gribben JG, Neuberg DS,
Flinn IW, Rai KR, Byrd JC, Kay NE, Greaves A, Weiss A, Kipps TJ: ZAP-70
Rossi et al. Journal of Translational Medicine 2010, 8:23
/>Page 9 of 11
compared with immunoglobulin heavy-chain gene mutation status as a
predictor of disease progression in chronic lymphocytic leukemia. N Engl
JMed2004, 351:893-901.
5. Del Principe MI, Del Poeta G, Buccisano F, Maurillo L, Venditti A,
Zucchetto A, Marini R, Niscola P, Consalvo MA, Mazzone C, Ottaviani L,
Panetta P, Bruno A, Bomben R, Suppo G, Degan M, Gattei V, de Fabritiis P,
Cantonetti M, Lo Coco F, Del Principe D, Amadori S: Clinical significance of
ZAP-70 protein expression in B-cell chronic lymphocytic leukemia. Blood
2006, 108:853-861.
6. Kay S, Herishanu Y, Pick M, Rogowski O, Baron S, Naparstek E, Polliack A,
Deutsch VR: Quantitative flow cytometry of ZAP-70 levels in chronic
lymphocytic leukemia using molecules of equivalent soluble
fluorochrome. Cytometry B Clin Cytom 2006, 70:218-226.
7. Zucchetto A, Bomben R, Dal Bo M, Nanni P, Bulian P, Rossi FM, Del
Principe MI, Santini S, Del Poeta G, Degan M, Gattei V: ZAP-70 expression
in B-cell chronic lymphocytic leukemia: evaluation by external (isotypic)
or internal (T/NK cells) controls and correlation with IgV(H) mutations.
Cytometry B Clin Cytom 2006, 70:284-292.
8. Gachard N, Salviat A, Boutet C, Arnoulet C, Durrieu F, Lenormand B,
Lepretre S, Olschwang S, Jardin F, Lafage-Pochitaloff M, Penther D, Sainty D,
Reminieras L, Feuillard J, Bene MC: Multicenter study of ZAP-70
expression in patients with B-cell chronic lymphocytic leukemia using
an optimized flow cytometry method. Haematologica 2008, 93:215-223.
9. Bekkema R, Tadema A, Daenen SM, Kluin-Nelemans HC, Mulder AB: An
improved flow cytometric method using FACS Lysing Solution for
measurement of ZAP-70 expression in B-cell chronic lymphocytic
leukemia. Cytometry B Clin Cytom 2008, 74:40-44.
10. Bakke AC, Purtzer Z, Leis J, Huang J: A robust ratio metric method for
analysis of Zap-70 expression in chronic lymphocytic leukemia (CLL).
Cytometry B Clin Cytom 2006, 70:227-234.
11. Best OG, Ibbotson RE, Parker AE, Davis ZA, Orchard JA, Oscier DG: ZAP-70
by flow cytometry: a comparison of different antibodies, anticoagulants,
and methods of analysis. Cytometry B Clin Cytom 2006, 70:235-241.
12. Chen YH, Peterson LC, Dittmann D, Evens A, Rosen S, Khoong A,
Shankey TV, Forman M, Gupta R, Goolsby CL: Comparative analysis of flow
cytometric techniques in assessment of ZAP-70 expression in relation to
IgVH mutational status in chronic lymphocytic leukemia. Am J Clin Pathol
2007, 127:182-191.
13. Ertault-Daneshpouy M, Noguera ME, Gisselbrecht C, Haddad A, Brice P,
Marolleau JP, Soulier J, Mounier N: ZAP-70 protein expression and CD38
positivity in B-cell chronic lymphocytic leukemia. Clin Adv Hematol Oncol
2008, 6:55-63.
14. Le Garff-Tavernier M, Ticchioni M, Brissard M, Salmon C, Raynaud S, Davi F,
Bernard A, Merle-Beral H, jchenbaum-Cymbalista F, Letestu R: National
standardization of ZAP-70 determination by flow cytometry: the French
experience. Cytometry B Clin Cytom 2007, 72:103-108.
15. Letestu R, Rawstron A, Ghia P, Villamor N, Boeckx N, Boettcher S, Buhl AM,
Duerig J, Ibbotson R, Kroeber A, Langerak A, Le Garff-Tavernier M,
Mockridge I, Morilla A, Padmore R, Rassenti L, Ritgen M, Shehata M,
Smolewski P, Staib P, Ticchioni M, Walker C, jchenbaum-Cymbalista F:
Evaluation of ZAP-70 expression by flow cytometry in chronic
lymphocytic leukemia: A multicentric international harmonization
process. Cytometry B Clin Cytom 2006, 70:309-314.
16. Cheson BD, Bennett JM, Grever M, Kay N, Keating MJ, O’Brien S, Rai KR:
National Cancer Institute-sponsored Working Group guidelines for
chronic lymphocytic leukemia: revised guidelines for diagnosis and
treatment. Blood
1996, 87:4990-4997.
17. Hallek M, Cheson BD, Catovsky D, Caligaris-Cappio F, Dighiero G, Dohner H,
Hillmen P, Keating MJ, Montserrat E, Rai KR, Kipps TJ: Guidelines for the
diagnosis and treatment of chronic lymphocytic leukemia: a report from
the International Workshop on Chronic Lymphocytic Leukemia updating
the National Cancer Institute-Working Group 1996 guidelines. Blood
2008, 111:5446-5456.
18. Gattei V, Bulian P, Del Principe MI, Zucchetto A, Maurillo L, Buccisano F,
Bomben R, Dal Bo M, Luciano F, Rossi FM, Degan M, Amadori S, Del PG:
Relevance of CD49d protein expression as overall survival and
progressive disease prognosticator in chronic lymphocytic leukemia.
Blood 2008, 111:865-873.
19. Bomben R, Dal Bo M, Capello D, Forconi F, Maffei R, Laurenti L, Rossi D, Del
Principe MI, Zucchetto A, Bertoni F, Rossi FM, Bulian P, Cattarossi I,
Ilariucci F, Sozzi E, Spina V, Zucca E, Degan M, Lauria F, Del PG, Efremov DG,
Marasca R, Gaidano G, Gattei V: Molecular and clinical features of chronic
lymphocytic leukaemia with stereotyped B cell receptors: results from
an Italian multicentre study. Br J Haematol 2009, 144:492-506.
20. Degan M, Bomben R, Dal Bo M, Zucchetto A, Nanni P, Rupolo M, Steffan A,
Attadia V, Ballerini PF, Damiani D, Pucillo C, Del Poeta G, Colombatti A,
Gattei V: Analysis of IgV gene mutations in B cell chronic lymphocytic
leukaemia according to antigen-driven selection identifies subgroups
with different prognosis and usage of the canonical somatic
hypermutation machinery. Br J Haematol 2004, 126:29-42.
21. Damle RN, Wasil T, Fais F, Ghiotto F, Valetto A, Allen SL, Buchbinder A,
Budman D, Dittmar K, Kolitz J, Lichtman SM, Schulman P, Vinciguerra VP,
Rai KR, Ferrarini M, Chiorazzi N: Ig V gene mutation status and CD38
expression as novel prognostic indicators in chronic lymphocytic
leukemia. Blood 1999, 94:1840-1847.
22. Del Poeta G, Maurillo L, Venditti A, Buccisano F, Epiceno AM, Capelli G,
Tamburini A, Suppo G, Battaglia A, Del Principe MI, Del Moro B, Masi M,
Amadori S: Clinical significance of CD38 expression in chronic
lymphocytic leukemia. Blood 2001, 98:2633-2639.
23. Hamblin TJ, Orchard JA, Gardiner A, Oscier DG, Davis Z, Stevenson FK:
Immunoglobulin V genes and CD38 expression in CLL. Blood 2000,
95:2455-2457.
24. Rassenti LZ, Jain S, Keating MJ, Wierda WG, Grever MR, Byrd JC, Kay NE,
Brown JR, Gribben JG, Neuberg DS, He F, Greaves AW, Rai KR, Kipps TJ:
Relative value of ZAP-70, CD38, and immunoglobulin mutation status in
predicting aggressive disease in chronic lymphocytic leukemia. Blood
2008, 112:1923-1930.
25. Harrel FE: Regression Modeling Strategies: With Applications to Linear Models,
Logistic Regression, and Survival Analysis Springer: New York 2001.
26. Passam F, Tachynopoulou V, Skoumi D, Tsompanakou A, Stavropoulos-
Giokas A, Vadikolia C, Anagnostopoulos A, Paterakis G: Feasibility of an
easily applicable method of ZAP-70 measurement in chronic
lymphocytic leukemia in the routine flow cytometry setting: A
methodological approach. Ann Hematol 2006, 85:795-805.
27. Sheikholeslami MR, Jilani I, Keating M, Uyeji J, Chen K, Kantarjian H,
O’Brien S, Giles F, Albitar M: Variations in the detection of ZAP-70 in
chronic lymphocytic leukemia: Comparison with IgV(H) mutation
analysis. Cytometry B Clin Cytom 2006, 70:270-275.
28. Kern W, Dicker F, Schnittger S, Haferlach C, Haferlach T: Correlation of flow
cytometrically determined expression of ZAP-70 using the SBZAP
antibody with IgVH mutation status and cytogenetics in 1,229 patients
with chronic lymphocytic leukemia. Cytometry B Clin Cytom 2009,
76:385-393.
29. Shankey TV, Forman M, Scibelli P, Cobb J, Smith CM, Mills R, Holdaway K,
Bernal-Hoyos E, Van Der HM, Popma J, Keeney M: An optimized whole
blood method for flow cytometric measurement of ZAP-70 protein
expression in chronic lymphocytic leukemia. Cytometry B Clin Cytom 2006,
70:259-269.
30. Dohner H, Stilgenbauer S, Benner A, Leupolt E, Krober A, Bullinger L,
Dohner K, Bentz M, Lichter P: Genomic aberrations and survival in chronic
lymphocytic leukemia. N Engl J Med 2000, 343:1910-1916.
31. Hallek M, Wanders L, Ostwald M, Busch R, Senekowitsch R, Stern S,
Schick HD, Kuhn-Hallek I, Emmerich B: Serum beta(2)-microglobulin and
serum thymidine kinase are independent predictors of progression-free
survival in chronic lymphocytic leukemia and immunocytoma. Leuk
Lymphoma 1996, 22:439-447.
32. Rai KR, Sawitsky A, Cronkite EP, Chanana AD, Levy RN, Pasternack BS:
Clinical staging of chronic lymphocytic leukemia. Blood 1975, 46:219-234.
33. Dal Bo M, Bertoni F, Forconi F, Zucchetto A, Bomben R, Marasca R,
Deaglio S, Laurenti L, Efremov DG, Gaidano G, Del PG, Gattei V: Intrinsic
and extrinsic factors influencing the clinical course of B-cell chronic
lymphocytic leukemia: prognostic markers with pathogenetic relevance.
J Transl Med 2009, 7:76.
34. Thurmes P, Call T, Slager S, Zent C, Jenkins G, Schwager S, Bowen D, Kay N,
Shanafelt T: Comorbid conditions and survival in unselected, newly
diagnosed patients with chronic lymphocytic leukemia. Leuk Lymphoma
2008, 49:49-56.
35. Bomben R, Dal Bo M, Capello D, Benedetti D, Marconi D, Zucchetto A,
Forconi F, Maffei R, Ghia EM, Laurenti L, Bulian P, Del Principe MI,
Palermo G, Thorselius M, Degan M, Campanini R, Guarini A, Del Poeta G,
Rosenquist R, Efremov DG, Marasca R, Foa R, Gaidano G, Gattei V:
Comprehensive characterization of IGHV3-21-expressing B-cell chronic
Rossi et al. Journal of Translational Medicine 2010, 8:23
/>Page 10 of 11
lymphocytic leukemia: an Italian multicenter study. Blood 2007,
109:2989-2998.
36. Rossi D, Zucchetto A, Rossi FM, Capello D, Cerri M, Deambrogi C, Cresta S,
Rasi S, De PL, Bodoni CL, Bulian P, Del PG, Ladetto M, Gattei V, Gaidano G:
CD49d expression is an independent risk factor of progressive disease
in early stage chronic lymphocytic leukemia. Haematologica 2008,
93:1575-1579.
37. Hamblin TJ, Davis Z, Gardiner A, Oscier DG, Stevenson FK: Unmutated Ig V
(H) genes are associated with a more aggressive form of chronic
lymphocytic leukemia. Blood 1999, 94:1848-1854.
38. Krober A, Bloehdorn J, Hafner S, Buhler A, Seiler T, Kienle D, Winkler D,
Bangerter M, Schlenk RF, Benner A, Lichter P, Dohner H, Stilgenbauer S:
Additional genetic high-risk features such as 11q deletion, 17p deletion,
and V3-21 usage characterize discordance of ZAP-70 and VH mutation
status in chronic lymphocytic leukemia. J Clin Oncol 2006, 24:969-975.
39. Laurenti L, Petlickovski A, Rumi C, Gobessi S, Piccioni P, Tarnani M,
Puggioni P, Marietti S, Sica S, Leone G, Efremov DG: Comparison of ZAP-
70/Syk mRNA levels with immunoglobulin heavy-chain gene mutation
status and disease progression in chronic lymphocytic leukemia.
Haematologica 2005, 90:1533-1540.
40. Herishanu Y, Kay S, Rogowski O, Pick M, Naparstek E, Deutsch VR, Polliack A:
T-cell ZAP-70 overexpression in chronic lymphocytic leukemia (CLL)
correlates with CLL cell ZAP-70 levels, clinical stage and disease
progression. Leukemia 2005, 19:1289-1291.
41. Abousamra NK, El-Din MS, Azmy E: T-cell CD38 expression in B-chronic
lymphocytic leukaemia. Hematol Oncol 2009, 27:82-89.
42. Roth A, de BD, Nuckel H, Sellmann L, Duhrsen U, Durig J, Baerlocher GM:
Significantly shorter telomeres in T-cells of patients with ZAP-70+/CD38
+ chronic lymphocytic leukaemia. Br J Haematol 2008, 143:383-386.
43. Tinhofer I, Rubenzer G, Holler C, Hofstaetter E, Stoecher M, Egle A,
Steurer M, Greil R: Expression levels of CD38 in T cells predict course of
disease in male patients with B-chronic lymphocytic leukemia. Blood
2006, 108:2950-2956.
44. Tinhofer I, Weiss L, Gassner F, Rubenzer G, Holler C, Greil R: Difference in
the relative distribution of CD4+ T-cell subsets in B-CLL with mutated
and unmutated immunoglobulin (Ig) VH genes: implication for the
course of disease. J Immunother 2009, 32:302-309.
45. Hjalmar V, Hast R, Kimby E: Cell surface expression of CD25, CD54, and
CD95 on B- and T-cells in chronic lymphocytic leukaemia in relation to
trisomy 12, atypical morphology and clinical course. Eur J Haematol 2002,
68:127-134.
46. Gorgun G, Holderried TA, Zahrieh D, Neuberg D, Gribben JG: Chronic
lymphocytic leukemia cells induce changes in gene expression of CD4
and CD8 T cells. J Clin Invest 2005, 115:1797-1805.
47. Wilhelm C, Neubauer A, Brendel C: Discordant results of flow cytometric
ZAP-70 expression status in B-CLL samples if different gating strategies
are applied. Cytometry B Clin Cytom 2006, 70:242-250.
48. Marti G, Orfao A, Goolsby C: ZAP-70 in CLL: towards standardization of a
biomarker for patient management: history of clinical cytometry special
issue. Cytometry B Clin Cytom 2006, 70:197-200.
doi:10.1186/1479-5876-8-23
Cite this article as: Rossi et al.: Prognostic impact of ZAP-70 expression
in chronic lymphocytic leukemia: mean fluorescence intensity T/B ratio
versus percentage of positive cells. Journal of Translational Medicine 2010
8:23.
Submit your next manuscript to BioMed Central
and take full advantage of:
• Convenient online submission
• Thorough peer review
• No space constraints or color figure charges
• Immediate publication on acceptance
• Inclusion in PubMed, CAS, Scopus and Google Scholar
• Research which is freely available for redistribution
Submit your manuscript at
www.biomedcentral.com/submit
Rossi et al. Journal of Translational Medicine 2010, 8:23
/>Page 11 of 11