Báo cáo hóa học: "Regulatory T cell frequency in patients with melanoma with different disease stage and course, and modulating effects of high-dose interferon-a 2b treatment" pptx
Bạn đang xem bản rút gọn của tài liệu. Xem và tải ngay bản đầy đủ của tài liệu tại đây (1.07 MB, 13 trang )
Ascierto et al. Journal of Translational Medicine 2010, 8:76
/>
RESEARCH
Open Access
Regulatory T cell frequency in patients with
melanoma with different disease stage and
course, and modulating effects of high-dose
interferon-a 2b treatment
Paolo A Ascierto1*, Maria Napolitano1, Egidio Celentano1, Ester Simeone1, Giusy Gentilcore1, Antonio Daponte1,
Mariaelena Capone1, Corrado Caracò1, Rosa Calemma1, Gerardo Beneduce1, Margherita Cerrone1,
Vincenzo De Rosa1, Giuseppe Palmieri2, Giuseppe Castello1, John M Kirkwood3, Francesco M Marincola4,
Nicola Mozzillo1
Abstract
Background: High-dose interferon-alpha 2b (IFN-a 2b) is the only approved systemic therapy in the United States
for the adjuvant treatment of melanoma. The study objective was to explore the immunomodulatory mechanism
of action for IFN-a 2b by measuring serum regulatory T cell (Treg), serum transforming growth factor-b (TGF-b),
interleukin (IL)-10, and autoantibody levels in patients with melanoma treated with the induction phase of the
high-dose IFN-a 2b regimen.
Methods: Patients with melanoma received IFN-a 2b administered intravenously (20 MU/m2 each day from day 1
to day 5 for 4 consecutive weeks). Serum Treg levels were measured as whole lymphocytes in CD4+ cells using
flow cytometry while TGF-b, IL-10, and autoantibody levels were measured using enzyme-linked immunosorbent
assays.
Results: Twenty-two patients with melanoma received IFN-a 2b treatment and were evaluated for Treg levels.
Before treatment, Treg levels were significantly higher in patients with melanoma when compared with data from
20 healthy subjects (P = 0.001; Mann-Whitney test). Although a trend for reduction of Treg levels following IFN-a
2b treatment was observed (average decrease 0.29% per week), statistical significance was not achieved. Subgroup
analyses indicated higher baseline Treg levels for stage III versus IV disease (P = 0.082), early recurrence versus no
recurrence (P = 0.017), deceased versus surviving patients (P = 0.021), and preoperative neoadjuvant versus
postoperative adjuvant treatment groups (not significant). No significant effects were observed on the levels of
TGF-b, IL-10, and autoantibodies in patients with melanoma treated with IFN-a 2b.
Conclusions: Patients with melanoma in this study showed increased basal levels of Treg that may be relevant to
their disease and its progression. Treg levels shifted in patients with melanoma treated with IFN-a 2b, although no
firm conclusions regarding the role of Tregs as a marker of treatment response or outcome can be made at
present.
* Correspondence:
1
Unit of Medical Oncology and Innovative Therapy and Melanoma
Cooperative Group, National Tumor Institute, Naples, Italy
Full list of author information is available at the end of the article
© 2010 Ascierto et al; licensee BioMed Central Ltd. This is an Open Access article distributed under the terms of the Creative Commons
Attribution License ( which permits unrestricted use, distribution, and reproduction in
any medium, provided the original work is properly cited.
Ascierto et al. Journal of Translational Medicine 2010, 8:76
/>
Background
High-dose interferon (HDI)-alpha 2b (IFN-a 2b) is the
only approved adjuvant systemic therapy for resected,
high-risk melanoma in the United States [1]. The
approved regimen for HDI consists of an induction
phase of 20 MU/m2 intravenously (iv) 5 times per week
for 4 weeks, followed by a maintenance phase of 10
MU/m 2 subcutaneously (sc) 3 times per week for 48
weeks [1]. In some European countries (Germany, Austria, Switzerland, and France) the standard of care for
the adjuvant treatment of melanoma tends to be lowdose IFN (LDI; 3 MU per day 3 times each week), while
neither HDI nor LDI is approved for use in other countries (e.g., United Kingdom and The Netherlands) [2].
Efficacy data from several pivotal trials have shown
that adjuvant IFN-a 2b [3,4] and pegylated interferon-a
2b (Peg-IFN-a 2b) [5] significantly prolong relapse-free
survival (RFS), but not overall survival (OS) compared
with observations in high-risk patients with melanoma.
These findings were reinforced in 2 separate meta-analyses of randomized trials investigating IFN-a 2b versus
observation in high-risk patients with melanoma [6,7].
Some studies with IFN have shown evidence for an OS
benefit. For example, the E1684 trial of HDI (with IFNa 2b) in high-risk patients with melanoma demonstrated
a statistically significant RFS and OS benefit [8], and in
a recent study in patients with melanoma that had
spread to the regional lymph nodes, LDI (with IFN-a
2a) given sc 3 times a week for 2 years significantly
improved OS and disease-free survival (DFS) [9].
An individual patient data meta-analysis of randomized melanoma trials, covering a wide range of IFN
dose regimens, suggested that the benefits of IFN are
independent of dose or therapy duration, and translate
into an absolute OS benefit of approximately 3% (95%
confidence interval [CI]: 1%-5%) at 5 years [10].
Optimal dose and duration of IFN-a 2b therapy are
not yet clear [2,11,12], but a better understanding of the
mechanism of action may help to potentiate the clinical
efficacy and reduce the toxicity [13] of IFN-a 2b/PegIFN-a 2b. Numerous studies suggest that the mechanism of action of IFN in melanoma is primarily immunomodulatory [14-18]. Efforts to elucidate this mechanism
of action have focused upon the modulation of signal
transducers and activators of transcription signaling and
immunoregulatory responses mediated by regulatory T
cells (Tregs) [19,20].
Recent evidence for the possibility of IFN acting
through an indirect immunomodulatory mechanism has
been reported [17,18]. In the Hellenic Oncology Cooperative Group trial [17], the development of autoantibodies or clinical manifestations of autoimmunity were
associated with statistically significant improvements in
Page 2 of 13
RFS and OS in the IFN-a 2b induction only treatment
arm as well as in the extended IFN-a 2b arm. Additionally, Moschos et al. [18] demonstrated that clinical
responders treated with neoadjuvant IFN-a 2b had significantly greater increases in endotumoral CD11c+ and
CD3+ cells and significantly greater decreases in endotumoral CD83+ cells compared with nonresponders. However, a recently published subanalysis of the European
Organization for Research and Treatment of Cancer
(EORTC) 18952 and Nordic IFN trials suggests that
appearance of autoantibodies was not strongly associated with improved clinical outcome when a correction was made for guarantee-time bias [21]. These data
are contrary to the findings of Gogas et al. [17]; it
should be noted, however, that the data were obtained
from subsets of patients using different assays performed
in separate laboratories, whereas the Hellenic trial data
were from a prospectively designed study, obtained on
full patient sets without exclusions. Further evidence for
the induction of autoimmunity by IFN-a 2b was
observed in the Eastern Cooperative Oncology Group
(ECOG)-intergroup E2696 phase II trial which suggested
that autoimmunity was a predictive biomarker of RFS
with HDI when compared with the GM2-KLH/QS-1
(GMK) vaccine [16].
Tregs are a suppressive CD4+ T cell population that
is present, along with primed effector T cells, in tumor
and tumor-draining lymph nodes [22]. Tregs express
high levels of surface antigens such as CD25, cytotoxic
T lymphocyte-associated antigen 4 (CTLA-4), and glucocorticoid-induced tumor necrosis factor receptor
(GITR) [23,24]. Tregs also express a characteristic
intracellular nuclear transcription regulator, forkhead
box p3 (Foxp3) [25,26]. The presence of Tregs in
tumor-draining lymph nodes and tumors may serve as
a basis of potential inhibition of host effector cell function. Thus, depletion of Tregs or blockade of Treg
function using antibodies or other strategies targeting
Tregs might abrogate this Treg suppression and
enhance antitumor immunity [27]. A recent study published by Cesana et al. [28] demonstrated that melanoma and renal cell carcinoma (RCC) patients had
increased basal Treg levels. There was also a reduction
in Treg levels in those patients who achieved an objective clinical response to high-dose bolus interleukin
(IL)-2 therapy [28]. Another study investigated the
effects of IFN-a and IL-2 therapy on Treg levels in
patients with RCC [29]. Patients who responded to
IFN-a therapy had lower Treg cell levels before treatment than did patients whose disease progressed, these
results suggest that low Treg levels before IFN-a treatment may be a prognostic factor for better clinical outcome in patients with RCC [29].
Ascierto et al. Journal of Translational Medicine 2010, 8:76
/>
Previously, we reported preliminary data indicating a
decrease in peripheral blood Treg levels in patients with
melanoma treated with HDI [14,30]. In order to explore
clinical outcome in relation to Treg levels, we conducted
a translational study in patients with stage III or IV melanoma. We examined whether neoadjuvant (before surgery) or adjuvant (after surgery in patients with no
evidence of disease) therapy with the iv induction phase
of the U.S. Food and Drug Administration (FDA)approved HDI regimen affected the number of Treg
cells in the peripheral blood. As secondary analyses, the
effects of IFN-a 2b on serum transforming growth factor-b (TGF-b), IL-10, and autoantibody levels were also
measured, along with efficacy and safety.
Patients and methods
Patients
Patients with stage III and IV operable and inoperable
melanoma who were referred to the National Cancer
Institute of Naples from July 2006 to December 2008
were enrolled to receive treatment with IFN-a 2b. The
study received ethical approval from the ‘Comitato Tecnico Scientifico’ institutional review board (ref M2/12),
and all patients were required to give written informed
consent for both the treatment and additional blood
samples for serum Treg, TGF-b, IL-10, and autoantibody levels. Before starting treatment all patients were
evaluated for disease stage using a whole body computed tomography (CT) scan. Patients were required to
meet the following eligibility criteria: stage III melanoma
after radical surgery or stage III/IV patients who were
unsuitable for primary radical surgery but who may benefit from neoadjuvant IFN-a 2b treatment; ECOG performance status of 0 to 1; adequate hematologic
function (whole blood count > 3 × 10⁹/L, neutrophils
> 1.5 × 10 9 /L, and platelets > 100 × 10 9 /L); adequate
renal function (serum creatinine ≤ 1 × upper limit of normal range [ULN]) and adequate liver function (serum
bilirubin < 1.5 × ULN and aspartate transaminase/alanine
transaminase ≤ 2.5 × ULN); and adequate cardiac function. Exclusion criteria were: brain metastases (including
excised) and disseminated metastatic disease; a history of
cardiac disease (e.g., angina, arrhythmia, cardiomiopathy,
acute coronary syndrome, and myocardial infarction);
uncontrolled diabetes mellitus; thyroid function disorders; a history of psychiatric illness and depression; and a
history of autoimmune disease.
Control groups
The peripheral blood samples of healthy subjects who
visited the Transfusion Medicine Unit of the National
Cancer Institute of Naples were used as controls for the
evaluation of basal Treg levels following assessment of
samples for infections and other diseases.
Page 3 of 13
In addition, the peripheral blood samples of patients
with stage I to IV melanoma who did not receive treatment with IFN-a 2b were evaluated for basal Treg
levels. These patients were also referred to the National
Cancer Institute of Naples from July 2006 to December
2008.
IFN-a 2b treatment
During the first week of treatment, all patients were
hospitalized to evaluate tolerability. Providing no severe
toxicity was observed, patients were referred to daily
outpatient treatment for the remaining 3 weeks. Prior to
administration of the first dose it was essential that all
blood examinations, electrocardiography, and cardiac
ultrasound were normal. IFN-a 2b was administered iv
at a dose of 20 MU/m2 each day from day 1 to day 5
for 4 consecutive weeks. Maintenance sc IFN as used in
the original E1684 HDI regimen was not included in the
therapy planned in this trial [10,14]. A dose reduction of
25% to 30% was permitted if grade 2 to 3 toxicities were
observed, and treatment discontinuation was allowed for
any grade 4 toxicity or for patient refusal of treatment.
Follow-up
All patients were followed up between July 2006 and
November 2009 to assess DFS (early vs. late recurrence)
and survival (alive vs. deceased patients) according to
specific National Cancer Institute of Naples internal
guidelines. Every 3 months the following assessments
were performed for all patients: clinical examination, a
regional lymph node ultrasound scan, and an abdominal
ultrasound scan. A CT scan was performed every 6
months for patients with stage IV melanoma and every
12 months for patients with stage III melanoma. Magnetic resonance imaging (MRI), positron emission tomography (PET), and bone scintigraphy scans were
performed if clinically suspicious signs emerged from
the other examinations. Patients were defined as having
better prognosis if the disease did not progress during
the time of the study. Patients whose disease progressed
during the time of the study were defined as having
poor prognosis.
Blood sampling
Whole peripheral blood was collected into EDTA KE/
2.7 mL tubes (S-Monovette®; Sarstedt, Nümbrecht, Germany) for isolation of peripheral blood mononuclear
cells (PBMCs) at days 0, 8, 15, 22, and 29 during IFN-a
2b therapy. An additional 7 mL of peripheral blood was
collected in Serum Gel S/7.5 mL plus tubes (S-Monovette®; Sarstedt) at the same time as PBMC isolation for
assessment of autoantibodies, TGF-b, and IL-10. The
serum samples were immediately processed, stored
upright for 10 min, then centrifuged at 4°C in a
Ascierto et al. Journal of Translational Medicine 2010, 8:76
/>
horizontal rotor at 3000 rpm for 10 min. The samples
were frozen, stored at -80°C, thawed, and tested simultaneously. Thawed aliquots were used only once.
Assessment of Treg levels
The Treg levels (%) were measured utilizing a flow cytometry assay for whole lymphocytes in CD4+ cells. The
cells were stained with combinations of the following
antibodies: anti-CD25-phycoerythrin (PE)–cyanin (Cy)
5.5, anti-CD4-peridinin chlorophyll protein, anti-CD8allophycocyanin (APC), anti-CD3-APC-Cy7, and isotype
controls (BD Biosciences; San Jose, CA, USA). The test
tubes were then incubated in the dark for 30 min and
then washed with phosphate buffered saline. For intracellular staining of Foxp3-phycoerythrin, anticoagulated
whole blood samples were fixed and permeabilized with
the use of Foxp3 Staining Buffer Set (eBioscience; San
Diego, CA, USA) according to the manufacturer’s
instructions. The PE-conjugated antibody clone used
against Foxp3 was PCH101.
Data acquisition and analysis were performed using
the FACSCanto™ II flow cytometry system and FACSdiva™ software (BD Biosciences; San Jose, CA, USA)
with a standard 6-color filter configuration. Lymphocytes were gated via their forward and side scatter properties, and T cells were identified based on their
expression of CD4 and CD3.
To discriminate between CD25high Treg and CD25low
activated effector-memory T cells, we used CD25
expression on CD8+ cells as an internal control. Only
CD4+ cells expressing CD25 with higher intensities than
the CD8+ cells were included in the gate for CD25high
cells. The gate for CD25low cells was set to include cells
expressing CD25 at levels above those of the isotype
control and unstained cells, but at lower expression
levels than the CD25high cells.
This was a phenotypical evaluation of Treg levels,
therefore no functional assays or suppression assays
were performed to assess Treg levels.
TGF-b and IL-10 ELISA
Quantitative sandwich enzyme-linked immunosorbent
assay (ELISA) was used to measure concentrations of
serum TGF-b1 and IL-10, by means of a commercially
available kit from Bender MedSystems (Vienna, Austria),
according to the manufacturer’s instructions.
Autoantibody detection
Semi-quantitative detection of serum autoantibodies was
carried out by assessing antinuclear antibody (antiANA), anti-cardiolipin antibodies (anti-ACA immunoglobulin [Ig]; QUANTA Lite™ ELISA kit; INOVA Diagnostics, Inc., San Diego, CA, USA), anti-double stranded
DNA (anti-dsDNA), and anti-thyroglobulin (anti-HTG;
Page 4 of 13
Roche Diagnostics GmbH, Mannheim, Germany). Each
patient sample was diluted 1:101 with horseradish peroxidase (HRP) sample diluent and run in duplicate; the
method required prediluted ELISA calibrator, and
ELISA negative and positive controls. A 100 μL aliquot
of each sample was added to the microwell plate and
incubated for 30 min at room temperature. After 3
washes with HRP, the wash buffer was diluted 1:40,
then 100 μL of the HRP-IgG conjugate was added to
each well, and the plate incubated for 30 min at room
temperature. After 3 washes, 100 μL of 3,3′,5,5′-tetramethylbenzidine (TMB) chromogen was added to each
well, and the wells incubated in the dark for 30 min at
room temperature followed by the addition of 100 μL of
HRP stop solution. The absorbance of each well
was measured at reference wavelengths of 450 nm and
620 nm.
Efficacy outcomes
The primary outcome measure in the neoadjuvant setting was change in tumor size and status, and the consideration of operability from inoperable to operable
following therapy (neoadjuvant setting) or DFS status
(standard postoperative adjuvant setting). Response evaluation criteria in solid tumors (RECIST) were used to
evaluate tumor response. RFS in the entire and adjuvant/neoadjuvant patient populations was also evaluated
in this study.
Safety
The National Cancer Institute-Common Terminology
Criteria for Adverse Events (NCI-CTCAE) version 3.0
was used to assess toxicity.
Statistical methods
All analyses were performed using the Statistical Package for Social Sciences for Windows, following recommended procedures (SPSS® for Windows Version 12.0;
SPSS, Inc., Chicago, IL, USA).
Levels of Treg (%), TGF-b (ng/mL), IL-10 (pg/mL),
and autoantibodies (U/L or IU/mL) were scrutinized
using descriptive procedures. The distributions of these
values were compared by time (weeks) from serum
drawing, and basal values were also compared by disease
stage (I to IV), treatment (adjuvant vs. neoadjuvant),
prognosis (early recurrence vs. no recurrence), and disease status at follow-up (alive vs. deceased). Box plots
were used to show distributions in different patient subgroups. In each box plot, median values are represented
by the horizontal line inside the boxes, the upper and
lower boundaries of the boxes indicate first and third
quartiles of the distribution, whiskers represent mild
outliers (i.e., values lying within 1.5 box lengths from
either end of the box), open dots are outliers (i.e., values
Ascierto et al. Journal of Translational Medicine 2010, 8:76
/>
Page 5 of 13
lying between 1.5 and 3 box lengths from either end of
the box), and asterisks represent extreme outliers (i.e.,
values lying more than 3 box lengths from either end of
the box). The Mann-Whitney test was used to compare
median values of Tregs between subgroups of patients
at baseline according to treatment type, prognosis, stage,
status at follow-up, between treated patients versus
healthy donors, and both untreated and treated patients
versus healthy donors. In each case, significance was
established as P < 0.05. Mean percentage Treg levels
were also calculated to verify the weekly percentage
variation. RFS in the entire and adjuvant patient populations was estimated using the Kaplan-Meier method.
Results
Patient characteristics
Patient characteristics are shown in Table 1 for the 22
patients treated with IFN-a 2b, the 22 patients not treated with IFN-a 2b, and the 20 healthy subjects. Of the
22 treated patients, 17 (77%) received postoperative
adjuvant IFN-a 2b therapy and 5 (23%) received preoperative neoadjuvant IFN-a 2b therapy. Two of the
stage IV patients had lung metastases and 1 had distant
lymph node metastases. At the time of analysis, the 22
patients with melanoma who did not receive treatment
with IFN-a 2b were at the following stages of disease:
stage I (n = 4); stage II (n = 2); stage III (n = 6, refused
treatment); and stage IV (n = 10).
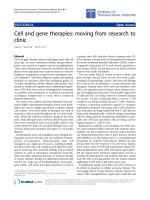
The Treg levels (%) were established using flow cytometric analysis (on days 0, 8, 15, 22, and 29) of the peripheral blood of each patient with melanoma treated with
IFN-a 2b. An example of the gates for CD4 + CD25 +HF
and CD4+CD25+HFFoxp3+ are shown in Figure 1, which
enabled the evaluation of the percentage of CD4+CD25
+HF
Foxp3+ cells. Region P4 on Figure 1C represents the
Foxp3+CD4+CD25+ cells used to calculate the percentage
of Treg cells in CD4+ lymphocytes.
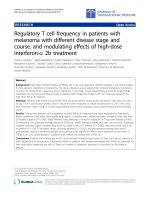
As shown in Figure 2A, higher basal Treg values were
observed in the 22 patients with melanoma before treatment with IFN-a 2b compared with the 20 untreated
healthy subjects (P = 0.001). Figure 2B shows the Treg
basal level distribution in the 20 healthy donors and by
stage in the 44 patients with melanoma (22 patients
treated in this study and the other 22 patients who were
referred to our institution during the study); these data
again suggest that Treg values are higher in patients
with melanoma (P <0.01 for increased Tregs in all melanoma patients vs healthy subjects). There was a trend
for an increase in Treg levels by increase in stage of
disease, but this was not statistically significant.
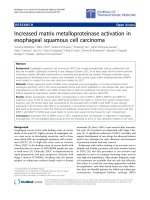
Subgroup comparisons for basal Treg levels before
treatment are shown in Figures 3A-D. Although not statistically significant, patients scheduled to receive IFN-a
2b in the postoperative adjuvant setting had lower basal
Treg levels than those in the preoperative neoadjuvant
group, as illustrated in Figure 3A. At baseline, patients
with stage III melanoma had lower Treg levels than
stage IV patients (P = 0.082; Figure 3B). Figure 3C illustrates that patients with early recurrence exhibited significantly greater basal Treg values than those with no
recurrence (P = 0.017). Significantly lower basal Treg
values were measured in surviving patients at the time
of analysis compared with patients that later deceased
(P = 0.021; Figure 3D).
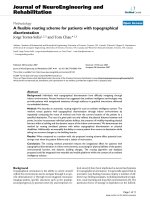
Effects of IFN-a 2b on Tregs
The Treg levels by week in patients treated with IFN-a
2b are shown in Figures 4A (individual patients) and B
(all patients). For individual patients (Figure 4A), 14 of
22 (63.6%) patients showed a decrease in Treg cells in
Table 1 Subject characteristics
IFN-a 2b-treated
patients with
melanoma
Untreated
patients with
melanoma
Healthy
subjects
22
22
20
43.0
43.5
44.8
12 (55)
10 (45)
10
12
13
7
I
N/A
4 (18.3)
N/A
N/A
N/A
II
N/A
2 (9.2)
N/A
N/A
N/A
IFN-a 2b therapy,
n (%)
Adjuvant
Subjects, n
Mean age, years
Neoadjuvant
Sex, n (%)
Male
Female
Melanoma stage, n (%)
IIIA
12 (54.5)
2* (9.2)
N/A
12 (54.5)
0
IIIC
3 (13.7)
4* (18.3)
N/A
1 (4.5)
2 (9.1)
IV
7 (31.8)
10 (45)
N/A
4 (18.2)
3 (13.7)
N/A, not applicable; IFN-a 2b, interferon-a 2b.
*Refused treatment.
Ascierto et al. Journal of Translational Medicine 2010, 8:76
/>
Page 6 of 13
Figure 1 Flow cytometry: percentage of CD4+CD25+HFFoxp3+ cells in interferon-a 2b-treated patients with melanoma. Flow cytometric
gating strategy to identify Treg cells. (A) Dot plot of forward scatter (FSC) versus side scatter (SSC) for all events: all peripheral blood cell
populations are shown in red; the population of lymphocytes is shown in green. (B) Lymphocytes (green) were analyzed on the basis of surface
markers CD4 and CD25; the P3 gate identifies the percentage of CD4+CD25+HF cells. (C) The P4 gate identifies the percentage of Foxp3+CD4
+
CD25+HF cells; this represents the region used to calculate the final percentage of Treg cells in CD4+ lymphocytes.
peripheral blood during treatment with IFN-a 2b, in
1 patient there was no change (#15), while in all the
other patients an increase in Treg was observed. Overall,
a gradual decrease in Treg values was observed over
time, although this was not statistically significant (Figure 4B). The mean percentage of Tregs was 2.7% at day
0 and 1.4% at day 29. The average reduction was 1.4%,
representing a 50% reduction in the average Treg levels.
Statistical analysis showed an average decrease of 0.29%
per week of treatment (mean data not shown).
Following treatment with IFN-a 2b, no statistically
significant differences were observed in the patient subgroups analyzed (adjuvant vs neoadjuvant IFN-a 2b,
stage III vs stage IV, early recurrence vs no recurrence
Figure 2 Comparison of regulatory T cell levels at baseline in patients with melanoma and healthy subjects. (A) Box plot showing
baseline regulatory T cell (Treg) levels in 22 patients with melanoma prior to interferon-a 2b (IFN-a 2b) treatment compared with 20 healthy
subjects (HS) (P = 0.001). (B) Box plot showing Treg levels by disease stage in 20 healthy subjects and 44 patients with melanoma (P <0.01 for
increased Tregs in all melanoma patients vs. healthy subjects); P = not significant for Treg increase by disease stage. Horizontal lines inside the
boxes = median values; upper and lower boundaries of the boxes = first and third quartiles of the distribution; whiskers = mild outliers; open
dots = outliers; and asterisks = extreme outliers.
Ascierto et al. Journal of Translational Medicine 2010, 8:76
/>
Page 7 of 13
Figure 3 Subgroup comparisons: regulatory T cell levels at baseline in patients with melanoma before treatment with interferon-a 2b.
Box plot subgroup comparisons of regulatory T cell (Treg) levels (%) at baseline in 22 patients with melanoma before treatment with interferona 2b (IFN-a 2b). (A) Adjuvant (ADJ) versus neoadjuvant (NEO) IFN-a 2b (P = not significant); (B) stage III versus stage IV (P = 0.082); (C) early
recurrence (ER) versus no recurrence (NR) (P = 0.017); (D) surviving (ALV) versus deceased (DCD) (P = 0.021). Horizontal lines inside the boxes =
median values; upper and lower boundaries of the boxes = first and third quartiles of the distribution; whiskers = mild outliers; open dots =
outliers; and asterisks = extreme outliers.
and surviving vs deceased) from baseline to the end of
the study (data not shown).
Effect of IFN-a 2b on TGF-b, IL-10, and autoantibody
levels
In addition to Tregs, the levels of TGF-b IL-10, and
autoantibodies (ANA, ACA, anti-dsDNA, and antiHTG) were measured in serum samples collected from
14 of the 22 patients with melanoma undergoing IFN-a
2b treatment in this study. No significant effects were
observed (Figure 5).
Efficacy
Kaplan-Meier curves for RFS in all 22 IFN-a 2b-treated
patients with melanoma and in the adjuvant/neoadjuvant populations are shown in Figures 6A and 6B,
respectively. The mean RFS estimates were 16.4 months
(95% CI: 11.0-21.7), 19.4 months (95% CI: 13.6-25.1)
and 10.3 months (95% CI: 4.2-16.4) for the entire population, the adjuvant population and the neoadjuvant
population, respectively (median estimates not
calculable).
Of the 5 patients who received neoadjuvant IFN-a 2b
therapy, 1 underwent radical surgery and had a RFS of
17 months and 1 had a complete response that was
maintained at a follow-up of 19 months. The other 3
patients progressed and then received chemotherapy.
Two patients received 6 cycles of dacarbazine (1000 mg/
m 2 every 3 weeks), with progressive disease and had
died at the time of analysis; the other patient received a
combination of cisplatin (75 mg/m2 on day 1 of a 28day cycle) and temozolomide (75 mg/m2 per day from
day 2 to day 22 of a 28-day cycle) [31], and after 3 cycles
had partial response in liver metastases. This patient
subsequently underwent surgery for liver metastases and
was disease-free for 12 months. At the time of analysis
Ascierto et al. Journal of Translational Medicine 2010, 8:76
/>
Page 8 of 13
Figure 4 Regulatory T cell levels by week in interferon-a 2b-treated patients with melanoma. (A) Individual regulatory T cell (Treg) levels
by week in the 22 patients with melanoma treated with interferon-a 2b. (B)Box plot showing circulating regulatory T cell (Treg) levels by week
in the 22 patients with melanoma treated with interferon-a 2b (P = not significant). Horizontal lines inside the boxes = median values; upper
and lower boundaries of the boxes = first and third quartiles of the distribution; whiskers = mild outliers; and open dots = outliers.
Ascierto et al. Journal of Translational Medicine 2010, 8:76
/>
Page 9 of 13
Figure 5 Determination of transforming growth factor-b, interleukin-10 and autoantibody in interferon-a 2b-treated patients with
melanoma. (A) Transforming growth factor-b (TGF-b), (B) interleukin (IL)-10, and serum autoantibodies: (C) antinuclear antibody (ANA), (D) anticardiolipin (ACA), (E) anti-double stranded DNA (anti-dsDNA), and (F) anti-thyroglobulin (anti-HTG) levels by week in 14/22 patients with
melanoma treated with interferon-a 2b. Horizontal lines inside the boxes = median values; upper and lower boundaries of the boxes = first and
third quartiles of the distribution; whiskers = mild outliers; open dots = outliers; and asterisks = extreme outliers.
this patient was still alive and was receiving a second
line of chemotherapy with fotemustine following the
reappearance of liver and lung metastases.
Of the 17 patients treated with adjuvant IFN-a 2b, 4
patients had very rapid progressive disease and died following chemotherapy. Nine of 13 patients with disease
recurrence started chemotherapy (cisplatin and temozolomide as described above) [31]. Four of these patients
had progressive disease after 3 cycles and died; the
other 5 had stable disease for 6 months and at the time
of analysis were still alive.
Safety
Adverse events are summarized in Table 2. Hepatic
toxicity was the most frequent side effect, resulting in a
25% dose reduction in 10 patients. In general, nausea
and vomiting were more frequent during the first week
of treatment. Although they did not bring about therapy
Ascierto et al. Journal of Translational Medicine 2010, 8:76
/>
Page 10 of 13
Figure 6 Kaplan-Meier relapse-free survival curves. Kaplein-Meier relapse-free survival curves for (A) all 22 interferon-a 2b-treated patients
with melanoma and (B) patients receiving neoadjuvant versus adjuvant therapy.
discontinuation, the most frequent hematologic side
effects were lymphocytopenia and neutropenia, occurring at grade III in 2 (9%) and 3 (14%) patients, respectively. No grade IV adverse events or autoimmunity side
effects were observed in this study.
Discussion
This study aimed to provide an insight into the mechanism of action of IFN-a 2b in the adjuvant treatment of
melanoma. A link between an immunologic response,
measured by Treg cell numbers, and antitumor activity
was investigated.
We evaluated only the induction phase of the FDAapproved HDI regimen, which is now prospectively
being tested in the ECOG trial E1697 in comparison
with observation. The dose and duration of therapy as
selected was based upon the literature and meta-analyses, which now raise the question as to whether the iv
induction regimen of the E1684 HDI regimen is the
active component of the 1-year regimen [10,14]. Following recent publications relating to the reduction of dose
and duration of IFN-a 2b [11], there is an ongoing
debate [2,12] in the melanoma treatment community
regarding the optimum dosing schedule and duration of
treatment for IFN-a 2b in the adjuvant treatment of
melanoma.
The data presented support the earlier results of
Cesana et al. [28] and Tatsugami et al. [29] suggesting
Ascierto et al. Journal of Translational Medicine 2010, 8:76
/>
Page 11 of 13
Table 2 All adverse events observed in the 22 interferona 2b-treated patients with melanoma
Grade, n (%)
Adverse events*
I
II
III
IV
7 (31)
10 (45)
5 (23)
5 (23)
3 (14)
2 (9)
0
0
Hematologic
Neutropenia
Lymphocytopenia
Liver function
AST
15 (68)
13 (59)
10 (45)
0
ALT
20 (91)
15 (68)
12 (54)
0
Nonhematologic
Fatigue
17 (77)
6 (27)
2 (9)
0
Nausea
8 (36)
7 (32)
2 (9)
0
Vomiting
Anorexia
5 (22)
9 (40)
4 (18)
3 (14)
2 (9)
0
0
0
0
Diarrhea
3 (14)
0
0
Flu-like syndrome†
17 (77)
7 (31)
0
0
0
0
0
0
Autoimmunity
AST, aspartate transaminase; ALT, alanine transaminase.
*Assessed using the National Cancer Institute-Common Terminology Criteria
for Adverse Events version 3.0.
†
Flu-like syndrome includes headache, fever, myalgia, and chills.
that both patients with melanoma and RCC have
increased basal levels of Treg that may be relevant to
their disease and its progression. At baseline, higher
Treg levels were observed in patients with melanoma
compared with healthy subjects and the levels were significantly greater in patients with more advanced disease. Subgroup comparisons showed that substantial
variability in Treg levels was observed according to disease stage, outcome (recurrence/no recurrence, alive/
deceased), and type of treatment received (adjuvant/
neoadjuvant). Subgroup analyses according to prognosis
and disease outcome suggest that lower Treg values are
associated with better prognosis and greater chance of
survival in patients with melanoma. Statistically
significant correlations were measured for higher baseline Treg levels for stage III versus stage IV
disease (P = 0.082), early recurrence versus no
recurrence (P = 0.017) and deceased versus surviving
patients (P = 0.021). Although a clear trend for a reduction in Treg levels with HDI induction therapy in
patients with melanoma was observed, statistical significance was not reached. This may be due, in part, to the
small size of this study. In addition, it should be noted
that because this was a phenotypical evaluation of Treg
levels, no functional assays or Treg suppression assays
were performed for assessment of Treg levels. Another
possible caveat of the method used in this study is that
surface CD25 and intracellular Foxp3 expressions are
not strictly specific of Treg cells in humans, as both
these markers are upregulated after activation in a significant proportion of CD4+ non-regulatory T cells.
Several studies have shown that the appearance of
autoantibodies and clinical manifestations of autoimmunity were associated with significant improvements in
RFS and OS in patients with melanoma treated with
IFN-a 2b [16-18]. These data were not substantiated in
our study where no statistically significant effect of IFNa 2b on serum TGF-b, IL-10, and serum autoantibodies
was observed among the patients with melanoma; again
perhaps because of the small size of the sample. These
preliminary data have suggested that the evaluated
immunoregulatory proteins and autoantibodies are not
modulated by IFN-a 2b within the short interval studied
here.
Although not the main focus of this pilot study, efficacy of IFN-a 2b was assessed. In the 5 patients receiving neoadjuvant IFN-a 2b, 1 complete response was
observed that was maintained at a follow-up of
19 months. Another patient had a RFS of 17 months
after neoadjuvant therapy and radical surgery. Of the
17 patients receiving postoperative adjuvant IFN-a 2b,
13 developed disease recurrence. The toxicity profile of
IFN-a 2b was as expected based on previous clinical
experience [13]. A 25% dose reduction was required in
10 of 22 patients due to hepatic toxicity. No evidence of
autoimmunity was observed.
Conclusions
The main limitation of this study is its small sample
size. Our preliminary data suggest that Treg levels shift
during treatment with IFN-a 2b, although a direct effect
was not shown. There was no correlation of Treg levels
with either objective response or survival, and no conclusion regarding the role of Tregs in terms of response
to treatment or as a prognostic marker of outcome can
be inferred at this stage. Further data are awaited in
order to examine whether affecting Treg levels with
IFN-a 2b treatment may indeed contribute to the antitumor response. A better understanding of the mechanism of action of IFN-a 2b may facilitate the
development of treatment strategies to increase efficacy
and reduce toxicity, ultimately leading to a better standard of care for patients with melanoma.
Acknowledgements
This work was supported by the Italian Ministry of Health “Ricerca
Oncologica - Programma Integrato Oncologia” and Associazione UMANA
Onlus. The author wishes to thank Ilenia Visconti for data management.
Editorial support for this manuscript was provided by Stephen Gregson, PhD,
Evidence Scientific Solutions, Horsham, UK, and supported by Merck and Co.
Inc (formerly Schering Corporation).
Author details
1
Unit of Medical Oncology and Innovative Therapy and Melanoma
Cooperative Group, National Tumor Institute, Naples, Italy. 2Institute of
Biomolecular Chemistry-CNR, Trav. La Crucca, 3 - Baldinca Li Punti, Sassari,
Italy. 3Department of Medicine, Division of Hematology/Oncology, University
Ascierto et al. Journal of Translational Medicine 2010, 8:76
/>
of Pittsburgh Cancer Institute, Pittsburgh, PA, USA. 4Department of
Transfusion Medicine, Clinical Center, National Institute of Health, Bethesda,
MD, USA.
Authors’ contributions
PAA and FMM were responsible for the conception and design of the study.
PAA, MN, ES, GG, AD, MCa, CC, RC, GB, MCe, GC, and NM were responsible
for provision of study materials or patients. MN, GG, and MCa collected and
assembled data for the Treg assay. RC and GC were responsible for the TGFb and IL-10 assays. MCe and GB were involved with the autoantibody assay.
VDR was responsible for radiologic evaluation for neoadjuvant patients.
Patient follow-up was performed by ES, AD, CC, and NM. EC, PAA, GP, JMK,
and FMM contributed to data analysis and interpretation. All authors were
involved in manuscript writing and provided final approval of the
manuscript.
Competing interests
PAA participated in an advisory board for Bristol-Myers Squibb and has
received honoraria from Schering-Plough and Genta. JMK receives research
funding to the University of Pittsburgh from BMS, Pfizer, Lilly, and Intrexon,
and is on the Speaker Bureau of Schering-Plough. The other authors have
no competing interests to declare.
Received: 2 March 2010 Accepted: 16 August 2010
Published: 16 August 2010
References
1. Fecher LA, Flaherty KT: Where are we with adjuvant therapy of stage III
and IV melanoma in 2009? J Natl Compr Canc Netw 2009, 7:295-304.
2. Hauschild A: Adjuvant interferon alfa for melanoma: new evidence-based
treatment recommendations? Curr Oncol 2009, 16:3-6.
3. Kirkwood JM, Ibrahim JG, Sondak VK, Richards J, Flaherty LE, Ernstoff MS,
Smith TJ, Rao U, Steele M, Blum RH: High- and low-dose interferon alfa-2b
in high-risk melanoma: first analysis of intergroup trial E1690/S9111/
C9190. J Clin Oncol 2000, 18:2444-2458.
4. Kirkwood JM, Manola J, Ibrahim J, Sondak V, Ernstoff MS, Rao U: A pooled
analysis of eastern cooperative oncology group and intergroup trials of
adjuvant high-dose interferon for melanoma. Clin Cancer Res 2004,
10:1670-1677.
5. Eggermont AM, Suciu S, Santinami M, Testori A, Kruit WH, Marsden J,
Punt CJ, Salès F, Gore M, Mackie R, Kusic Z, Dummer R, Hauschild A,
Musat E, Spatz A, Keilholz U: Adjuvant therapy with pegylated interferon
alfa-2b versus observation alone in resected stage III melanoma: final
results of EORTC 18991 a randomised phase III trial. Lancet 2008,
372:117-126.
6. Wheatley K, Ives N, Hancock B, Gore M, Eggermont A, Suciu S: Does
adjuvant interferon-a for high-risk melanoma provide a worthwhile
benefit? A meta-analysis of the randomised trials. Cancer Treat Rev 2003,
29:241-252.
7. Pirard D, Heenen M, Melot C, Vereecken P: Interferon alpha as adjuvant
postsurgical treatment of melanoma: a meta-analysis. Dermatology 2004,
208:43-48.
8. Kirkwood JM, Strawderman MH, Ernstoff MS, Smith TJ, Borden EC, Blum RH:
Interferon alfa-2b adjuvant therapy of high-risk resected cutaneous
melanoma: the Eastern Cooperative Oncology Group Trial EST 1684. J
Clin Oncol 1996, 14:7-17.
9. Garbe C, Radny P, Linse R, Dummer R, Gutzmer R, Ulrich J, Stadler R,
Weichenthal M, Eigentler T, Ellwanger U, Hauschild A: Adjuvant low-dose
interferon a2a with or without dacarbazine compared with surgery
alone: a prospective-randomized phase III DeCOG trial in melanoma
patients with regional lymph node metastasis. Ann Oncol 2008,
19:1195-1201.
10. Wheatley K, Ives N, Eggermont A, Kirkwood J, Cascinelli N, Markovic SN,
Hancock B, Lee S, Suciu S, on behalf of International Malignant Melanoma
Collaborative G: Interferon-a as adjuvant therapy for melanoma: an
individual patient data meta-analysis of randomised trials. J Clin Oncol
(Meeting Abstracts) 2007, 25:8526.
11. Pectasides D, Dafni U, Bafaloukos D, Skarlos D, Polyzos A, Tsoutsos D,
Kalofonos H, Fountzilas G, Panagiotou P, Kokkalis G, Papadopoulos O,
Castana O, Papadopoulos S, Stavrinidis E, Vourli G, Ioannovich J, Gogas H:
Randomized phase III study of 1 month versus 1 year of adjuvant high-
Page 12 of 13
12.
13.
14.
15.
16.
17.
18.
19.
20.
21.
22.
23.
24.
25.
26.
27.
28.
29.
30.
dose interferon alfa-2b in patients with resected high-risk melanoma. J
Clin Oncol 2009, 27:939-944.
Agarwala SS, Gray RJ, Wong MK: Duration of high-dose interferon alfa-2b
regimen for resected high-risk melanoma. J Clin Oncol 2009, 27:e82-83.
Kirkwood JM, Bender C, Agarwala S, Tarhini A, Shipe-Spotloe J, Smelko B,
Donnelly S, Stover L: Mechanisms and management of toxicities
associated with high-dose interferon alfa-2b therapy. J Clin Oncol 2002,
20:3703-3718.
Ascierto PA, Kirkwood JM: Adjuvant therapy of melanoma with interferon:
lessons of the past decade. J Transl Med 2008, 6:62.
de La Salmonière P, Grob JJ, Dreno B, Delaunay M, Chastang C: White
blood cell count: a prognostic factor and possible subset indicator of
optimal treatment with low-dose adjuvant interferon in primary
melanoma. Clin Cancer Res 2000, 6:4713-4718.
Stuckert JJ II, Tarhini AA, Lee S, Sander C, Kirkwood JM: Interferon alfainduced autoimmunity and serum S100 levels as predictive and
prognostic biomarkers in high-risk melanoma in the ECOG-intergroup
phase II trial E2696. J Clin Oncol (Meeting Abstracts) 2007, 25:8506.
Gogas H, Ioannovich J, Dafni U, Stavropoulou-Giokas C, Frangia K,
Tsoutsos D, Panagiotou P, Polyzos A, Papadopoulos O, Stratigos A,
Markopoulos C, Bafaloukos D, Pectasides D, Fountzilas G, Kirkwood JM:
Prognostic significance of autoimmunity during treatment of melanoma
with interferon. N Engl J Med 2006, 354:709-718.
Moschos SJ, Edington HD, Land SR, Rao UN, Jukic D, Shipe-Spotloe J,
Kirkwood JM: Neoadjuvant treatment of regional stage IIIB melanoma
with high-dose interferon alfa-2b induces objective tumor regression in
association with modulation of tumor infiltrating host cellular immune
responses. J Clin Oncol 2006, 24:3164-3171.
Wang W, Edington HD, Rao UN, Jukic DM, Land SR, Ferrone S, Kirkwood JM:
Modulation of signal transducers and activators of transcription 1 and 3
signaling in melanoma by high-dose IFNa2b. Clin Cancer Res 2007,
13:1523-1531.
Wang W, Edington HD, Rao UN, Jukic DM, Radfar A, Wang H, Kirkwood JM:
Effects of high-dose IFNa2b on regional lymph node metastases of
human melanoma: modulation of STAT5, FOXP3, and IL-17. Clin Cancer
Res 2008, 14:8314-8320.
Bouwhuis MG, Suciu S, Collette S, Aamdal S, Kruit WH, Bastholt L, Stierner U,
Salès F, Patel P, Punt CJ, Hernberg M, Spatz A, ten Hagen TL, Hansson J,
Eggermont AM: Autoimmune antibodies and recurrence-free interval in
melanoma patients treated with adjuvant interferon. J Natl Cancer Inst
2009, 101:869-877.
Hiura T, Kagamu H, Miura S, Ishida A, Tanaka H, Tanaka J, Gejyo F,
Yoshizawa H: Both regulatory T cells and antitumor effector T cells are
primed in the same draining lymph nodes during tumor progression. J
Immunol 2005, 175:5058-5066.
Takahashi T, Tagami T, Yamazaki S, Uede T, Shimizu J, Sakaguchi N, Mak TW,
Sakaguchi S: Immunologic self-tolerance maintained by CD25+CD4+
regulatory T cells constitutively expressing cytotoxic T lymphocyteassociated antigen 4. J Exp Med 2000, 192:303-310.
Shimizu J, Yamazaki S, Takahashi T, Ishida Y, Sakaguchi S: Stimulation of
CD25+CD4+ regulatory T cells through GITR breaks immunological selftolerance. Nat Immunol 2002, 3:135-142.
Hori S, Nomura T, Sakaguchi S: Control of regulatory T cell development
by the transcription factor Foxp3. Science 2003, 299:1057-1061.
Gabriel EM, Lattime EC: Anti-CTL-associated antigen 4: are regulatory T
cells a target? Clin Cancer Res 2007, 13:785-788.
Viguier M, Lemtre F, Verola O, Cho MS, Gorochov G, Dubertret L,
Bachelez H, Kourilsky P, Ferradini L: Foxp3 expressing CD4+CD25high
regulatory T cells are overrepresented in human metastatic melanoma
lymph nodes and inhibit the function of infiltrating T cells. J Immunol
2004, 173:1444-1453.
Cesana GC, DeRaffele G, Cohen S, Moroziewicz D, Mitcham J,
Stoutenburg J, Cheung K, Hesdorffer C, Kim-Schulze S, Kaufman HL:
Characterization of CD4+CD25+ regulatory T cells in patients treated
with high-dose interleukin-2 for metastatic melanoma or renal cell
carcinoma. J Clin Oncol 2006, 24:1169-1177.
Tatsugami K, Eto M, Naito S: Influence of immunotherapy with interferona on regulatory T cells in renal cell carcinoma patients. J Interferon
Cytokine Res 2010, 30:43-48.
Simeone E, Napolitano M, Mauro F, Palmieri G, Ridolfi R, Riccobon A,
Petrini M, De Rosa V, Satriano RA, Di Martino S, Nicoletti G, Gentilcore G,
Ascierto et al. Journal of Translational Medicine 2010, 8:76
/>
Page 13 of 13
Capone M, Calemma R, Loddo C, Talamanca AR, Caracò C, Castello G,
Ascierto PA: Blood reduction of circulating regulatory T cell (Treg) by
intra venous high dose Interferon treatment in melanoma matients:
preliminary results. Proceeding of the Fourth Research Meeting on
Melanoma, May 10-11; Milan, Italy Milano: IEO-European Institute of
Oncology 2007.
31. Simeone E, Daponte A, De Feo G, Montesarchio V, Chiarion-Sileni V, De
Michele I, Caracò C, Palmieri G, Mozzillo N, Ascierto PA: Metronomic
schedule of temozolomide with conventional dose of cisplatin in
metastatic melanoma. J Clin Oncol (Meeting Abstracts) 2009, 27:e20009.
doi:10.1186/1479-5876-8-76
Cite this article as: Ascierto et al.: Regulatory T cell frequency in
patients with melanoma with different disease stage and course, and
modulating effects of high-dose interferon-a 2b treatment. Journal of
Translational Medicine 2010 8:76.
Submit your next manuscript to BioMed Central
and take full advantage of:
• Convenient online submission
• Thorough peer review
• No space constraints or color figure charges
• Immediate publication on acceptance
• Inclusion in PubMed, CAS, Scopus and Google Scholar
• Research which is freely available for redistribution
Submit your manuscript at
www.biomedcentral.com/submit