Báo cáo hóa học: " cDNA targets improve whole blood gene expression profiling and enhance detection of pharmocodynamic biomarkers: a quantitative platform analysis" ppt
Bạn đang xem bản rút gọn của tài liệu. Xem và tải ngay bản đầy đủ của tài liệu tại đây (1.09 MB, 12 trang )
RESEARC H Open Access
cDNA targets improve whole blood gene
expression profiling and enhance detection
of pharmocodynamic biomarkers:
a quantitative platform analysis
Mark L Parrish
1*
, Chris Wright
2
, Yarek Rivers
1
, David Argilla
3
, Heather Collins
1
, Brendan Leeson
4
, Andrey Loboda
5
,
Michael Nebozhyn
5
, Matthew J Marton
2
, Serguei Lejnine
5*
Abstract
Background: Genome-wide gene expression profiling of whole blood is an attractive method for discovery of
biomarkers due to its non-invasiveness, simple clinical site processing and rich biological content. Except for a few
successes, this technology has not yet matured enough to reach its full potential of identifying biomarkers useful for
clinical prognostic and diagnostic applications or in monitoring patient response to therapeutic intervention.
A variety of techn ical problems have ham pered efforts to utilize this technology for identification of biomarkers. One
significant hurdle has been the high and variable concentrations of globin transcripts in whole blood total RNA
potentially resulting in non-specific probe binding and high background. In this study, we investigated and
quantified the power of three whole blood profiling approaches to detect meaningful biol ogical expression patterns.
Methods: To compare and quantify the impact of different mitigation technologies, we used a globin transcript
spike-in strategy to synthetically generate a globin-induced signature and then mitiga te it with the three different
technologies. Biological differences, in globin transcript spiked samples, were modeled by supplementing with
either 1% of liver or 1% brain total RNA. In order to demonstrate the biological utility of a robust globin artifact
mitigation strategy in biomarker discovery, we treated whole blood ex vivo with suberoylanilide hydroxamic acid
(SAHA) and compared the overlap between the obtained signatures and signatures of a known biomarker derived
from SAHA-treated cell lines and PBMCs of SAHA-treated patients.
Results: We found cDNA hybridization targets detect at least 20 times more specific differentially expressed
signatures (2597) between 1% liver and 1% brain in globin-supplemented samples than the PNA (117) or no
treatment (97) me thod at FDR = 10% and p-value < 3x10⁻³. In addition, we found that the ex vivo derived gen e
expression profile was highly concordant with that of the previously identified SAHA pharmacodynamic biomarkers.
Conclusions: We conclude that an amplification method for gene expression profiling employing cDNA targets
effectively mitigates the negative impact on data of abundant globin transcripts and greatly improves the ability to
identify relevant gene expression based pharmacodynamic biomarkers from whole blood.
* Correspondence: ;
1
Covance Genomics Laboratory, LLC, 401 Terry Ave, Seattle, WA 98109, USA
5
Department of Molecular Profiling Research Informatics, Merck & Co., Inc.,
33 Avenue Louis Pasteur, Boston, MA 02115, USA
Full list of author information is available at the end of the article
Parrish et al. Journal of Translational Medicine 2010, 8:87
/>© 2010 Parris h et al; licensee BioMed Central Ltd. This is an Open Access article distributed under the terms of the Creative Commons
Attribution License (http: //creativecommons .org/lice nses/by/2.0), which permits unrestrict ed use, distribution, and reproductio n in
any medium , provided the original work is properly cited.
Background
Whole blood is a complex mixture of cell types that are
exquisitely acute sensors of the body’ s physi ological
state[1-8].Ithaslongbeenthesourcetissueusedin
numerous tests for the identification of disease and the
monitoring of disease progression. Peripheral blood is
easily accessed and the available analytical techniques
are well-established with a focus on the quantification of
various chemical analytes (proteins, lipids, etc). Yet, gene
expression profiling of peripheral whole blood has yet to
be employed broadly. With the proliferation of whole
genome analysis techniques, and their potential utility as
bot h prognostic and diagnost ic tools, there is a growing
need to utilize readily available peripheral blood for
tech niques such as SNP analysis, copy number variation
analysis and genome-wide gene expression.
Even though peripheral whole blood is one of the
most easily accessed tissues for whole genome gene
expression profiling, there are a number of technical
challenges. The first is mRNA stabilization and isolation.
The introduction of point-of-collection products that
stabilize nucleic acids for whole blood (i.e. PAXgene,
Tempus) has proven to be a major advance in the
reduction of process-related artifacts [9,10]. These
systems generally allow the collection of whole blood
directly into a stabilizing reagent that prevents further
RNA transcription and degradation. Although these
stabilization technologies are readily available, many stu-
dies employ methods subject to sample storage or p ro-
cessing artifacts [11]. For example, it has been shown
that delays in processing blood samples can lead to
changes in expression of thousands of genes [9,12,13].
Ano ther challenge is that the specificity an d sensitivity
of a given RNA profiling platform are affected by the
abundance and variability of the globin transcripts, which
can comprise up to 70% of mRNA in a whole blood
extract [14]. In a basic research setting (as opposed to a
clinical setting), scientists have circumvented the reticu-
locyte problem by isolating peripheral blood mononuc-
lear cells (PBMCs) However, isolating PBMCs is difficult
for many clinica l sites to achieve and inadv ertent delays
in processing time can lead to processing biases that can
reduce discovery power of expression profiles [12].
To improve the laboratory assays and increase discovery
power, several commercially available solutions have
been developed to reduce or mitigate the effects of excess
globin transcripts on microarray hybridization signal.
These can be classified into two strategies. The first
approach focuses on mi nimizing the amplification of glo-
bin specific messages in amplified cRNA. These methods
include physically removing glob in transcripts from total
RNA by hybridization to anti-globin oligonucleotides
affixed to magnetic beads (GLOBINclear™ ,[15])orby
blocking the amplification of globin transcripts using oli-
gonucleotides of nucleic acid analo gs (PNA, LNA), which
when bound to a transcript prevents its amplification by
reverse transcriptase [16]. The PNA approach has been
recommended by Affymetrix [17]. Because of sample
manipulation, GLOBINclear has the potential to
adversely affect the integrity of total RNA [18], is difficult
to scale up and requires species-specific reagents
(Wright, unpublished observations). Since we had evalu-
ated this method previously, it was not included in this
study. The PNA-based tec hnique is simple and scalable,
but PNA design is diffic ult and costly to expand for other
species. Both techniques generate a hybridization target
composed of cRNA and rely on the post-RNA isolation
manipulation of the samples prior to or at the first step
of mRNA amplification, leading to potential processing
bias in gene expression data.
A second approach does not specifically restrict ampli-
fication of globin transcripts; rather it relies on the high
specificity of DNA-based hybridization [19,20]. In these
methods, all transcripts, including globin, are amplified
to produce complementary cDNA. It is believed the
high specificity of DNA-DNA interactions reduces cross
hybridization signal due to excess globin, thereby redu-
cing artifactual signals. The specific technol ogy used in
this manuscript is NuGEN’s Ribo-SPIA, a highly sensi-
tive method for generating cDNA target from nanogram
quantities of total RNA. The methodology amplifies
target mRNA using a novel template generation and
isothermal strand displacement strategy [19,21]. It has
recently been improved with the addition of the Whole
Blood reagent (WB) that optimizes the amplification for
whole blood samples.
Many of the current evaluations of globin mitigation
strategies are based on biological mo dels in which
ground truth is largely unknown. Therefore, conclusions
are based on semi-quantitative analysis of present calls
[22] or on a lack of technical replicates [18]. In another
study, differential expression was not detected in whole
blood processing protocols, including two mitigation
protocols [23]. Even though the above studies qualita-
tively show that mitigation approaches have the poten-
tial to improve sensitivity and specificity, there are
remaining questions of globin impact on power to dis-
cover relevant biological s ignals from gene expression
profiling of whole blood.
In order to identify an optim al strategy for the identi-
fication of pharmacodynamic biomarkers in whole
blood, we established two model systems to identify and
apply the best technique. First, we used a progressive
globin transcript spike-in strategy to compare three
methods to process samples, including two leading glo-
bin mitigation methods. Biological differences are
Parrish et al. Journal of Translational Medicine 2010, 8:87
/>Page 2 of 12
modeled by spiking 1% liver or 1% brain total RNA. Jur-
kat RNA was used as a backgrou nd for globin transcript
spike-in to estimate potential bias in background. Identi-
cal sets of spiked-in samples were profiled at two differ-
ent labs to check the reproducibility of the results.
Then, we applied the more sen sitive technique to a
model s ystem in which whole blood was treated ex vivo
with a pharmacological agent to mimic a compound
pharmacodynamic biomarker. To determine whether the
drug-induced expression patterns observed were biologi-
cally meaningful, these data were then compared to a
published pharmacodynamic biomarker derived from
compound-treated cell lines and from peripheral blood
mononuclear cells (PBMCs) isolated from patients trea-
ted with the compound in a Phase Ib clinical trial [24].
Methods
Identification of an Optimized Globin Mitigation Strategy
Unless noted, the generation of samples has been
described previously [14]. The sample set used in this
study is summarized in additional file 1. Variability in
the levels of globin transcripts in a sample was modeled
by spiking the baseline sample with 0%, 2%, 4% or 8%
(by mass in total RNA) of synthetic globin message
(a 3:1 mixture of alpha and beta globin, see the above
reference for a complete description). This range of glo-
bin suppl ementation was chosen to mimic a wide range
of potential globin levels. As noted by Wright et al.,
both the range and variability of globin levels that con-
tribute to a globin-interference artefact [14]. To simulate
differential expression, s amples were spiked with 1% of
Brain or 1% Liver (w/w) total RNA into Jurkat total
RNA . This spiking strategy (with globin, brai n and liver
RNAs) was also applied to a pool of PAXgene-collected
whole human blood from volunteer donors, and similar
data were obtained (data not shown).
RNA samples
Jur kat, brain and liver total RNAs were purchased from
Ambion (Foster City, CA). Globin transcripts (a mixture
of alpha and beta) were synthesized as previously
described [14]. Samples were quantitated by UV spec-
trophotometry and quality was assessed using an Agilent
Bioanalyzer and the Agilent RNA 6000 Nano kit (data
not shown).
Gene expression profiling
Aliquots of each sample were profiled for gene expression
with or without globin mitigation using an automated
version of the Affymetrix reverse trans cription-in vitro
transcription protocol (RT-IVT) as described by the man-
ufactur er (Affymetrix Inc., Santa Clara, CA). PNAs were
designed as described by Affymetrix [17] and purchased
from PanaGene (Daejeon, South Korea). Samples were
treated with the PNA cocktail as described an d profiled
using the same RT-IVT protocol as the control. A third
aliquot of each total RNA was amplified using the
NuGEN Ovation Whole Blood Solution protocol
(NuGEN, Inc., San Carlos, CA) as described by the man-
ufacturer [25]. Amplified biotin-labeled material was
hybridized to custom-designed Affymetrix microarrays
(GEO accession GPL6793), one sample per array. Hybri-
dization, washing and scanning were completed as
recommended by the manufacturer.
Ex vivo human whole blood studies
300 mL of whole blood from 10 anonymous and con-
senting adults (5 male and 5 female) was collected into
a blood collection bag with citrate dextrose phosphate
adenine (CDPA) (Terumo Medical Corp, Somerset, NJ).
The blood samples used as the basis for t he procedures
described in this manuscript were drawn from healthy
volunteers for development of novel laboratory techni-
ques, thus the provisions of the Declaration of Helsinki
are not applicable. Each volunteer donor read and
signed an informed consent document that described
the potential risks involved with giving a blood sample
through venipuncture. The blood samples were drawn
by a certified phlebotomist. 25 mL of each donor’ s
blood was then aliquoted into 3 different canted neck
75 cm
2
culture flasks (Corning, Corning NY). One ali-
quot of whole blood received DMSO as a vehicle con-
trol; the other two aliquots were treated with
Suberoylanilide Hydroxamic Acid (SAHA) to a final
concentratio n of either 0.33 μMor3.3μM. The culture
flasks were incubated at 37°C with 5% CO
2
.At0,3,6
and 12 hours multiple 2.5 mL samples were drawn from
each of the flasks and immediately mixed with PAXgene
RNA stabilization reagent. Time points and doses were
chosen in order to maximize the likelihood of detecting
a SAHA induced change in mRNA profiles. Samples
were stored at -80°C. Total RNA was extracted from the
0, 3, and 6 hour samples using a custom semi-auto-
mated version of the vendor’ s PAXgene 96 Blood RNA
system. RNA Quality was assessed as described above,
and prepared for microarray arr ay hybridization using a
semi-automated version of the NuGEN Ovation WB
protocol with biotin labelling [25]. Samples were hybri-
dized to Rosetta custom Affymetrix GeneChip arrays
(see above) following the vendor’ s recommended
protocols.
Data processing and analysis
Microarray data quality was assessed using standard
metrics [26]. RMA was used for data normalization and
processing [27]. Analysis was done using log
2
scale
intensity values. Genes significantly (p-value < 0.01, a bs
(rho) > 0.6) correlated to the amount of spiked-in globin
Parrish et al. Journal of Translational Medicine 2010, 8:87
/>Page 3 of 12
were defined as globin artifact. Correlation does not
measure the amplitude of the globin artifact or the
amount of noise it introduces. We have chosen the
standard deviatio n of expression values rather than cov-
ariance to quantify the amplitude of the genes correlated
to spiked globin due to a simpler implementation and
associations with effect size measured by Cohen’ s
distance. Data was analyzed using Matlab, Spotfire Deci-
sionSite, SAS and R. A t-test was performed to detect
sig nificant differences between liver and brain spiked-in
samples. The p-value threshold for this test used to
declare a significant differential expression value
between liver and brain spiked samples was set such
that the false discovery rate (FDR) was constrained to be
< 0.1, as determined by permutation [28,29].
ROC analysis was done as follows: the true positive
rate was estimated using p-value of t-test between liver
and brain spike- in samples; false positive rate was esti-
mated using t -test after permutation of sample indexes.
Permutation is constrained so that each group has equal
number of liver and brain spiked samples. This will
ensure that false positive rate is not inflated by biologi-
cal differences.
Results and Discussion
Globin mitigation improves microarray data quality
In order to quantify the impa ct of excess globin on
hybridization quality, we developed a controlled system
using Jurkat RNA spiked with varying levels of globin
transcript as well as low levels (1%) of brain and liver
RNA supplements. This synthetic system provides an
objective means of identifying signals related to globin
abundance versus those of other sources of biological
variability. Brain and liver spike-ins yield a well-defined
differential gene expression pattern, which can be used
for quantifying the impact of globin on signature gene
detection. Previous work in our laboratory and by others
has demonstrated that excessive levels of globin tran-
scripts can induce a data artifact through promisc uous
cross-hybridization to microarray probes [14,22].
Consistent with this, both Scale Factor (a measure inver-
sely proportional to array intensity) and Percent Present
(a measure of d iscrimination between probes and back-
ground) are negatively impacted by increasing amounts
of globin. PNA treatment was found to improve the
Percent Present metric by approximately 10 percent,
while the cDNA amplification improved this metric by
25 percent and reduced the background correlated to
the amount of globin spiked into each sample (addi-
tional file 2). Although hybridization quality is an
important metric, it is not always directly related to bio-
logical signal.
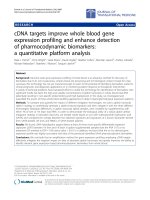
Figure 1 depicts a heat map with the experiments
grouped first by mitigation technology, then by the
amount of globin s pike-in. Expression ratios between
brain and liver containing samples were derived within a
given globin concentration and mitigation strategy to
account for differences in protocol-associated intensity.
Genes correlated to the amount of spiked-in globin
transcript and demonstrated tissue specific express ion
(p-value < 0.003 and FDR = 10%) were clustered using
hierarchical clustering. Note that in this controlled
system, the vast majority of gen es in the signature s
derived from both t he PNA and no treatment control
are correlated to globin content rather than of genes dif-
ferentially regulated between brain and liver (data not
shown). Greater than 23,000 transcripts correlated sig-
nificantly (p-value < 0.01, abs(rho) > 0.83) to the
amount of globin transcript spiked into each sample
across all arrays (figure 1, red bars). Only the cDNA
protocol mitigates the globin artifact in a robust enough
manner to reveal the smaller underlying Brain/Liver
signature (figure 1, yellow bars).
These results support the hypothesis that globin-
related cross -hybridization is the main source of the arti-
fact. Reducing globin cross-hybridization by either SPIA
amplification of sa mples or PNA blockage of reverse
transcription improves average probe intensity and
discrimination from background. Therefore, correlation
between the amount of globin and gene expression signal
is a robust metric for measuring globin interference.
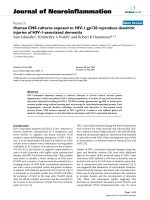
Analysis of the distribut ion of microarray intensities
for each met hod also reveals significa nt differences
between the technologies. Figure 2 plots the density
distribution of probeset intensities for both mitigation
technologies and processing without globin mitigation.
These plots show a shift in density distribution for the
cDNA target samples, and very little difference between
the PNA method and no treatment control. Increasing
globin transcript abundance results in a progressive
downshift of signal density between log2(Intensity) of 4
and 8 for the PNA and no treatment controls. Given
that most of the probesets fall within this intensity
range, the impact of globin abundance will have a global
effect on array performanc e. The change in shape of the
density distribution will result in normalization artifacts
as well, since the majority of normalization techniques
assume intensity distributions are similar between
related samples. The cDNA target distribution shows
no shifts due to globin abundance. In addition, cDNA
targets exhibit more uniform d etection and discrimina-
tion of low-expression genes by increasing expression
signal across a wider range of low-intensity probes.
Another important characteristic of cDNA targets is the
reduction of background intensity, which is represented
by the s hift in the peak maxima. Peak maxima typically
reflect the background intensity on the array. The inten-
sity distribution of cDNA targets i s not sensitive to
Parrish et al. Journal of Translational Medicine 2010, 8:87
/>Page 4 of 12
globin content and showed greater discrimination
between low-expression genes and background, which is
indicated by two maxima.
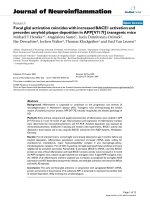
cDNA amplification significantly reduces the number of
genes correlated to globin
Genes whose expression increases in proportion to the
amount of globin added to the sample can readily be
identified as globin-induced artifactual discoveries. In
order to quantify the effect of globin interference on
gene expression data, we calculated the Pear son correla-
tion coefficient between expression levels and globin
abundance for each gene. Figure 3 shows the frequency
distribution of correlation coeff icients for each treat-
ment. The large number of positively or negatively cor-
related probesets could be explained as a result of RMA
compensating for normalization of the highly correlated
genes and imbalance in mRNA content. PNA treatment
reduces the number of genes significantly correlated
(p < 0.01) to globin from 23,290 in no treatment control
Figure 1 Gene clustering of all signatures associated with globin cross-hybridization and tissue specific effects. The x-axis corresponds
to clustered genes. Rows correspond to samples. Jurkat RNA samples spiked with brain were referenced to a sample with spiked liver and no
globin within each treatment. Samples are sorted by the amount of spike globin. Amount of globin is indicated by triangles and ranged from
0% to 8%. Yellow and magenta bars indicate tissue specific effect and globin artifact, respectively. Data are on a log2 scale.
Figure 2 Globin affects global changes in density distribut ion of intensity. RMA-derived intensity values were binned and plotted against
their frequency for Jurkat samples spiked with 4 different concentrations of globin (0, 2, 4, 8%).
Parrish et al. Journal of Translational Medicine 2010, 8:87
/>Page 5 of 12
to 15,912 genes (table 1). The distribution of correlation
coefficients for cDNA targets is almost normal, which is
the expected result of strong mitigation, with just 1,799
genes significantly correlated to globin transcript abun-
dance and no strong normalization artifact apparent
(table 1 and figure 3).
cDNA amplification significantly improves gene
expression discovery power
To determine the impact of globin transcript mitigation
on discovery power, we calculated statistical power by
using the SAS power procedure. Both the PNA and
cDNA strategies improved data by reducing the amount
of detectable globin interference. PNA treatment
decreased interference by ~30%, as measured by the
number of genes correlated to globin with PNA treat-
ment compared to the no-treatment control (figure 3 and
table 1), while cDNA hybridization reduced globin-
induced noise by more than 90%. First, genes differen-
tially expressed (tissue-specific genes) between 1% liver
and 1% brain spiked samples were detected using a t-test.
The critical p-value was set to control false discovery rate
(FDR) at 10% for each processing method. FDR was
determined using a permutation approach (see Methods).
The no-treatment, PNA, and cDNA critical p-values
were set equal to 4e-4, 4e-4 and 3e-3 respectively.
We observed higher FDR for samples processed using
PNA or no treat ment at the same p-values compared to
the cDNA samples. In order to keep FDR = 10%, we had
to reduce the critical p-value cut off for the analysis of
PNA and no treatment samples. The number of signifi-
cant genes differentially regulated between 1% liver and
1% brain is equal to 97 for no treatment, 117 for PNA
and 2,597 for cDNA. The statistical power of the detected
changes is more than 90% at p-value of 1e-4.
As a further validation o f the approach, significant
changes in gene expression of globin-spiked samples
were plotted against related changes in 100% brain vs.
100% liver. The correlation of signature genes shown in
figure 4 confirms that detected changes are representa-
tive of biological differences between liver and brain.
Another way to evaluate effects of mitigation is to
estimate the statistical power necessary to detect differ-
ential regulation under given experimental conditions.
Variation in expression data was estimate d using mea n
standard deviation of intensity on a logarithmic scale for
genes significantly correlated to globin. This estimate
was used bec ause nearly 50% of probesets significantly
correlate to globin addition. The standard deviations
were 0.36 for no treatment, 0.3 for PNA and 0.12 f or
cDNA (table 1). cDNA hybridization allowed for the
detection of 1.4-fold change in expression at p ≤ 0.01
Figure 3 Distribution of Pearson Correlation coefficients between s piked in globin and gene expression of Jurkat samples.The
calculated amount of globin in each Jurkat sample was correlated to the expression of all genes for each treatment (p-value < 0.01; abs(Rho) =
0.83). The Pearson Correlation coefficient values were binned and plotted against frequency. For the No Treatment, PNA and cDNA treatments,
the number of genes significantly correlated to globin was 23290, 15912 and 1799, respectively. The significance threshold for correlation is set
at p < 0.01, which corresponds to a magnitude of correlation coefficient of more than 0.83.
Table 1 Quantitative assessment of globin interference and tissue-specific signatures
Probesets Correlated to globin
(p-value < 0.01)
Tissue specific probesets FDR = 10% **
(critical p-value)
Standard Deviation of intensity for
globin-correlated genes
Power
++
No Treatment 23290 97 (2e-4) 0.36 11%
PNA 15912 117 (2e-4) 0.30 18%
cDNA 1799 2597 (3e-3) 0.12 90%
Globin Related genes are those that have a significant correlation in expression magnitude to the amount of globin in each sample. Tissue Specific genes are
those that are associated to a 1% brain vs. 1% liver expression pattern. St andard Deviation refe rs to the variability in globin interference genes correlated to the
variation in globin content.
** Critical p-value is in parenthesis
++ Power to detect 1.4 fold change at p-value = 0.01, 4 samples per group
Parrish et al. Journal of Translational Medicine 2010, 8:87
/>Page 6 of 12
with 90% power, assuming 4 samples per group. PNA
and no treatment power are 18% and 11%, respectively,
under the same conditions (table 1). In order to com-
pensate for loss in statistical power in PNA and no
treatment samples, the number of samples per group
needs to be increased from 4 to 9. Thus, this shows that
while the loss in sensitivity is not fatal to biomarker
discovery, more sample replicates are required to
achieve the same statistical power. While both globin
mitigation strategies increase the number of genes iden-
tified as differentiall y-expressed between brain and liver,
the cDNA methodology substantially increases the num-
ber of genes detected relative to both the control and
PNA methods.
We performed a Principal Compone nt Analysis (PCA,
figure 5) of the data derived from differential brain
versus liver signatures in order to identify and quantify
the sources of variation i n the data. Plotting t he values
for the first two principal components shows a clear dif-
ference between the cDNA methodology and the other
two protocols. For both the PNA and no treatment con-
ditions, the first principal component is driven by the
amount of globe spiked in, contribu ting to 70% of the
total variation in those samples. The second principal
component (10% of the variation) was the brain/liver
signature. However, the first principal component of the
cDNA target data is driven by the brain/liver signature,
detected following globin mitigation. The second princi-
pal component was the amount of globin in the sam-
ples. This analysis provides a quantitative demonstration
that there is very little difference between PNA and no
treatment and that these conditions were essentially
unable to signi ficantly resolve a signature between sam -
ples spiked with brain or liver RNA.
A Receiver Operator Characteristic curve plot is used
to evaluate discrimination power between different plat-
forms [30]. It is also a means of visualizing the rel ation-
ship between sensitivity and specificity where the
abscissa indicates the number of false positive genes
detected by t-test between two groups with no biological
differences and the ordinate is the total number of genes
detected in the Jurkat samples spiked with either liver or
brain total RNA. The Ribo-SPIA method detects a far
greater number of significant genes at any level of “false
positive” detection selected (figure 6).
Demonstration that cDNA Target Reveals a
Physiologically Relevant Expression Profile in Whole
Blood
To demonstrate that cDNA targets were able to reveal a
meaningful biological gene expression signature in
whole blood, we developed an ex vivo platform for
Figure 4 Correlation of 1% brain/liver signatures to 100% brain/ liver signatures. Ratios for differential gene expression in brain/liver
samples were calculated and plotted against each other for 1% brain/liver and 8% globin in Jurkat RNA versus 100% brain/liver RNA.
Figure 5 Princ ipal Co mponent Analysis of ti ssue-speci fic and globin-related gene expression.PCAwasperformedontheexpression
values of Jurkat samples supplemented with 1% brain or liver RNA. The circles indicate the amount of globin while the color indicates whether
the sample was spiked with brain or liver.
Parrish et al. Journal of Translational Medicine 2010, 8:87
/>Page 7 of 12
putative biomarker identification (see Methods for
details). Who le blood collected from consenting, healthy
volunteers was dosed with two different concentrations
of Suberoylanilide Hydroxamic Acid (SAHA), a histone
deacetylase inhibitor used in cancer treatment or vehicle
(dimethylsulfoxide). Samplealiquotswereremovedat
two different time points and mixed with PAXgene
reagent to stabilize the transcriptional profile prior to
RNA extraction and analysis on Affymetrix microarrays.
We designed this experiment to identify gene signa-
tures that were regulated in both a time-and SAHA
dose-dependent manner. By definition, these genes
would be potential markers of SAHA pharmacodynamic
effects in whole blood. We expected that these gene sets
would have significant overlap with published SAHA
response data sets from lymphoctyes of SAHA-treated
patients or treated lymphocyte cell lines [31]. Addition-
ally, it is reasonable to assume that this experimental
design would also identify genes related to perturbations
of whole blood not easily identified in other model
systems. Table 2 shows an analysis of the intensity data
for genes that were significantly regulated by time and
dose. Even at r estr ictive p-values (< 0.001) almost 5,000
genes can be identified. T he identification of a time-
dose regulated set of genes provides confidence that the
experimental design successfully modelled a drug
induced signature.
To confirm that the significantly regulated genes reflect
changes in pathways known to be impacted by histone
deacylases suc h as SAHA, we compared the Ribo-SPIA-
identified genes to the canonical SAHA response signature
[24]. This signature was derived from a number of data
sets and was shown to be consistently regulated in differ-
ent tissues, cell lines and in a previous Phase Ib in vivo
Figure 6 Receiver Operator Characterist ic curves of 1% brain vs 1% liver signature detection. The total number of genes detec ted by a
t-test at a specific p-value are plotted against the number of false positive genes detected at the same p-value. False positives were calculated
using permutations controlled for equal number of liver and brain samples in each group. ROC analysis was done as follows: the true positive
rate was estimated using a t-test between liver and brain spike-in samples; false positive rate was estimated using t-test after permutation of
sample indexes. Permutation is constrained so that each group has equal number of liver and brain spiked samples. This will ensure that false
positive rate is not inflated by biological differences.
Table 2 ANOVA analysis of time and SAHA dose
dependent genes
Regulation Number of transcripts
(p < 0.01)
Number of transcripts
(p < 0.001)
Down 3936 2764
Up 3814 2240
Parrish et al. Journal of Translational Medicine 2010, 8:87
/>Page 8 of 12
bloo d study [24,31]. Conco rdance between the canonical
signature and the ex vivo signature was assessed by analyz-
ing the performance of the ex vivo signature on the probe
sets best matched to the canonical signature. Down-and
up-regulated cano nical SAHA signature genes ar e repre-
sented on the custom Affymetrix microarray by 324 probe
sets and 333 probe sets, respectively. Concordance of
detected regulation is presented in figure 7. Approximately
85% of genes show similar regulation between the canoni-
cal and ex vivo gene lists without statistical cuts (data not
shown). 336 (50%) genes of the canonical SAHA gene list
were significantly changed in the ex vivo experiment with
more than 90% concordance in the direction of regulation
(p << 0.01 Fisher exact test). These included a number of
genes previously identified as SAHA response genes in the
PBMCs of treated patients, which included the down regu-
lation of MYC and up regulation of GADD45B [24].
Conclusions
Blood is a critical tissue for the understanding of disease
and the development of disease treatments. It is a ubi-
quitous tissue that interacts throughout the body and
literally acts as a sensor of physiological conditions [1,2].
While many assays exist to extract this critical knowl-
edge from blood for proteins, lipids and single genes,
development of genome-base d biomarker assays has
been a challenge. This is due to the high and variable
levels of globin transcripts that interfere with achieving
significant sensitivity [14]. To this end, several commer-
cial solutions have been developed to prevent the gen-
eration of globin transcripts during sample preparation.
We and others have shown that many of these methods
do improve data quality (figure 1; [14,18,22]). However,
using Ribo-SPIA amplification, we have demonstrated
that the globin transcript can be fully represented in the
target and its effect on hybridization data can be amelio-
rated through the highly-specific properties of DNA:
DNA binding.
Most microarray platforms typically utilize a fixed
probe length of DNA, whether spotted in place or
synthesized in situ. This critical fact defines much of the
performance of the microarray in terms of sensitivity
(DNA will allow a certain amount of promiscuous cross
hybridization effecting background determination) and
Figure 7 Concordance between canonical SAHA signature and the signature identified by the ex vivo profiling method. 50% of the
canonical SAHA signature (336 genes) is represented on the custom Affymetrix GeneChip array, with a p < 0.01. More than 90% of the genes
are regulated in the same direction between the two datasets.
Parrish et al. Journal of Translational Medicine 2010, 8:87
/>Page 9 of 12
specificity (the fidelity of hyb ridization between the
probe and the target). Standard amplification techniques
rely on the RT/IVT method developed by Eberwine and
Van Gelder [32]. This method amplifies mRNA and
incorporates the necessary label using an in vitro tran-
scription step that is robust and efficient. The amplified
material produced is a cRNA whose characteristics for
sensitivity and specificity are acceptable, but not as good
as a DNA target . DNA has been shown to perfor m bet-
ter as a hybridization target than RNA, since it is highly
specific and less susceptible to cross-hybridization [20].
These characteristics also support the use of DNA as a
means of mitigating the effects of globin, and potentially
other highly abundant interfering transcripts.
Evaluation of the hybridization characteristics show
that cDNA probes generated by Ribo-SPIA amplification
perform better than using the standard cRNA m ethod
of amplification and labeling. cDNA hybridization s have
greater intensity (low Scale Factor) and better discrimi-
nation between true signal and background (measured
as a higher percentage of present calls) (additional file
2). Not only are there improvements in hybridization
metrics, but the deleterious effects of globin cross-hybri-
dization are reduced. As seen in figures 1 and 5, and
quantified in table 1, the correlation between the
amount of glo bin in a sample and the number of false
posit ive signatures is greatly reduced when either globin
mitigation strategy is used. However, we found that the
Ribo-SPIA method significantly outperformed the PNA
method. Indeed, there is an improved detection sensitiv-
ity of nearly 4-fold, a reduction of the globin artifact by
5-fold and an increase in statistical power (signal to
noise) of more than 3-fold. The loss of correlation
between the amount of globin in the sample and the
number of false d etections indicates the benefits of this
approach. This improved performance was consistent
whether the background sample was of either a cell line
or whole blood origin.
Concomitant with a reduced correlation between glo-
bin and false positive signatures is an increase in the
number of true signatures detected. Irrespective of glo-
bin interference, it is useful to measure the sensitivity of
all methods. When comparing the spiked-in liver vs
brain signatures, the Ribo-SPIA protocol identified 4,000
more significant genes than the sta ndard no treatment
control. PNA had little to no effect in sensitivity with an
increase of less than 200 genes (table 1). This benefit is
magnified in the presence of cross-contaminating globin.
Figures 2 and 5 show the benefits of globin mitigation.
Both the Rib o-SPIA and PNA methods increase the
number of true detections (as measured by the number
of brain or liver signatures detected) when compared to
no treatment. As before, the Ribo-SPIA protocol is far
superior to the standard PNA protocol. Figure 6 shows
a ROC-like analysis where genes associated with globin
amount are considered false positives and the total
number of signatures detected is derived by building a
ratio between the Jurkat spiked with brain and Jurkat
spiked with liver. This presentation shows that for a
given level of fal se posit ives attributable to globin cross-
hybridization, both the Ribo-SPIA and PNA protocols
are more sensit ive than a no treatment control, with the
Ribo-SPIA significantly outperforming PNA.
During the preparation of this manuscript, a number of
other teams have published studies evaluating methodolo-
gies for whole genome expression profiling from whole
blood. Many of these used similar methodologies for
objectively measuring expression profiling performance
[14,22]. Others have noted the benefits of usincDNA
targ ets for profiling, although in some cases it was noted
that earlier versions of the Ribo-SPIA protocol were used
[18]. It should be noted that we used the NuGEN Ovation
WB kit, which is an improved method over early versions.
Other recent work has compared profiling using
cDNA to other methods, including direct isolation of
PBMCs [23]. In any research, the cause of negative
results is often unknown and dismissed based on several
reasons. For example, it was reported that robust tran-
scriptional signature of acute graft rejection in tissue
biopsies could not be detected in whole blood even after
using cDNA-based amplification a nd hybridization [23].
The cause is unknown and could be due to the biologi-
cal r elevance of whole blood in detection of graft rejec-
tion or inability to fully mitigate globin effects.
There are several examples in the literature of ex vivo
gene expressio n profiling as well as experiments looking
at the SAHA-induced expression profiling [31,33-37].
The latter generally rely on the isolation of PBMCs in
order to m itigate globin contamination. This extra pro-
cessing can induce signatures of its own and thus
reduce sensitivity [10,12,38,39]. A significant benefit of
the NuGEN Ovation WB protocol is that such extra
manipulation is not necessary and pre-amplification
noise is not introduced. The goal of the study was to
demonstrate the utility of cD NA targets for whole blood
gene profiling. Using a cDNA target derived from the
Ribo-SPIA protocol, the number of genes correlated
to globin input was reduced by 5-fold compared to a
no treatment control, with a 4-fold increase in tissue-
specific genes. Although the study was not specifically
designed or powered to i dentify new clinically-relevant
biomarkers, it was designed to capture the time-and
dose-dependent biological response of whole blood to
SAHA administration. These data support the concept
that cDNA hybridization to microarrays is a valuable
methodology for identifying clinically-relevant gene
expression patterns in whole blood and reveal previously
obscured biomarkers.
Parrish et al. Journal of Translational Medicine 2010, 8:87
/>Page 10 of 12
Additional material
Additional file 1: Sample set used for globin spike-in experiments.
Jurkat RNA samples were supplemented with a physiologically-relevant
range of globin mRNA. See Wright et al, for a complete description [14].
Additional file 2: Hybridization quality assessment. Scatter plot of
scale factor values versus percent of present calls. Percent of present calls
is the percent of probesets with a significant difference in intensity
between perfect match (PM) and mismatch (MM) probes. Scale factor is
inversely proportional to the array intensity. Colors indicate protocol and
the size of squares corresponds to the amount of spiked globin (see
additional file 1). Each data point corresponds to an array.
Acknowledgements
The authors are indebted to the Rosetta Gene Expression Laboratory for
hybridization, washing and scanning support. The authors also thank Peter
Morrison and Anne Ho for technical support, as well as Marita Graube for
her help with the preparation of figures.
Author details
1
Covance Genomics Laboratory, LLC, 401 Terry Ave, Seattle, WA 98109, USA.
2
Clinical Development Lab, Merck & Co., Inc., 126 E. Lincoln Ave, Rahway, NJ
07065, USA.
3
Preclinical Immunology, Infectious Disease Research Institute,
1124 Columbia Street, Suite 400, Seattle, WA 98104, USA.
4
Seattle Biomed,
307 Westlake Avenue N, Suite 500, Seattle, WA 98109, USA.
5
Department of
Molecular Profiling Research Informatics, Merck & Co., Inc., 33 Avenue Louis
Pasteur, Boston, MA 02115, USA.
Authors’ contributions
MP conceived of the study design, participated in the ex vivo dosing study,
and led the drafting and editing the manuscript. CW contributed to the
study design, developed the spike-in samples, and participated in the ex vivo
dosing study. YR contributed to the study design, participated in the
expression profiling assays and participated in the ex vivo dosing study. DA
participated in the expression profiling assays and participated in the ex vivo
dosing study. HC completed all of the extraction of total RNA from blood
samples. BL provided project and sample management support. AL and MN
completed the analysis of the SAHA data. MM assisted with the data analysis
and participated in drafting and editing of the manuscript. SL completed
the analysis of the protocol selection study, participated in the analysis of
the SAHA data and participated in the drafting and editing of the
manuscript. All authors read and approved the final manuscript.
Competing interests
All authors were employed by Merck & Co. at the time the work was
completed. The authors have no other competing interests to declare.
Received: 18 May 2010 Accepted: 25 September 2010
Published: 25 September 2010
References
1. Whitney AR, Diehn M, Popper SJ, Alizadeh AA, Boldrick JC, Relman DA,
Brown PO: Individuality and variation in gene expression patterns in
human blood. Proc Natl Acad Sci USA 2003, 100:1896-1901.
2. Mohr S, Liew CC: The peripheral-blood transcriptome: new insights into
disease and risk assessment. Trends Mol Med 2007, 13:422-432.
3. Staratschek-Jox A, Classen S, Gaarz A, Debey-Pascher S, Schultze J: Blood-
based transcriptomics: leukemias and beyond. Expert Rev Mol Diagn 2009,
9:271-280.
4. Aziz H, Zaas A, Ginsburg GS: Peripheral blood gene expression profiling
for cardiovascular disease assessment. Genomic Med 2007, 1:105-112.
5. DePrimo SE, Wong LM, Khatry DB, Nicholas SL, Manning WC, Smolich BD,
O’Farrell AM, Cherrington JM: Expression profiling of blood samples from
an SU5416 Phase III metastatic colorectal cancer clinical trial: a novel
strategy for biomarker identification. BMC Cancer 2003, 3:3.
6. Batliwalla FM, Baechler EC, Xiao X, Li W, Balasubramanian S, Khalili H,
Damle A, Ortmann WA, Perrone A, Kantor AB, Gulko PS, Kern M, Furie R,
Behrens TW, Gregersen PK: Peripheral blood gene expression profiling in
rheumatoid arthritis. Genes Immun 2005, 6:388-397.
7. Batliwalla FM, Li W, Ritchlin CT, Xiao X, Brenner M, Laragione T, Shao T,
Durham R, Kemshetti S, Schwarz E, Coe R, Kern M, Baechler EC, Behrens TW,
Gregersen PK, Gulko PS: Microarray analyses of peripheral blood cells
identifies unique gene expression signature in psoriatic arthritis. Mol
Med 2005, 11:21-29.
8. Liew CC, Ma J, Tang HC, Zheng R, Dempsey AA: The peripheral blood
transcriptome dynamically reflects system wide biology: a potential
diagnostic tool. J Lab Clin Med 2006, 147:126-132.
9. Rainen L, Oelmueller U, Jurgensen S, Wyrich R, Ballas C, Schram J,
Herdman C, Bankaitis-Davis D, Nicholls N, Trollinger D, Tryon V: Stabilization
of mRNA expression in whole blood samples. Clin Chem 2002,
48:1883-1890.
10. Shou J, Dotson C, Qian HR, Tao W, Lin C, Lawrence F, N’Cho M,
Kulkarni NH, Bull CM, Gelbert LM, Onyia JE: Optimized blood cell profiling
method for genomic biomarker discovery using high-density microarray.
Biomarkers 2005, 10:310-320.
11. Kagedal B, Lindqvist M, Farneback M, Lenner L, Peterson C: Failure of the
PAXgene Blood RNA System to maintain mRNA stability in whole blood.
Clin Chem Lab Med 2005, 43:1190-1192.
12. Debey S, Schoenbeck U, Hellmich M, Gathof BS, Pillai R, Zander T,
Schultze JL: Comparison of different isolation techniques prior gene
expression profiling of blood derived cells: impact on physiological
responses, on overall expression and the role of different cell types.
Pharmacogenomics J 2004, 4:193-207.
13. Kim SJ, Dix DJ, Thompson KE, Murrell RN, Schmid JE, Gallagher JE,
Rockett JC: Effects of storage, RNA extraction, genechip type, and donor
sex on gene expression profiling of human whole blood. Clin Chem 2007,
53:1038-1045.
14. Wright C, Bergstrom D, Dai H, Marton M, Morris M, Tokiwa G, Wang Y,
Fare T: Characterization of globin RNA interference in gene expression
profiling of whole-blood samples. Clin Chem 2008, 54:396-405.
15. Field LA, Jordan RM, Hadix JA, Dunn MA, Shriver CD, Ellsworth RE,
Ellsworth DL: Functional identity of genes detectable in expression
profiling assays following globin mRNA reduction of peripheral blood
samples. Clin Biochem 2007, 40:499-502.
16. Affymetrix: An Analysis of Blood Processing Methods to Prepare Samples for
GeneChip® Expression Profiling 2003.
17. Affymetrix: GeneChip® Globin-Reduction Kit Handbook 2004.
18. Vartanian K, Slottke R, Johnstone T, Casale A, Planck SR, Choi D, Smith JR,
Rosenbaum JT, Harrington CA: Gene expression profiling of whole blood:
comparison of target preparation methods for accurate and
reproducible microarray analysis. BMC Genomics 2009, 10:2.
19. Kurn N, Chen P, Heath JD, Kopf-Sill A, Stephens KM, Wang S: Novel
isothermal, linear nucleic acid amplification systems for highly
multiplexed applications. Clin Chem 2005, 51:1973-1981.
20. Eklund AC, Turner LR, Chen P, Jensen RV, deFeo G, Kopf-Sill AR, Szallasi Z:
Replacing cRNA targets with cDNA reduces microarray cross-
hybridization. Nat Biotechnol 2006, 24:1071-1073.
21. Barker CS, Griffin C, Dolganov GM, Hanspers K, Yang JY, Erle DJ: Increased
DNA microarray hybridization specificity using sscDNA targets. BMC
Genomics 2005, 6:57.
22. Liu J, Walter E, Stenger D, Thach D: Effects of globin mRNA reduction
methods on gene expression profiles from whole blood. J Mol Diagn
2006, 8:551-558.
23. Li L, Ying L, Naesens M, Xiao W, Sigdel T, Hsieh S, Martin J, Chen R, Liu K,
Mindrinos M, Davis R, Sarwal M: Interference of globin genes with
biomarker discovery for allograft rejection in peripheral blood samples.
Physiol Genomics 2008, 32:190-197.
24. Loboda A, Fantin V, Randolph S, Flynn M, Friedman E, Ricker J, Hardwick J,
Richon V, Iwamoto M, Frankel S, Wagner J, Rubin E: Vorinostat
(suberoylanilide hydroxamic acid, SAHA) induces robust gene expression
changes in peripheral blood mononuclear cells from patients with solid
tumors, consistent with its effect in panels of human tumor cell lines.
AACR Meeting Abstracts 2007, 2007:2477.
25. NuGEN: User Guide For use with the Ovation™ Whole Blood Solution 2007.
26. Gentleman RC, Carey VJ, Bates DM, Bolstad B, Dettling M, Dudoit S, Ellis B,
Gautier L, Ge Y, Gentry J, Hornik K, Hothorn T, Huber W, Iacus S, Irizarry R,
Leisch F, Li C, Maechler M, Rossini AJ, Sawitzki G, Smith C, Smyth G,
Parrish et al. Journal of Translational Medicine 2010, 8:87
/>Page 11 of 12
Tierney L, Yang JY, Zhang J: Bioconductor: open software development
for computational biology and bioinformatics. Genome Biol 2004, 5:R80.
27. Irizarry RA, Bolstad BM, Collin F, Cope LM, Hobbs B, Speed TP: Summaries
of Affymetrix GeneChip probe level data. Nucleic Acids Res 2003, 31:e15.
28. Schadt EE, Molony C, Chudin E, Hao K, Yang X, Lum PY, Kasarskis A,
Zhang B, Wang S, Suver C, Zhu J, Millstein J, Sieberts S, Lamb J,
GuhaThakurta D, Derry J, Storey JD, Avila-Campillo I, Kruger MJ, Johnson JM,
Rohl CA, van Nas A, Mehrabian M, Drake TA, Lusis AJ, Smith RC,
Guengerich FP, Strom SC, Schuetz E, Rushmore TH, Ulrich R: Mapping the
Genetic Architecture of Gene Expression in Human Liver. PLoS Biol 2008,
6:e107.
29. Grant GR, Liu J, Stoeckert CJ Jr: A practical false discovery rate approach
to identifying patterns of differential expression in microarray data.
Bioinformatics 2005, 21:2684-2690.
30. He YD, Dai H, Schadt EE, Cavet G, Edwards SW, Stepaniants SB, Duenwald S,
Kleinhanz R, Jones AR, Shoemaker DD, Stoughton RB: Microarray standard
data set and figures of merit for comparing data processing methods
and experiment designs. Bioinformatics 2003, 19:956-965.
31. Garcia-Manero G, Yang H, Bueso-Ramos C, Ferrajoli A, Cortes J, Wierda WG,
Faderl S, Koller C, Morris G, Rosner G, Loboda A, Fantin VR, Randolph SS,
Hardwick JS, Reilly JF, Chen C, Ricker JL, Secrist JP, Richon VM, Frankel SR,
Kantarjian HM: Phase 1 study of the histone deacetylase inhibitor
vorinostat (suberoylanilide hydroxamic acid [SAHA]) in patients with
advanced leukemias and myelodysplastic syndromes. Blood 2008,
111:1060-1066.
32. Van Gelder RN, von Zastrow ME, Yool A, Dement WC, Barchas JD,
Eberwine JH: Amplified RNA synthesized from limited quantities of
heterogeneous cDNA. Proc Natl Acad Sci USA 1990, 87:1663-1667.
33. Ramsborg CG, Papoutsakis ET: Global transcriptional analysis delineates
the differential inflammatory response interleukin-15 elicits from
cultured human T cells. Exp Hematol 2007, 35:454-464.
34. Kempf K, Rose B, Herder C, Haastert B, Fusbahn-Laufenburg A,
Reifferscheid A, Scherbaum WA, Kolb H, Martin S: The metabolic syndrome
sensitizes leukocytes for glucose-induced immune gene expression.
J Mol Med 2007, 85:389-396.
35. Mitsuhashi M: Ex vivo simulation of drug action: quantification of drug-
induced mRNA as a bridge between preclinical and clinical trials. Clin
Chem 2007, 53:148-149.
36. Mitsuhashi M, Ogura M, Endo K, Obara K, Izutsu H, Targan SR, Maemura M,
Tachikawa D, Shinagawa A: Ex vivo induction of mRNA in human whole
blood as a new platform of drug and dietary supplement development.
Pharm Res 2008, 25:1116-1124.
37. Prync AE, Yankilevich P, Barrero PR, Bello R, Marangunich L, Vidal A,
Criscuolo M, Benasayag L, Famulari AL, Dominguez RO, Kauffman MA,
Diez RA: Two recombinant human interferon-beta 1a pharmaceutical
preparations produce a similar transcriptional response determined
using whole genome microarray analysis. Int J Clin Pharmacol Ther 2008,
46:64-71.
38. Baechler EC, Batliwalla FM, Karypis G, Gaffney PM, Moser K, Ortmann WA,
Espe KJ, Balasubramanian S, Hughes KM, Chan JP, Begovich A, Chang SY,
Gregersen PK, Behrens TW: Expression levels for many genes in human
peripheral blood cells are highly sensitive to ex vivo incubation. Genes
Immun 2004,
5:347-353.
39. Feezor RJ, Baker HV, Mindrinos M, Hayden D, Tannahill CL, Brownstein BH,
Fay A, MacMillan S, Laramie J, Xiao W, Moldawer LL, Cobb JP, Laudanski K,
Miller-Graziano CL, Maier RV, Schoenfeld D, Davis RW, Tompkins RG: Whole
blood and leukocyte RNA isolation for gene expression analyses. Physiol
Genomics 2004, 19:247-254.
doi:10.1186/1479-5876-8-87
Cite this article as: Parrish et al.: cDNA targets improve whole blood
gene expression profiling and enhance detection of pharmocodynamic
biomarkers: a quantitative platform analysis. Journal of Translational
Medicine 2010 8:87.
Submit your next manuscript to BioMed Central
and take full advantage of:
• Convenient online submission
• Thorough peer review
• No space constraints or color figure charges
• Immediate publication on acceptance
• Inclusion in PubMed, CAS, Scopus and Google Scholar
• Research which is freely available for redistribution
Submit your manuscript at
www.biomedcentral.com/submit
Parrish et al. Journal of Translational Medicine 2010, 8:87
/>Page 12 of 12