Báo cáo hóa học: "Quantification of newly produced B and T lymphocytes in untreated chronic lymphocytic leukemia patients" ppt
Bạn đang xem bản rút gọn của tài liệu. Xem và tải ngay bản đầy đủ của tài liệu tại đây (337.61 KB, 7 trang )
RESEARC H Open Access
Quantification of newly produced B and
T lymphocytes in untreated chronic
lymphocytic leukemia patients
Marina Motta
1
, Marco Chiarini
2
, Claudia Ghidini
2
, Cinzia Zanotti
2
, Cinzia Lamorgese
1
, Luigi Caimi
2
, Giuseppe Rossi
1
,
Luisa Imberti
2*
Abstract
Background: The immune defects occurring in chronic lymphocytic leukemia are responsible for the frequent
occurrence of infections and autoimmune phenomena, and may be involved in the initiation and maintenance of
the malignant clone. Here, we evaluated the quantitative defects of newly produced B and T lymphocytes.
Methods: The output of B and T lymphocytes from the production and maturation sites was analyzed in chronic
lymphocytic leukemia patients and healthy controls by quantifying kappa-deleting recombination excision circles
(KRECs) and T-cell receptor excision circles (TRECs) by a Real-Time PCR assay that simultaneously detects both
targets. T-lymphocyte subsets were analyzed by six-color flow cytometric analysis. Data comparison was performed
by two-sided Mann-Whitney test.
Results: KRECs level was reduced in untreated chronic lymphocytic leukemia patients studied at the very early stage
of the disease, whereas the release of TRECs
+
cells was preserved. Furthermore, the observed increase of CD4
+
lymphocytes could be ascribed to the accumulation of CD4
+
cells with effector memory phenotype.
Conclusions: The decreased number of newly produced B lymphocytes in these patients is likely related to a
homeostatic mechanism by which the immune sy stem balances the abnormal B-cell expansion. This feature may
precede the profound defect of humoral immunity characterizing the later stages of the disease.
Background
Profound defects of both humoral and cell-mediated
immunity have been described in patients with chronic
lymphocytic leukemia (CLL), a disease characterized by
the accumulation of mature, malignant, monoclonal B
lymphocytes in bloo d, lymph nodes, spleen, liver, a nd
bone marrow [1]. The disease is characterized by the
presence of immune defects, responsible for the fre-
quent occurrence of infections and autoimmune phe-
nomena, that may be involved in the initiation and
maintenance of the malignant clone. The immune
abnormalities include reduced immunoglobulin (Ig)
levels, as well as qualitative and quantitative defects of
B, T, NK cells, neutrophils, and the monocyte/
macrophage lineage [2,3]. All these immunological
changes are linked to an increased frequency and sever-
ity of inf ections [3]. Since CLL represents a heteroge-
neousdiseasewithaveryvariableoutcome,areliable
prognosis at the time of initial diagnosis is difficult to
predict; similarly, only few early markers anticipating
the immune defects arising in the later stages of the dis-
ease have been up to now identified. In this context, a
small size of the blood T/NK-cell compartment com-
pared to that of circulating leukemic clone at the time
of diagnosis was associated with more advanced stages,
raising the possibility that CLL patients with efficient
hostimmunitymayexperienceamoreindolentdisease
due to a more effective immune response against the
disease [2]. However, the maintenance of an immune
surveillance needs a continuous source of newly pro-
duced B and T lymphocytes. While it has been found
that the proliferation of malignant B cells decreases the
* Correspondence:
2
Laboratory of Biotechnology, Diagnostic Department, Spedali Civili, Piazzale
Spedali Civili 1, 25123, Brescia, Italy
Full list of author information is available at the end of the article
Motta et al. Journal of Translational Medicine 2010, 8:111
/>© 2010 Motta et al; licensee BioMed Central Ltd. This is an Open Access article distributed under the terms of the Creative Commons
Attribution License ( which permits unrestricted use, distribution, and reproduction in
any medium, provided the original work is properly cited.
number of newly mobilized T cells from the thymus [4],
it is not known whether this may also influence the
release of new B cells from the bone marrow. To answer
this question, we combined the method of kappa-delet-
ing recombination excision circles (KRECs) detection,
initially developed by van Zelm et al [5] and modified
later by Fronkova et al [6], with the well established
method of measuring T -cell receptor excision circles
(TRECs) [7], thus obtaining a duplex Real-Time PCR
assay allowing the simultan eous measure of newly pro-
duced B and T cells. KRECs and TRECs are episomal
DNA products generated during the lymphocyte devel-
opment and differentiation process, when B- and T-cell
receptor gene rearrangements occur and specific chro-
mosomal sequences need to be excised [5-7]. These
excision products cannot be replicated and, therefore,
KRECs and TRECs are diluted when cells proliferate,
and are lost when cells die. Since KRECs are randomly
present in about 5 0% of B cells released from the bone
marrow and TRECs in 70% of T cells leaving the thy-
mus, their quantification is considered a reliable esti-
mate of the amount of newly produced B and T
lymphocytes [8,9]. Here, we applied the n ew assay,
together with the flow cytometry, to quantify the num-
ber of recently produced B and T cells and the periph-
eral lymphocyte expansion in untreated CLL patients,
who were at a very early stage of the disease.
Methods
Patients
Peripheral blood from 12 untreated CLL patients (male:
female ratio: 5:1, median age: 66 years, and range: 48 -77
year s) who attended the outpatient clinic of our Institu-
tion and from 20 age-matched healthy controls (male:
female ratio: 5:2, median age: 65 years, and range: 50 -69
years) was used for flow cytometric analysis and for per-
ipheral blood mononuclear cells (PBMC) preparation by
Ficoll-Hypaque gradient centrifugation. The participants,
who were prospect ively enrolled f rom November 2007
to September 2009, signed an informed consent; all
experimental procedures, performed on samples col-
lected from 1 to 134 months after the diagnosis, were
done according to Hels inki declaration, as requested by
our Institutional Ethical Committee (resolution n° 512
of June 25, 2007). DNA w as obtained from PBMC and
from a human lymphoblastoid B-cell line using the
QIAamp DNA Blood Mini Kit (Qiagen).
Blood samples were also sent to the laboratory for
routine tests, which included the immunophenotyping
of peripheral blood required for the diagnosis of CLL
as well as prognostic tests such as serum b2-microglo-
bulin and Ig determination, f luorescence in situ hy bri-
dization (FISH) analysis for del13q14, del17p13, and
del11q22-q23, +12, and sequence study of rearranged
immunoglobulin heavy chain variable (IgVH) gene
mutational status.
Characterization of T-cell subpopulations
The monoclonal antibodies used for six-color flow cyto-
metric analysis were purchased from BD Pharmingen
(fluorescein isothiocyanate anti-CD3 and -CD45RA,
peridin-clorophyll protein-Cy5.5 anti-CD8 and allophy-
cocyanin-H7 anti-CD4), BioLegend (phycoerythrin anti-
CD25 and peridin-clorophyll protein-Cy5.5 anti-CCR7),
eBioscience (phycoerythrin-Cy7 anti-CD127), and Milte-
nyi Biotech (allophycocyanin anti-CD31).
thymic
naive Th
cells were defined as CD4
+
T helper (Th) cells with
naive (CD4
+
CD45RA
+
CCR7
+
) phenotype also expressing
CD31
+
molecule, T regulatory cells (Treg) as CD4
+
CD25
int/high
CD127
low/-
lymphocytes [10,11], and
thymic-
naive Th cells-Treg as Treg expressing CD45RA, CCR7,
and CD31 markers [12]. Effector memory (T
EM
)and
central memory (T
CM
) T cells were lymphocytes display-
ing CD4
+
CD45RA
-
CCR7
-
and CD4
+
CD45RA
-
CCR7
+
phenotype, respectively [11]. For the quantification of
thymic
naive Th cells and Treg within peripheral blood,
CD4
+
cells were first gated on lymphocytes and then
analyzed for the expression of other surface antigens.
CD3
+
CD8
+
cytotoxic T lymphocyte ( CTL) population
was evaluated in a separate tube. Data were collected on
a FACSCanto II cytometer and results were analyzed
with FACSDiva software (BD Biosciences).
Real-Time PCR for KRECs and TRECs quantification
The number of KRECs and TRECs was simultaneously
quantified with a duplex quantitative Real-Time PCR pro-
tocol performed on the 7500 Fast Real-Time PCR and
data were analyzed by 7500 Fast Real-Time System Soft-
ware (Applied Biosystems); the amplification of the refer-
ence gene, a segment of T-cell receptor constant alpha
chain (TRAC), was done in the same plate. The sequences
and the quantity of primers and probes used for the assay,
as well as the amplification schedule, were described else-
where [13,14]. KRECs, TRECs, and TRAC copy number
has been obtained by extrapolating the respective sample
quantities from the standard curve obtained by serial dilu-
tions (10
6
,10
5
,10
4
,10
3
,10
2
, and 10) of a linearized plas-
mid DNA, containing three inserts corresponding to
fragments of KRECs, TRECs and TRAC.
The number of KRECs or TRECs (copies/PBMC) is
calculated with the following formula:
mean of KRECs or TRECs quantity
mean of TRAC quantity / 2
(1)
The mean quantity of TRAC has to be divided b y 2
because each cell carries two copies of TRAC gene, i.e.,
one for each chromosome.
Motta et al. Journal of Translational Medicine 2010, 8:111
/>Page 2 of 7
Results were expressed either as copies/10
6
PBMC or
copies/mL obtained respectively by multiplying the
above calculat ed value by 10
6
, or, as done by Chen et al
[15], by the number of ly mphocytes plus monocytes
(which are the cells obtained in PBMC preparation).
Finally, the average number of B-cell divisions was
evaluated, as reported by van Zelm et al [5], by calculat-
ing the difference between the c ycle threshold number
obtained by PCR amplification of signal joints, which
are sequences contained into KRECs, and the cycle
threshold number obtained after amplification of coding
joints, which are sequences generated during the rear-
rangement of IGK chain that remain stably present in
the genome and are duplicated during each cell division.
Statistical analysis
Since data did not follow a Gaussian distribution, they
were described in terms of median and interquartile
range, and comparisons were performed by two-sided
Mann-Whitney test. Results were considered signif icant
if P < 0.05.
Results and Discussion
Characterization of CLL patients
All patients enrolled in this study were in a very early
stage of disease (Rai stage 0, Binet stage A) and had not
been previously treated. Their demographic and labora-
tory parameters are shown in Table 1. The analysis of
biological prognostic factors showed 7 (58%) patients
with mutated IgVH, 6 (50%) patients with 13q14
deletion at FISH analysis, and 3 (25%) patients with
b2-microglobulin above the normal range. A decrease in
serum Ig levels during the course of the disease is a
common f eature of CLL and correlates with the disease
stage and the occurrence of infections [3]. Accordingly,
in all our patients but one, the IgG and IgA serum levels
were within the normal range found in controls, and
this was expected, considering their very early stage of
disease. On the contrary, IgM level was below the nor-
mal range in 7 (58%) patients, thus indicating that the
reduced concentration of IgM is not only the most fre-
quent Ig alteration observed in CLL [16], but likely also
the most precocious.
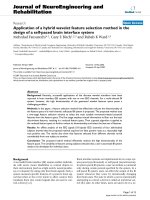
Analysis of tumor DNA interference in KRECs and TRECs
quantification
To exclude the potential confounding effect of tumor
DNA derived from monoclonal B cells on the quantifi-
cation of KRECs and TRECs, genomic DNA from
PBMC of 2 healthy donors with high and low number
of KRECs and TRECs was serially diluted into DNA of a
human lymphoblastoid cell line to obtain final concen-
trations of normal lymphocyte DNA ranging from 3% to
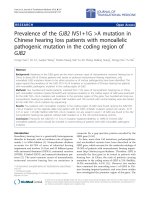
100%. While KRECs and TRECs were undetectable in
100% tumor DNA, the amount of KRECs/10
6
and
TRECs/10
6
cells of both donors showed a linear change,
being detected even at concentration as low as 3% of
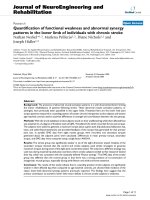
normal DNA (Figure 1), sugges ting that the presence of
high number of blasts in CLL patient samples should
not bias the assay results.
Table 1 Demographic, clinical and laboratory parameters of CLL patients
Patients 1 2 3456 7 89101112Controls
(range)
Age 68 65 69 68 48 77 73 53 67 53 56 66 50-69
Gender M* M M M M M M F M M M F na
Rai stage 0 0 0 0 0 0 0 0 0 0 0 0 na
Binet stage A A A A A A A A A A A A na
Lymphocytes/μL 12 350 30
210
27 500 8
050
5
290
38 470 47 810 14 330 6
030
10
980
24
680
11 360 950-4
612
Haemoglobin (g/dL) 15.6 13.4 14.0 14.2 14.4 13.5 11.7 15.5 16.0 15.2 14.5 14.2 14-18
Platelets (10
3
/μL) 236 216 173 128 247 211 139 160 150 147 220 183 130-400
b2-microglobulin (mg/L) 2.0 2.5 2.8 2.2 1.9 2.1 4.7 2.0 3.7 2.4 2.5 2.4 <2.5
Direct Antiglobulin Test neg neg neg neg neg neg neg neg neg neg neg neg neg
IgVH mutational status mut unm mut unm mut unm mut unm mut unm mut mut na
FISH del13q14 neg del13q14 neg neg del13q14 del13q14 del13q14 neg neg neg del13q14 na
IgG (mg/dL) 979 1 104 936 857 740 908 672 551 702 904 860 1 448 690-1
500
Clonally expanded
chains
Igl Ig Ig Igl Igl Igl Ig Ig Ig Ig Ig Ig na
IgA (mg/dL) 190 368 107 186 113 86 234 40 123 211 243 106 85-410
IgM (mg/dL) 38 58 38 53 113 15 36 36 17 46 13 95 40-240
*Abbreviations: M, male; F, female; na, not applicable; neg, negative; IgVH, immunoglobulin heavy chain variable genes; mut, mutated; unm, unmutated; FISH,
fluorescence in situ hybridization.
Motta et al. Journal of Translational Medicine 2010, 8:111
/>Page 3 of 7
Quantification of newly produced B cells and measure of
the average number of B-cell divisions in CLL patients
While the decreased Ig synthesis in CLL has been pre-
viously ascribed to the release of inhibitory cytokines
upon cell-cell contact between normal and malignant B
cells [3], the finding of an early IgM decrease could be
also due to changes in the profile of different B-lympho-
cyte subpopulations, as demonstrated in p atients with
selective IgM deficiency [17]. Indeed, we found that
another B-cell compartment defect observed in CLL
patients was the significant decrease of KRECs, both
measured per 10
6
PBMC and per mL of blood (Table
2). It is noteworthy that to perform KRECs analysis it is
not necessary to separate normal from leuke mic popula-
tion since KRECs are no t contained in B lymphocytes
that have undergone multiple divisions, like clonally-
derived leukemic cells. Therefore, if the low number of
KRECs/10
6
PBMCcouldbeascribedtothealteredpro-
portion of normal B cells that was greatly reduced due
to the expansion of leukemic cells, the decreased num-
ber of KRECs/mL clearly indicated a real decline in
newly produced B lymphocytes in the patients compared
to controls. This result suggests that one of the reasons
of the early IgM decrease could be attributed to the
reduced production of new B lymphocytes because if Ig
production is not sustained by a continuous supply of
new B cells, Ig synthesis would progressively decrease as
the old B cells die off. When we compared the number
of KRECs of patients with low and normal IgM serum
level, we did not find a significant difference, likely
because of the low numbe r of pa tients included in the
two groups. Analogously, there was no significant
correl ation between the number of lymphocytes and the
number of KRECs/mL. This negative result could be
ascribed to the wide range not only of lymphocytes of
our CLL patients, which was between 5 000 and 48 000
cells/μL, but also to the KRECs number, which varied
greatly between individuals [[13] and u npublished
observation].
As expected, the average number of B-cell divisions,
determine d according to v an Zelm et al [5], was signi fi-
cantly increased in our CLL patients (Table 2). The pre-
sence of coding joints in all Igl
+
mature B lymphocytes
and only in about 30% of Ig
+
B cells is the reason of
the lower average number of B-cell divisions found in
patients with clonal expansions of Ig chains (see Table
1). However, 3 (25%) of these patients (Pt 1: 4.5, Pt 3:
3.6 and Pt 7: 3.2 average number of B-cell divisions)
showed the highest number of KRECs (Pt 1: 6 472/mL,
Pt 3: 8 513/mL, and Pt 7: 7 396/mL).
Quantification of newly produced T cells and phenotypic
analysis of T-cell subpopulations
We then investigated if B-cell lymphocytosis may also
affect the extent of new T-lymphocyte production. Simi-
larlytowhatobservedbyNardiniet al [4], we found
that the median number of TRECs/10
6
PBMC was sig-
nificantly l ower in CLL patients t han in controls (Table
2). Analogously to that reported for KRECs, the inter-
pretation of results expressed as TRECs/10
6
PBMC can
be objectionable because the increased number of per-
ipheral divisions sustained by tumor cells artificially
dilutes the TRECs level, regardless of recent thymic pro-
duction . On the contrary, TRECs number calculated p er
Figure 1 KRECs and TRECs determination in increasing concentrations of non-tumoral DNA into DNA from a lymphoblastoid B-cell
line. DNA extracted from two healthy controls with either high (filled symbols) or low (open symbols) number of KRECs (circles) and TRECs
(diamonds) was diluted into DNA extracted from a lymphoblastoid B-cell line, in order to obtain decreasing concentration of tumoral DNA.
Straight line: regression line for KRECs; dotted-line: regression line for TRECs.
Motta et al. Journal of Translational Medicine 2010, 8:111
/>Page 4 of 7
mL of blood is considered to be more reliable of thymic
function, especially when significant cellular prolifera-
tion occurs [18]. Indeed, we found that when calculated
per mL of blood, the median number of TRECs was
comparable in CLL patients and controls. This result is
supported by the presence in both groups of a s imilar
number of naive lymphocytes and, within this subset, of
comparable number of
thymic
naive Th cells, which are
known to represent the fraction of lymphocytes recently
emigrated from the thymus (Table 3) [19]. Likewise,
Table 3 Phenotypic characterization of T-cell subpopulations
Patients Controls
median IQR* median IQR
Th cells % 10.2 4.7-23.9 50.9 43.5-54.7 P = 0.002
cells/μL 1 585 1 275-2 533 1 029 785-1 428 P = 0.05
naive Th cells % 46.4 27.2-49.5 51.1 46.5-62.5 NS
cells/μL 715 381-834 533 363-786 NS
thymic
naive Th cells % 54.4 41.9-63.6 64.1 58.4-70.1 NS
cells/μL 345 228-447 333 223-545 NS
Treg % 4.8 3.3-6.1 5.4 4.7-7.4 NS
cells/μL 82 44-123 62 44-80 NS
thymic
naive-Treg % 2.0 1.5-3.0 1.8 1.0-2.9 NS
cells/μL 8 4-17 7 4-11 NS
T
EM
% 22.4 10.9-31.9 10.4 8.0-11.5 P = 0.04
cells/μL 245 202-367 98 80-146 P = 0.0002
T
CM
% 30.8 24.1-40.1 30.7 26.7-37.8 NS
cells/μL 520 270-957 308 248-401 NS
CTL % 4.1 3.0-9.0 24.8 22.2-29.0 P < 0.0001
cells/μL 479 350-780 483 387-539 NS
T-cell subpopulations were determined by six-color flow cytometric analysis using various combinations of monoclonal anti bodies. The percentage of Th cells
and CTL is obtained after gating on lymphocytes, that of naive Th cells, Treg, T
EM
and T
CM
after gating on Th cells, and that of
thymic
naive Th cells after gating on
naive Th cells. The percentage of
thymic
naive Treg is obtained after gating on
thymic
naive Th cells. *Abbreviations: IQR, Interquartile range; Th cells, T helper cells;
Treg, regulatory T cells; T
EM
, effector memory T cells; T
CM
, central memory T cells; CTL, cytotoxic T cells.
Table 2 Number of KRECs and TRECs and average number of B-cell divisions
Patients Controls
median IQR* median IQR
KRECs /10
6
PBMC 200 99-448 5 372 2 798-7 617 P = 0.0001
/mL 3 763 1 318-6 486 12 942 6 556-19 490 P = 0.0001
Average number 6.7 3.8-14.1 4.0 3.0-4.5 P = 0.003
of B-cell divisions
TRECs /10
6
PBMC 216 64-949 1 374 834-3 046 P = 0.002
/mL 2 869 1 601-11 812 3 053 1 960-6 401 NS
KRECs and TRECs were determined by Real-Time PCR. Results are given both as copies/10
6
PBMC and copies/mL. The average number of B-cell divisions was
calculated as the difference between the cycle threshold number obtained by PCR amplification of signal joints, and the cycle threshold number obtained after
amplification of coding joint s.
*Abbreviations: IQR, Interquartile range; KRECs, kappa-deleting recombination excision circles; TRECs, T-cell receptor excision circles.
Motta et al. Journal of Translational Medicine 2010, 8:111
/>Page 5 of 7
similar values of Treg and
thymic
naive-Treg were found
in patients and controls. Therefore, we have not found
in these CLL patients at the very early disease stage the
decreased number of Treg observed by Beyer et al [20].
This discrepancy may be due to the fact that these
authors preferentially analyzed patients at later disease
stage(BinetstageBandC),andbecausetheyidentified
Treg as CD4
+
CD25
high
cells while, according to Liu
et al [10], we more finely targeted this subpopulation by
includinginTregsubsetonlyCD4
+
CD25
int/high-
CD127
low/-
lymphocytes. T
CM
cell number was not dif-
ferent in CLL patients and controls, while the
percentage and number of T
EM
cells were higher in the
patients. The expansion of these cells, which lacking
CCR7 expression have the capacity to migrate to inflam-
mation sites and to produce large amounts of proin-
flammatory cytokines, may be one of the r easons of the
increased number of CD4
+
Th cells that we have found
in our patients (Table 3), which is known to be a com-
mon characteristic of CLL patients [3]. The observed
skewing towards T
EM
is likely related t o a strong and
persistent tumor antigenic trigger, and is not linked to
homeostatic proliferation due to previous exposure to
immunosuppressive drugs, since our patients were all
untreated. Finally, while the percent age of CTL was sig-
nificantly lower in these patients, the total n umber of
this cell population was comparable to that of controls.
Conclusions
Based on these preliminary observations we suggest that the
production of new T lymphocytes is normal in CLL at the
very early disease stage; the presence of CD4 lymphocytosis
can be p artially ascribed to the accumula tion of CD4
+
effec-
tor memory cells in the peripheral blood. On the contrary,
the number of newly produced B cells is precociously
reduced and this may represent a warning signal anticipat-
ing t he profound defects of humoral immunity, which nor-
mally c haracterize the later stages of the disease. Therefore,
we are currently following patients at later stages of the dis-
ease in order t o investigate modifications of newly produced
B and T lymphocytes in the course of the therapy.
Acknowledgements
This work was supported by a grant from the Fondazione Berlucchi (Brescia)
and by “Progetto Sangue” - Regione Lombardia.
Author details
1
Department of Hematology, Spedali Civili, Piazzale Spedali Civili 1, 25123,
Brescia, Italy.
2
Laboratory of Biotechnology, Diagnostic Department, Spedali
Civili, Piazzale Spedali Civili 1, 25123, Brescia, Italy.
Authors’ contributions
LI was the principal investigator and takes primary responsibility for the
paper. MM and GR recruited the patients. MC, CG, CZ and CL performed the
laboratory work for this study. LI, MM, LC and GR wrote the manuscript and
participated to the discussion. All authors read and approved the final
manuscript.
Competing interests
The authors declare that they have no competing interests.
Received: 7 July 2010 Accepted: 5 November 2010
Published: 5 November 2010
References
1. Keating MJ, Chiorazzi N, Messmer B, Damle RN, Allen SL, Rai KR, Ferrarini M,
Kipps TJ: Biology and treatment of chronic lymphocytic leukemia.
Hematology Am Soc Hematol Educ Program 2003, 153-175.
2. Palmer S, Hanson CA, Zent CS, Porrata LF, Laplant B, Geyer SM,
Markovic SN, Call TG, Bowen DA, Jelinek DF, Kay NE, Shanafelt TD:
Prognostic importance of T and NK-cells in a consecutive series of
newly diagnosed patients with chronic lymphocytic leukaemia. Br J
Haematol 2008, 141:607-614.
3. Dearden C: Disease-specific complications of chronic lymphocytic
leukemia. Hematology Am Soc Hematol Educ Program 2008, 450-456.
4. Nardini E, Neri F, Vicenzi E, Poli G, Capello D, Gaidano G, Vitolo U, Ménard S,
Balsari A: Thymic function and immunoglobulin mutation genotype in B-
cell chronic lymphocytic leukemia patients. Int J Cancer 2003,
107:958-961.
5. van Zelm MC, Szczepanski T, van der Burg M, van Dongen JJM: Replication
history of B lymphocytes reveals homeostatic proliferation and extensive
antigen-induced B cell expansion. J Exp Med 2007, 204:645-655.
6. Fronkova E, Muzikova K, Mejstrikova E, Kovac M, Formankova R, Sedlacek P,
Hrusak O, Stary J, Trka J: B-cell reconstitution after allogeneic SCT impairs
minimal residual disease monitoring in children with ALL. Bone Marrow
Transplant 2008, 42:187-196.
7. Douek DC, McFarland RD, Keiser PH, Gage EA, Massey JM, Haynes BF:
Changes in thymic function with age and during the treatment of HIV
infection. Nature 1998, 396:690-695.
8. van Dongen JJ, Langerak AW, Bruggemann M, Evans PA, Hummel M,
Lavender FL, Delabesse E, Davi F, Schuuring E, García-Sanz R, van
Krieken JH, Droese J, González D, Bastard C, White HE, Spaargaren M,
González M, Parreira A, Smith JL, Morgan GJ, Kneba M, Macintyre EA:
Design and standardization of PCR primers and protocols for detection
of clonal immunoglobulin and T-cell receptor gene recombinations in
suspect lymphoproliferations: report of the BIOMED-2 Concerted Action
BMH4-CT98-3936. Leukemia 2003, 17:2257-2317.
9. Verschuren MC, Wolvers-Tettero IL, Breit TM, Noordzij J, van Wering ER, van
Dongen JJ: Preferential rearrangements of the T cell receptor-delta-
deleting elements in human T cells. J Immunol 1997, 158:1208-1216.
10. Liu W, Putnam AL, Xu-Yu Z, Szot GL, Lee MR, Zhu S, Gottlieb PA,
Kapranov P, Gingeras TR, Fazekas de St Groth B, Clayberger C, Soper DM,
Ziegler SF, Bluestone JA: CD127 expression inversely correlates with
FoxP3 and suppressive function of human CD4+ Treg cells. J Exp Med
2006, 203:1701-1711.
11. Chiarini M, Sottini A, Ghidini C, Zanotti C, Serana F, Rottoli M, Zaffaroni M,
Bergamaschi R, Cordioli C, Capra R, Imberti L: Renewal of the T-cell
compartment in multiple sclerosis patients treated with glatiramer
acetate. Mult Scler 2010, 16:218-227.
12. Haas J, Fritzsching B, Trübswetter P, Korporal M, Milkova L, Fritz B, Vobis D,
Krammer PH, Suri-Payer E, Wildemann B: Prevalence of newly generated
naive regulatory T cells (Treg) is critical for Treg suppressive function
and determines Treg dysfunction in multiple sclerosis. J Immunol 2007,
179:1322-1330.
13. Sottini A, Ghidini C, Zanotti C, Chiarini M, Caimi L, Lanfranchi A, Moratto D,
Porta F, Imberti L: Simultaneous quantification of recent thymic T-cell
and bone marrow B-cell emigrants in patients with primary
immunodeficiency undergone to stem cell transplantation. Clin Immunol
2010, 136:217-227.
14. Serana F, Sottini A, Chiarini M, Zanotti C, Ghidini C, Lanfranchi A,
Notarangelo LD, Caimi L, Imberti L: The different extent of B- and T-cell
immune reconstitution after hematopoietic stem cell transplantation
and enzyme replacement therapies in SCID patients with adenosine
deaminase deficiency. J Immunol 2010, Epub ahead of print.
15. Chen X, Barfield R, Benaim E, Leung W, Knowles J, Lawrence D, Otto M,
Shurtleff SA, Neale GA, Behm FG, Turner V, Handgretinger R: Prediction of
T-cell reconstitution by assessment of T-cell receptor excision circle
before allogeneic hematopoietic stem cell transplantation in pediatric
patients. Blood 2005, 105:886-893.
Motta et al. Journal of Translational Medicine 2010, 8:111
/>Page 6 of 7
16. Whiteside TL, Winkelstein A, Rabin BS: Immunologic characterization of
chronic lymphocytic leukemia cells. Cancer 1977, 39:1109-1111.
17. Ohno T, Inaba M, Kuribayashi K, Masuda T, Kanoh T, Uchino H: Selective
IgM deficiency in adults: phenotypically and functionally altered profiles
of peripheral blood lymphocytes. Clin Exp Immunol 1987, 68:630-637.
18. Lorenzi AR, Patterson AM, Pratt A, Jefferson M, Chapman CE, Ponchel F,
Isaacs JD: Determination of thymic function directly from peripheral
blood: a validated modification to an established method. J Immunol
Methods 2008, 339:185-194.
19. Kimmig S, Przybylski GK, Schmidt CA, Laurisch K, Möwes B, Radbruch A,
Thiel A: Two subsets of naive T helper cells with distinct T cell receptor
excision circle content in human adult peripheral blood. J Exp Med 2002,
195:789-794.
20. Beyer M, Kochanek M, Darabi K, Popov A, Jensen M, Endl E, Knolle PA,
Thomas RK, von Bergwelt-Baildon M, Debey S, Hallek M, Schultze JL:
Reduced frequencies and suppressive function of CD4+CD25hi
regulatory T cells in patients with chronic lymphocytic leukemia after
therapy with fludarabine. Blood 2005, 106:2018-2025.
doi:10.1186/1479-5876-8-111
Cite this article as: Motta et al.: Quantification of newly produced B and
T lymphocytes in untreated chronic lymphocytic leukemia patients.
Journal of Translational Medicine 2010 8:111.
Submit your next manuscript to BioMed Central
and take full advantage of:
• Convenient online submission
• Thorough peer review
• No space constraints or color figure charges
• Immediate publication on acceptance
• Inclusion in PubMed, CAS, Scopus and Google Scholar
• Research which is freely available for redistribution
Submit your manuscript at
www.biomedcentral.com/submit
Motta et al. Journal of Translational Medicine 2010, 8:111
/>Page 7 of 7