Báo cáo hóa học: "Thymoglobulin, interferon-g and interleukin-2 efficiently expand cytokine-induced killer (CIK) cells in clinical-grade cultures" potx
Bạn đang xem bản rút gọn của tài liệu. Xem và tải ngay bản đầy đủ của tài liệu tại đây (1.3 MB, 14 trang )
Bonanno et al. Journal of Translational Medicine 2010, 8:129
/>
RESEARCH
Open Access
Thymoglobulin, interferon-g and interleukin-2
efficiently expand cytokine-induced killer (CIK)
cells in clinical-grade cultures
Giuseppina Bonanno1,2, Paola Iudicone2, Andrea Mariotti1, Annabella Procoli1, Annino Pandolfi2,
Daniela Fioravanti2, Maria Corallo1, Alessandro Perillo1, Giovanni Scambia1, Luca Pierelli2,3†, Sergio Rutella4,5*†
Abstract
Background: Cytokine-induced killer (CIK) cells are typically differentiated in vitro with interferon (IFN)-g and aCD3
monoclonal antibodies (mAb), followed by the repeated provision of interleukin (IL)-2. It is presently unknown
whether thymoglobulin (TG), a preparation of polyclonal rabbit g immunoglobulins directed against human
thymocytes, can improve the generation efficiency of CIK cells compared with aCD3 mAb in a clinical-grade
culture protocol.
Methods: Peripheral blood mononuclear cells (PBMC) from 10 healthy donors and 4 patients with solid cancer
were primed with IFN-g on day 0 and low (50 ng/ml), intermediate (250 ng/ml) and high (500 ng/ml)
concentrations of either aCD3 mAb or TG on day 1, and were fed with IL-2 every 3 days for 21 days. Aliquots of
cells were harvested weekly to monitor the expression of representative members of the killer-like immunoglobulin
receptor (KIR), NK inhibitory receptor, NK activating receptor and NK triggering receptor families. We also quantified
the frequency of bona fide regulatory T cells (Treg), a T-cell subset implicated in the down-regulation of anti-tumor
immunity, and tested the in vitro cytotoxic activity of CIK cells against NK-sensitive, chronic myeloid leukaemia K562
cells.
Results: CIK cells expanded more vigorously in cultures supplemented with intermediate and high concentrations
of TG compared with 50 ng/ml aCD3 mAb. TG-driven CIK cells expressed a constellation of NK activating/inhibitory
receptors, such as CD158a and CD158b, NKp46, NKG2D and NKG2A/CD94, released high quantities of IL-12p40 and
efficiently lysed K562 target cells. Of interest, the frequency of Treg cells was lower at any time-point compared
with PBMC cultures nurtured with aCD3 mAb. Cancer patient-derived CIK cells were also expanded after priming
with TG, but they expressed lower levels of the NKp46 triggering receptor and NKG2D activating receptor, thus
manifesting a reduced ability to lyse K562 cells.
Conclusions: TG fosters the generation of functional CIK cells with no concomitant expansion of tumorsuppressive Treg cells. The culture conditions described herein should be applicable to cancer-bearing individuals,
although the differentiation of fully functional CIK cells may be hindered in patients with advanced malignancies.
Introduction
Adoptive cellular immunotherapy aims at restoring
tumour-cell recognition by the immune system, leading
to effective tumour cell killing. A major hurdle to the
successful immunotherapy of cancer is represented by
* Correspondence:
† Contributed equally
4
Department of Hematology, Catholic University Med. School, Rome, Italy
Full list of author information is available at the end of the article
the difficulty in generating clinically relevant numbers of
immune effector cells with potent in vivo anti-tumour
activity, especially in heavily pre-treated patients. To
date, various populations of cytotoxic effector cells have
been expanded using robust cell culture procedures and
have been administered in a variety of human cancers.
Host effector cells endowed with killing activity against
tumour cells were initially described in the early 1980s
as lymphokine-activated killer (LAK) cells [1,2]. The
© 2010 Bonanno et al; licensee BioMed Central Ltd. This is an Open Access article distributed under the terms of the Creative
Commons Attribution License ( which permits unrestricted use, distribution, and
reproduction in any medium, provided the original work is properly cited.
Bonanno et al. Journal of Translational Medicine 2010, 8:129
/>
LAK cell population is heterogeneous, being comprised
of CD3-CD56+ NK cells, CD3+CD56+ MHC-unrestricted
cytotoxic T cells and CD3 + CD56 - T cells. Over the
years, improvements in culture conditions, such as the
addition of aCD3 (OKT3) monoclonal antibody (mAb)
at the initiation of culture and the provision of cytokines
at the end of culture, translated into better expansion of
LAK cells. Current protocols to differentiate cytokineinduced killer (CIK) cells are based on a combination of
1,000 IU/ml interferon (IFN)-g on day 1 of culture, followed 24 hours later by OKT3 at 50 ng/ml and interleukin (IL)-2 at 300 IU/ml [3]. At the end of the 21-28 day
culture period, CD3 + CD56 + cells, derived from
CD3+CD56- cells, acquire cytotoxicity against various
tumour cell targets, including acute myeloid leukaemia
(AML), chronic myeloid leukaemia (CML), B and T-cell
lymphoma. The expression of CD56 on CIK cells is
thought to result from IFN-g priming with IL-12 production from monocytes. CIK cells share phenotypic
and functional properties of both T cells and NK cells,
insofar they express CD3 and are rapidly expandable in
culture like T cells, while not necessitating functional
priming for in vivo activity like NK cells. Interestingly,
CIK cells do not recognize target cells through the Tcell receptor (TCR) and do not require the presence of
major histocompatibility complex (MHC) molecules on
target cells, as suggested by the observation that cytotoxicity is not affected by antibody masking of the TCR
or MHC class I or class II molecules [4]. Cytotoxicity by
CIK cells does not rely on antibody-dependent cell cytotoxicity (ADCC) mechanisms, given the absence of
CD16 on their surface membrane, and is not inhibited
by the immune suppressive drugs cyclosporine A and
FK506 [5]. Conversely, the anti-tumour activity of CIK
cells mainly relies on the engagement of NK Group 2,
member D (NKG2D) by NKG2D ligands on tumour
cells, and on perforin-mediated pathways [6].
The in vivo activity of CIK cells was initially demonstrated in a murine SCID/human lymphoma model,
where the co-administration of CIK cells with B lymphoma cells exerted a favorable effect on mice survival,
with a 1.5-2-log cell kill and minimal toxicity against
normal hematopoietic precursors [4]. CIK cells were
subsequently shown to protect against syngeneic and
allogeneic tumors in other experimental models, including nude mice xenografted with human cervical carcinoma cells [7-9]. An international registry (IRCC) has
been recently established with the aim to report results
from current clinical trials using CIK cells, either as
such or additionally manipulated [10]. Eleven clinical
trials with autologous or allogeneic CIK cells were identified, with 426 patients enrolled. Most trials included
male patients with hepatocellular carcinoma, gastric
cancer and relapsed lymphoma [11,12]. A clinical
Page 2 of 14
response was reported in 384 patients who received up
to 40 infusions of CIK cells. The total response rate was
24% and a decrease of tumour volume was documented
in 3 patients. However, disease-free survival rates were
significantly higher in patients treated with CIK cells
than in a control group without CIK treatment.
Thymoglobulin® (TG) is a purified, pasteurized preparation of polyclonal g immunoglobulin raised in rabbits against human thymocytes [13]. TG is currently
indicated for the prevention and/or treatment of renal
transplant rejection, and displays specificity towards a
wide variety of surface antigens on both immune system
and endothelial cells. The precise mechanism(s) of
action underlying its immunosuppressive efficacy are
unclear, although T-cell depletion is considered to play
a prominent role. Other mechanisms include lymphocyte surface antigen modulation, transcription factor
activation, and interference with processes of immune
system cells, such as cytokine production, chemotaxis,
endocytosis, stimulation and proliferation (reviewed in
ref. [13]). TG may also induce apoptosis, antibodydependent lysis or complement-mediated lysis of various
immune system cells, thus negating leukocyte-endothelial cell adhesion. Intriguingly, anti-lymphocyte globulin
therapy in patients with aplastic anemia enhanced the
function of MHC-unrestricted lymphocytes [14]. It is
presently unknown whether TG can expand CIK cells
more efficiently than aCD3 mAb in clinical-grade
cultures.
We report herein the results of an in vitro study
where TG was confronted with aCD3 mAb for its ability to promote the expansion and acquisition of cytotoxicity by CIK cells. We show that TG amplifies the
number of CIK cells with greater efficiency than aCD3
after 21 days in culture. CIK cells generated in this fashion express a constellation of NK cell-associated inhibitory/activating receptors, release considerable amounts
of IL-12p40 and lyse the NK-sensitive K562 cell line.
The above culture conditions were also applied to
PBMC from heavily pre-treated cancer patients, to
ascertain whether TG can be a candidate drug for the
optimization of CIK expansion protocols in preparation
for clinical trials.
Materials and methods
Generation of CIK cells
CIK cells were generated under good manufacturing
practice (GMP) conditions. Peripheral blood samples
were obtained by phlebotomy in 10 consented healthy
donors (median age 45 years; range, 22-58 years) and by
steady-state apheresis in 4 patients with advanced cervical cancer (n = 3) or melanoma (n = 1). The patients’
characteristics are listed in Table 1. The investigations
were reviewed and approved by the Ethical Committee
Bonanno et al. Journal of Translational Medicine 2010, 8:129
/>
Page 3 of 14
Table 1 Patients’ characteristics
UPN Age/
Sex
Tumor
(histotype)
Stage/grade at
diagnosis
Previous treatments
WBC×103/μl
(PB/LK)*
Lymphocytes×103/
μl (PB/LK)*
1
30/F
Melanoma
Advanced,
metastatic disease
Surgery, chemotherapy
4.8/55.1
1.19/28.82
2
62/F
Cervical cancer
(squamous)
FIGO IIB
Neoadjuvant radiochemotherapy, radical surgery,
chemotherapy (2 lines)
5.0/66.2
1.28/33.9
3
44/F
Cervical cancer
(squamous)
FIGO IB
Radical surgery, adjuvant radiochemotherapy,
chemotherapy (4 lines)
5.52/29.8
0.69/14.66
4
55/F
Cervical cancer
(squamous)
FIGO IIIB
Radiochemotherapy, chemotherapy (3 lines)
5.41/51.6
1.52/22.14
WBC = white blood cells; PB = peripheral blood; LK = leukapheresis product.
*Blood cell counts were obtained at patient enrolment.
of the Catholic University Medical School in Rome (protocol ID: P/757/CE/2009).
Peripheral blood samples collected by venipuncture
were layered over Ficoll-Paque® (GE Healthcare Life
Sciences; Milan, Italy) and peripheral blood mononuclear cells (PBMC) were separated by centrifugation at
1,400 rpm for 30 minutes, as already detailed [15]. After
washings with PBS, PBMC were grown in serum-free
medium (X-VIVO 10; Bio-Whittaker Europe, Belgium)
supplemented with 80 mg/L gentamycin (Schering
Plough, Milan, Italy) and incubated at 37°C in a 5% CO2
atmosphere. Cells were seeded at 2.0 × 10⁶ cells/ml in
25 cm2 cell culture flasks (Corning, NY 14831, USA).
On day 0, cells were activated with recombinant human
IFN-g (1,000 IU/ml; Imukin®, Boehringer Ingelheim,
Ingelheim, Germany). The following day, cells were stimulated with either aCD3 mAb (UCHT1 clone; 50-500
ng/ml, BD Biosciences, San Diego, CA) or Thymoglobulin® (50-500 ng/ml, Genzyme Corp., Cambridge, MA)
and recombinant human IL-2 (rHuIL-2, 300 IU/ml; Proleukin®, Novartis Pharma, Milan, Italy). Cell suspensions
were maintained in subculture with fresh medium supplemented with rHuIL-2 every 3 days for 3 weeks. For
quality control, aliquots of cells were harvested weekly
and used for automatic cell counting, phenotypic analysis, and microbiologic testing. Cell viability was evaluated at the end of the culture period by flow cytometry,
after labeling with 7-amino-actinomycin-D (7-AAD;
Sigma-Aldrich, Milan, Italy) [16].
Flow cytometry and immunofluorescence
At baseline (day 0) and after 7, 14 and 21 days in culture, aliquots of cells were incubated for 30 minutes at
4°C with fluorochrome-conjugated mAb to CD3, CD8,
CD45, CD16+CD56 (BD Multitest™IMK Kit; BD Biosciences, Mountain View, CA), CD94, CD158a
(KIR2DL1), CD158b (KIR2DL2/DL3; BD Biosciences),
NKG2A (KLRC1 or CD159a; R&D Systems, Oxon, UK),
NKp46 (CD335), NKG2D (CD314; Beckman Coulter,
Milan, Italy). Isotype-matched, fluorochrome-conjugated
mAb from the same manufacturers were used to control
for background fluorescence. The intracellular expression of the FoxP3 transcription factor was detected in
fixed/permeabilized T cells that were initially labeled
with anti-CD4 and anti-CD25 mAb (both from BD Biosciences), followed by Alexa Fluor 488-conjugated rat
anti-human FoxP3 mAb (PCH101 clone; Human Regulatory T Cell Staining Kit; eBioscience, San Diego, CA).
Cells were run through a FACS Canto® flow cytometer
(BD Biosciences) with standard equipment [17]. Samples
were analyzed with the FACS Diva® software package
(BD Biosciences).
Cytotoxicity assay
After 21 days in culture, aliquots of cells were used for
cytotoxicity assays. Calcein acetoxymethyl ester (CAM)
has been recently developed as an alternative to radioactive 51 Cr release assay [18]. CAM is a lipid-soluble,
non-polar compound that passively crosses the plasma
membrane in living cells, where it is cleaved by intracellular esterases to reveal a very polar derivative of fluorescein (calcein) that remains trapped in the cytoplasm.
CAM (Fluka, Sigma Aldrich) was dissolved in DMSO to
a final concentration of 1 mM and stored in aliquots at
-80°C. K562 target cells (1 × 10⁶), derived from a patient
suffering from CML in blast crisis, were incubated in XVIVO 10 medium in the presence of pre-titrated concentrations of CAM (0.1 μM) for 10 minutes at 37°C,
shielded from light. The labeled cells were washed two
times in ice-cold medium supplemented with 10% fetal
bovine serum (FBS), were re-suspended in X-VIVO 10
and then plated in round bottom 96-well plates at 5-10
× 105 cells/well in triplicate. CIK cells were added at the
effector-to-target (E:T) ratios detailed in the Figure
legends, in a final volume of 200 μl, and were incubated
for 4 hours. Cells were then washed with ice-cold PBS
and re-suspended in 20 μg/ml 7-AAD for 20 minutes at
room temperature, shielded from light, before flow cytometry analysis [19]. 7-AAD is a fluorescent DNA
dye that selectively binds to GC regions of the DNA.
Bonanno et al. Journal of Translational Medicine 2010, 8:129
/>
Page 4 of 14
The 7-AAD assay has been used to detect the loss of
membrane integrity during apoptosis of murine thymocytes and human peripheral lymphocytes [20]. Percent
specific cell death was calculated according to the following formula, as previously published [21]:
with the Mann-Whitney or the Wilcoxon signed-rank
tests for paired or unpaired determinations, as appropriate. The criterion for statistical significance was defined
as p < 0.05.
Results
% dead targets − %spontaneous dead targets
× 100
100 − % spontaneous dead targets
Generation of CIK cells with TG
Measurement of IL-12p40
After 21 days, supernatants from CIK cell cultures were
collected and used to quantify IL-12p40 production by
enzyme-linked immunosorbent assay (ELISA; R&D Systems, Oxon, UK), as reported [22]. The limit of detection was <15 pg/ml IL-12p40.
Statistical analysis
Data distribution was preliminarily tested with kurtosis
and symmetry. Data were presented as median and
inter-quartile range. All comparisons were performed
In a first set of experiments, we determined whether
and to what extent TG promotes the generation of functional CIK cells and other desirable populations of
immune effectors, namely, CD3+CD8+ T cells and CD3CD56+ NK cells, starting from PBMC preparations. To
this end, PBMC from consented volunteer donors were
cultured in the presence of IFN-g, IL-2 and either TG
or aCD3 mAb at low (50 ng/ml), intermediate (250 ng/
ml) or high concentration (500 ng/ml), as schematically
depicted in Figure 1A. Cells were harvested on days +7,
+14 and +21, were counted to calculate fold-expansion
compared with baseline and were used to assess informative phenotypic features. The percentage of CD3+ ,
CD8 + and CD3 + CD56 + T cells in a representative
A
TG/ CD3
IFN-
IL-2
IL-2
IL-2
IL-2
IL-2
IL-2
IL-2
IL-2
0
1
4
7
10
13
16
19
21
day
C
53.9
125
TG
100
75
50
int
100
*
75
50
25
25
0
0
9.0
60
12.4
66.3
50
low
60
CD3
30
20
**
100
75
50
0
D0 D7 D14 D21
int
60
CD3
50
40
TG
D0 D7 D14 D21
Cells (x106)
12.3
hi
25
D0 D7 D14 D21
Cells (x106)
125
TG
hi
CD3
50
Cells (x106)
26.1
15.7
low
Cells (x106)
4.3
Cells (x106)
B
Cells (x106)
125
40
30
20
40
30
20
10
10
10
0
0
0
D0 D7 D14 D21
D0 D7 D14 D21
D0 D7 D14 D21
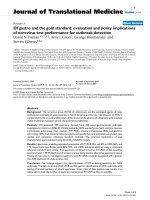
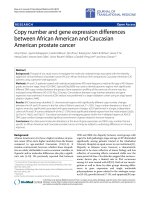
Figure 1 Experimental layout and expansion of PBMC in cultures supplemented with TG. Panel A: PBMC from consented healthy donors
were initially exposed to IFN-g (day 0), followed by different concentrations of either TG or aCD3 mAb (day +1) and IL-2 every 3 days. Further
details are provided in Materials and Methods. Panel B: The frequency of CD3+CD8+ T cells, NK cells (CD3-CD16+CD56+) and CD3+CD56+ T cells
from a representative PBMC sample at baseline is shown. Quadrant markers were set according to the proper isotypic control (not shown). The
percentage of cells staining positively for a given antigen is indicated. Panel C: Cells were harvested weekly and counted. The number of cells
was significantly higher after challenging with TG either at 250 (intTG; *p < 0.05) or 500 ng/ml (hiTG; **p < 0.05) compared with equal
concentrations of aCD3 mAb (bottom row).
Bonanno et al. Journal of Translational Medicine 2010, 8:129
/>
Table 2 TG-induced expansion (fold-increase) of PBMC
from healthy donors
Culture
condition
T = 7d
T = 14d
T = 21d
low
aCD3
(50 ng/ml)
1.70
(1.2-2.3)
8.47
(3.9-15.58)
22.21
(9.78-33.04)
low
TG
(50 ng/ml)
2.90
(1.72-2.94)
8.74
(7.85-16.61)
30.56
(18.91-33.65)
int
aCD3
(250 ng/ml)
0.30
(0.24-1.35)
2.63
(0.26-5.01)
14.3
(10.05-15.41)
int
TG
(250 ng/ml)
2.50
(2.47-3.56)
14.86*,^
(7.21-17.45)
33.47§,^
(23.72-40.77)
hi
aCD3
(500 ng/ml)
0.59
(0.28-0.9)
5.28
(5.03-8.30)
11.75
(9.80-12.05)
hi
TG
(500 ng/ml)
2.63
(2.05-3.02)
11.96**,^
(6.01-17.91)
46.08§§,^^
(34.84-57.31)
Fold expansion of PBMC cells in culture has been calculated by dividing the
absolute number of cells at days 7, 14 and 21 by the absolute number of cells
at day 0. * and §p < 0.05 compared with intaCD3 mAb; ** and §§ p < 0.01
compared with hiaCD3 mAb. ^ p < 0.05 compared with lowaCD3 mAb; ^^ p <
0.01 compared with lowaCD3 mAb.
PBMC sample before culturing is shown in Figure 1B.
When used at intermediate (intTG) and high concentration (hiTG), TG induced a greater expansion of PBMC
compared with equal concentrations of aCD3 mAb, and
the difference was maximal after 14 and 21 days in
Page 5 of 14
culture (Table 2 and Figure 1c). Hi TG promoted a
46.08-fold expansion of PBMC on day +21, compared
with a median 11.75-fold expansion in the presence of
hi
aCD3 mAb. In contrast, int aCD3 and hi aCD3 mAb
failed to further increase PBMC number compared with
low
aCD3 at any time-point in culture (Table 2), likely
reflecting enhanced levels of activation-induced cell
death. As shown in Table 2, both intTG and hiTG caused
a greater fold-expansion of PBMC compared with aCD3
mAb at a concentration routinely used to differentiate
CIK cells, i.e., 50 ng/ml.
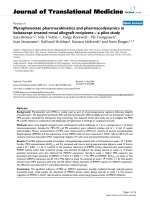
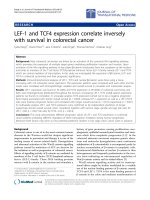
We next calculated the absolute number and estimated the frequency of CD3+CD8+ T cells, CD3-CD16
+
CD56+ (NK cells), and CD3+CD16+CD56+ (CIK cells)
in cultures supplemented with aCD3 mAb (Figure 2A;
Figure 3) or TG (Figure 2B; Figure 3). These PBMC cultures started with a typical percentage of approximately
6-9% and 8-12% CD3 + CD56 + T cells and NK cells,
respectively (Figure 1B). After the 21-day culture period,
the median percentages of CIK cells and NK cells in
cultures maintained with hi aCD3 and hi TG were 64%
and 9.7%, and 55% and 27.5%, respectively. As expected,
CIK cells were predominantly comprised of CD3+CD8+
T cells. It should be noted that the percentage of CD3
+
CD8+ T cells at any time-point was consistently higher
in cultures supplemented with TG. This difference was
maximal when comparing CIK cultures at day +7 after
priming with TG or aCD3 mAb, as illustrated in Figure
5
60
40
20
0
int
2
5
CD3
60
40
20
0
20
15
10
0
hi
35
CD3
3
2
1
30
hi
CD3
25
20
15
10
5
0
D0 D7 D14 D21
20
0
D0 D7 D14 D21
int
40
20
0
int
D0 D7 D14 D21
*
TG
60
hi
TG
*
40
20
0
10
*
30
20
10
0
20
D0 D7 D14 D21
60
hi
TG
*
10
hi
TG
*
50
40
30
20
10
0
D0 D7 D14 D21
TG
40
D0 D7 D14 D21
*
60
int
50
0
80
20
0
D0 D7 D14 D21
100
30
10
20
60
TG
40
D0 D7 D14 D21
TG
80
low
50
CIK (x106)
*
*
10
D0 D7 D14 D21
100
60
TG
0
D0 D7 D14 D21
4
0
D0 D7 D14 D21
25
D0 D7 D14 D21
NK cells (x106)
CD3+CD8+ T cells (x106)
hi
CD3
5
0
80
int
30
1
D0 D7 D14 D21
100
35
CD3
4
3
40
D0 D7 D14 D21
CIK (x106)
CD3
60
low
CIK (x106)
0
D0 D7 D14 D21
NK cells (x106)
CD3+CD8+ T cells (x106)
int
10
20
TG
80
CIK (x106)
0
80
15
5
D0 D7 D14 D21
100
20
low
NK cells (x106)
1
25
100
NK cells (x106)
0
2
CD3
NK cells (x106)
20
3
low
30
CD3+CD8+ T cells (x106)
40
35
CD3
CD3+CD8+ T cells (x106)
60
low
4
CD3+CD8+ T cells (x106)
5
CD3
CIK (x106)
low
80
CIK (x106)
100
B
NK cells (x106)
CD3+CD8+ T cells (x106)
A
0
D0 D7 D14 D21
D0 D7 D14 D21
Figure 2 Expansion of CIK cells, NK cells and CD8+ T cells in cultures supplemented with TG. The absolute number of CD3+CD8+ T cells,
NK cells (CD3-CD16+CD56+) and CIK cells (CD3+CD16+CD56+) was estimated weekly after the provision of either aCD3 mAb (panel A) or TG
(panel B) to the cultures. Cumulative results from 10 experiments performed with 10 different PBMC preparations are expressed as median and
inter-quartile range. *denotes a statistically significant difference (p < 0.05) when comparing cell numbers in TG-containing cultures with those
in cultures nurtured with an equal concentration of aCD3 mAb.
Bonanno et al. Journal of Translational Medicine 2010, 8:129
/>
Page 6 of 14
CD3
low
1.6
43.4
5.3
21.4
1.8
69.8
8.1
52.8
3.2
64.2
7.9
47.1
4.0
69.3
6.5
21.8
0.3
38.7
7.7
24.9
hi
2.5
18.5
3.9
7.6
0.6
59.6
4.1
18.0
2.9
61.1
16.2
int
62.9
8.9
79.6
4.7
35.1
1.3
76.6
5.8
30.3
1.9
19.5
3.2
5.1
0.5
43.9
2.0
14.0
2.9
46.0
14.0
3.1
52.5
1.3
82.7
64.5
11.6 80.1
3..3
43.6
16.9
28.7
8.0
59.5
32.3
17.9
35.1
4.5
49.9
17.7
14.8
0.2 18.5
2.4
49.7
10.1
30.9
9.4
59.5
29.3
12.1
35.8
6.9
52.1
15.8
15.3
0.1
2.3
45.4
7.5
27.8
3.8
58.1
13.7
38.7
7.5
57.1
18.2
20.0
10.0
41.2
9.7
0.4
7.3
69.6
20.3
47.9
1.1
43.7
8.7
29.3
3.8
58.2
TG
low
int
hi
Day 7
49.0
8.3
53.6
27.3
60.9
18.5
19.6
0.5
11.3
53.0
11.1
58.7
22.7
69.0
17.6
12.7
17.6
0.1
8.3
22.7
52.6
6.3
60.1
19.6
71.1
0.8
24.0
13.5
20.1
0.2
9.0
Day 21
Day 14
+
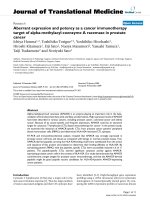
Figure 3 Phenotypic features of TG-expanded CIK cells, NK cells and CD8 T cells. The frequency of CD3+CD8+ T cells, NK cells (CD3-CD16
+
CD56+) and CIK cells (CD3+CD16+CD56+) was measured by flow cytometry weekly after the provision of different concentrations of either TG
or aCD3 mAb to the cultures. One experiment out of 10 with similar results is shown. Quadrant markers were set according to the proper
isotypic control (not shown). The percentage of cells staining positively for a given antigen is indicated.
2A-2B (cumulative data) and in Figure 3 (a representative experiment out of 10 with similar results). At this
time-point in culture, the increase of aCD3 mAb concentration in the medium was associated with a progressive decline in the percentage of CD3+CD8+ T cells, a
phenomenon that was also evident after 14 and 21 days
(Figure 3). Similarly, NK cells were significantly more
represented within CIK cultures activated with TG
when compared with cultures nurtured with aCD3
mAb. Whereas day-21 CIK cultures contained a median
27.5% NK cells after priming with hiTG, the fraction of
NK cells was consistently < 10% in CIK cultures activated with aCD3, irrespective of the mAb concentration
in the culture medium (Figure 3). Taken together, phenotypic analyses indicated that the heterogeneous population of cells that emerged after 21 days in culture with
TG contained higher numbers of CIK cells and other
immune effectors such as CD8 + T cells and NK cells
compared with those differentiated with aCD3 mAb.
Also, hiTG was significantly more effective than intTG
and low TG at generating the three populations of
immune effector cells.
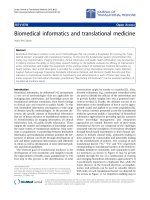
We next addressed whether TG in combination with
IL-2 favors the concomitant expansion of Treg cells, as
defined by their FoxP3+ phenotype. The rationale for
these experiments stems from a previous report
indicating that high concentrations of TG (10 μg/ml)
up-regulate molecules associated with Treg function on
CD4+ T cells [23]. Even more intriguingly, IL-2, which
is routinely used to generate CIK cells, is a Treg-cell
growth factor both in vitro (reviewed in ref. [24]) and in
vivo [25,26]. As shown in Figure 4A, the cumulative frequency of bona fide Treg cells was lower in cultures
containing TG versus aCD3, suggesting that the clinical
application of TG for the generation of anti-tumor effector cells is not expected to negatively affect anti-tumor
immunity through Treg cells. A representative experiment aimed at quantifying Treg-cell frequency by flow
cytometry both at baseline and in expanded CIK cultures is illustrated in Figure 4B and 4C. Based on the
above data and to maximize the yield of CIK cells in
culture, TG was consistently used at 250 ng/ml or 500
ng/ml in all subsequent experiments, as detailed in the
Figure legends.
Phenotype and effector functions of in vitro-generated
CIK cells
We proceeded to investigate the expression of triggering
and inhibitory receptors that may modulate cytotoxicity
by the cultured CIK cells. To this end, PBMC were
primed with intTG or hiTG and then maintained for 21
days with IL-2 to achieve maximal expansion, followed
Bonanno et al. Journal of Translational Medicine 2010, 8:129
/>
Page 7 of 14
C
1.0
low
CD3
0.8
0.6
0.4
0.2
0.0
CD4+ FoxP3+ T cells (x106)
CD4+ FoxP3+ T cells (x106)
A
1.0
lowTG
low
CD3
0.6
0.4
0.2
0.0
CD3
0.8
0.6
0.4
0.2
0.0
2.6
97.5
2.5
97.7
2.3
97.9
2.1
97.8
2.2
D21
97.0
3.0
95.6
4.4
95.5
4.5
98.1
1.9
93.8
6.2
89.4
10.6
93.4
6.6
98
2
97.7
2.3
96.2
3.8
95.6
4.4
93.6
6.4
0.4
0.2
0.0
1.0
int
TG
0.8
0.6
0.4
0.2
0.0
1.0
hi
low
TG
D7
int
CD3
hi
CD3
CD3
0.8
0.6
0.4
0.2
D14
0.0
D0 D7 D14 D21
B
97.4
D0 D7 D14 D21
CD4+ FoxP3+ T cells (x106)
CD4+ FoxP3+ T cells (x106)
hi
1.5
0.6
D0 D7 D14 D21
1.0
hiTG
98.5
D0 D7 D14 D21
CD4+ FoxP3+ T cells (x106)
CD4+ FoxP3+ T cells (x106)
int
0.8
intTG
D7
D14
0.8
D0 D7 D14 D21
1.0
TG
D0 D7 D14 D21
93.1
6.9
D21
Figure 4 Frequency of bona fide Treg cells after the provision of either aCD3 mAb or TG to the cultures. Panel A: Cumulative frequency
of CD4+FoxP3+ Treg cells within PBMC stimulated with either TG or aCD3 mAb. Data are expressed as median and inter-quartile range. Panels B
and C: Flow cytometry detection of intracellular FoxP3 in CD4+ T cells at baseline (B) and after their in vitro expansion (C). Cells were fixed,
permeabilized and labeled as detailed in Materials and Methods. Quadrant markers were set according to the proper isotypic control (not
shown). The percentage of cells staining positively for intracellular FoxP3 is indicated.
by labeling with a panel of mAb recognizing the NK
activating receptor NKG2D, the NK triggering receptor
NKp46, the NK inhibitory receptor CD94-NKG2A and
two representative members of the KIR family
(KIR2DL1 or CD158a and KIR2DL2/DL3 or CD158b).
The phenotypic features of CIK cells generated with TG
were compared with those of CIK cells emerging from
PBMC cultures containing lowaCD3, a standard culture
protocol for CIK cells [27]. Cells were initially gated
based on their expression of CD3. Data shown in Figure
5 are representative of the co-expression of CD56 and
the antigens of interest on CD3+ T cells harvested from
the PBMC cultures at day +21. Hi TG induced significantly higher levels of KIR on the expanded CIK cells,
when compared with either int TG or low aCD3 mAb
(Figure 5A). Similarly, the NKG2A/CD94 heterodimer,
the NKp46 triggering receptor and the NKG2D activating receptor were preferentially up-regulated on CIK
cells differentiated with hiTG compared with the other
culture conditions herein established (Figure 5).
A further set of experiments was devoted to the analysis of CIK cell cytotoxicity against the NK-sensitive
K562 target cells, taking advantage of a non-radioactive,
flow cytometry-based assay. K562 cells were loaded with
the fluorescent probe CAM and then co-cultured with
escalating numbers of CIK cells, as detailed in Materials
and Methods. Cells emerging from the co-cultures were
gated based on CAM fluorescence and then visualized
on a CAM/7-AAD contour plot to enumerate CAM+7AAD+ dead targets (Figure 6A). In accordance with phenotypic data showing a higher expression of NK effector
molecules on cells harvested from TG-driven cultures,
CIK cells differentiated with intTG and hiTG lysed K562
cells more efficiently than CIK cells generated with lowaCD3 mAb (Figure 6B). The cytotoxicity of CIK cells
cultured under hiTG was maximal at an E:T ratio of 10.
It should be noted that the difference in cytotoxic
potential of CIK cells expanded by hiTG was most pronounced at an E:T ratio of 5, where specific lysis averaged 60% compared with <30% under the other culture
conditions (p < 0.01; Figure 6B). These observations
suggest that a higher frequency of cytotoxic cells was
present within the population of PBMC expanded with
hi
TG compared with either int/lowTG or lowaCD3 mAb.
Bonanno et al. Journal of Translational Medicine 2010, 8:129
/>
5
5.1
6.8
6.7
Page 8 of 14
20.1
Day 0
3.8
3.2
13.4
23.4
0.1
1.7
2.8
27.4
5.9
55.5
23
1.4
0.5
8.2
0.3
3.2
1.9
0.1
5.8
13.7
15
1.4
5.8
0.1
3.3
Day 21,
CD3
low
10.5
0.3
9.8
0.1
1.7
1.6
19.3
57.3
Day 21,
intTG
16.1
0.7
22.3
0.3
7.8
4
47.6
28
37.7
53.7
8
26.8
3.7
0.6
31.9
11.3
18.1
0.3
16.7
9.1
1.6
36.7
6.9
16.7
0.2
16.5
Day 21,
hiTG
29.6
NK inhibitory
0.1
9.5
NK activating
54.9
21.8
KIRs
33.2
NK triggering
Figure 5 Expression of NK-cell inhibitory/activating receptors on CIK cells generated with TG. After 21 days of culture in the presence of
either TG or aCD3 mAb, cells were harvested and labeled with mAb recognizing NK inhibitory receptors (NKG2A/CD94), NK activating receptors
(NKG2D), KIR (CD158a, CD158b) and NK triggering receptors (NKp46). A representative experiment out of 10 with similar results is shown.
Quadrant markers were set according to the proper isotypic control (not shown). The percentage of cells staining positively for a given antigen
is indicated.
IL-12 is a T helper type 1 (Th1) cytokine that augments NK-cell proliferation in vitro and enhances their
cytotoxicity in vivo [28]. The expression of IL-12p40
subunit is known to be restricted to cells that produce
the biologically active IL-12 heterodimer [29]. As shown
in Figure 6C, IL-12p40 levels were significantly higher in
day 21-cultures differentiated with hiTG compared with
either lower doses of TG or aCD3 mAb. Taken
together, these experiments suggest that hiTG-differentiated CIK cells may be particularly suitable for adoptive
immunotherapy approaches to cancer.
Generation and function of CIK cells from cancer patients
In view of the promising results obtained when challenging PBMC from healthy donors with hiTG, we evaluated whether the generation of CIK cells from cancer
patient-derived PBMC could be successfully pursued
under the same experimental conditions (priming with
IFN-g on day 0 and then with IL-2 and TG on day +1).
Figure 7A depicts the average number of PBMC, CD8+
T cells, NK cells and CIK cells in 4 experiments performed with PBMC from 4 patients with cervical cancer
or melanoma. Hi TG induced a vigorous expansion of
PBMC, CD8+ T cells and CIK cells, but not NK cells,
peaking after 21 days in culture (Figure 7A). It should
be pointed out that the average number of NK cells differentiated from patient PBMC was lower compared
with donor PBMC at any time-point. Nevertheless, these
data suggest that TG can generate clinically relevant
numbers of CIK cells in cancer-bearing patients. Table 3
summarizes the frequency of all types of effector cells
that were differentiated from patients’ PBMC after 21
days in culture. The frequency of CD8+ T cells, NK cells
and CIK cells at baseline and after 7, 14 and 21 days in
culture in a representative experiment is shown Figure
7B. As depicted in Figure 7C and in line with our findings with PBMC from healthy volunteers, the percentage
of bona fide Treg cells was significantly lower after culturing with any concentration of TG for 21 days compared with the frequency measured in patients’
peripheral blood, indicating in vitro depletion of preexisting Treg cells. The higher percentage of Treg cells
routinely detected in baseline peripheral blood samples
was not unexpected, based on previously published data
on the expansion of the Treg compartment in cancer
patients [30]. Importantly, patient-derived CIK cells
expressed lower levels of KIR, NKG2A, NKG2D and
NKp46 compared with CIK cells differentiated from
normal donors (Figure 7D). Functional assays are individually shown in Figure 8A and indicated that in vitro
K562 cell lysis by CIK cells was highly efficient in 2 out
of 4 cases here examined (patients #2 and #3), especially
when CIK cells were plated at a relatively high E:T ratio.
The cytotoxicity experiments performed with CIK cells
from the 4 patients enrolled in the present study have
been summarized in Figure 8B. Both patients whose
Bonanno et al. Journal of Translational Medicine 2010, 8:129
/>
A
Page 9 of 14
Co-culture
(4 hours)
CAM+ cells (K562)
Gating strategy
K562
44.2%
7.5%
9.2%
CIK
B
E:T ratio
20
10
5
1
C
0
*
60
40
20
0
IL-12p40 (pg/ml/106 cells)
Specific lysis (%)
80
900
750
CD3
TG
600
450
300
150
0
low
low
CD3
low
TG
int
TG
*
int
hi
hi
TG
Figure 6 Cytolytic function and IL-12p40 release by CIK cells generated with TG. Panel A: The gating strategy for the analysis of CIKmediated cytotoxicity is shown in a representative experiment. After co-culture with CIK cells, K562 targets were identified and gated based on
CAM expression. The percentage of lysed K562 cells was then calculated on a CAM/7-AAD contour plot. Panel B: After 21 days of culture in the
presence of either lowaCD3 mAb or different concentrations of TG, cells were harvested and co-cultured with NK-sensitive tumor cell targets
(K562 cells) for 4 hours at the indicated effector-to-target (E:T) ratio. K562 cells were pre-labeled with CAM, a fluorescent probe. The percent
specific lysis was calculated as detailed in Materials and Methods. * denotes a p value < 0.01 when compared with cultures containing intTG,
low
TG and lowaCD3 mAb. Panel C: IL-12p40 release was measured at the end of culture (21 days) in the presence of escalating concentrations of
either aCD3 mAb or TG. Bars depict median values recorded in 3 independent ELISA run in duplicate with supernatants from 3 different PBMC
preparations. * denotes a p value < 0.01 when compared with cultures containing int/lowTG, int/lowaCD3 mAb and hiaCD3.
CIK cells were capable of lysing K562 cells in vitro were
affected by cervical carcinoma, but had been heavily
pre-treated and had advanced, metastatic disease at
study enrolment (Table 1). No obvious differences in
terms of white blood cell and lymphocyte count at baseline (day 0, i.e., at time of leukapheresis) were evident
when comparing patients #2 and #3 with the 2 patients
(#1 and #4) showing poor in vitro cytolytic responses
(Table 1), suggesting that qualitative rather than quantitative determinants likely accounted for the observed
phenomena. It should be noted that CIK cultures from
patient #3 were particularly heterogeneous and
contained a relatively high percentage of bona fide NK
cells with a classical CD3-CD56+ phenotype.
Discussion
The present study aimed at dissecting the role of TG in
the differentiation of CIK cells, a heterogeneous population of immune effector cells sharing T-cell and NK-cell
characteristics. The relationship between in vivo circulating CD3+CD56+ T cells and in vitro-generated CIK
cells is poorly understood. Human CD3+CD56+ T cells
can be detected within peripheral blood CD8+ T cells
and express CD16, CD161, NKG2D and KIR such as
Bonanno et al. Journal of Translational Medicine 2010, 8:129
/>
Page 10 of 14
B
Cells (x106)
100
CD3+ CD8+ T cells (x106)
A
hi
TG
75
50
25
0
20
NK (x106)
CIK (x106)
5.5
7.1
20.9
Day 0
C
34.0
Day 0
0.7
71.8
0.8
29.3
7.82
5
25.9
Day 7
0
69.3
D0 D7 D14 D21
TG
10
TG
10
1.5
hi
15
19.6
hi
15
D0 D7 D14 D21
20
0.6
0.8
hi
TG
1.0
77.9
1.4
18.6
Day 14
47.9
Day 21
50.5
0.52
0.5
5
1.3
71.2
3.1
51.2
0.0
0
D0 D7 D14 D21
D0 D7 D14 D21
24.6
Day 21
42.7
D
14.9
1.08
3.05
7.24
1.6
2.65
14.8
12.90
29.2
9.63
0.03
0.71
Day 0
0.11
30.2
8.65
6.65
0.62
5.7
4.55
1.35
4.3
0.69
1.04
8.5
10.2
41.6
27.3
9.84
0.11
1.25
Day 21,
hiTG
0.05
21.2
KIRs
23.7
16.4
NK inhibitory
1.31
NK activating
26.9
NK triggering
Figure 7 Generation of CIK cells with hiTG from patients with advanced solid cancer. The culture conditions described in Materials and
Methods were used to generate CIK cells from the PBMC of 4 patients with advanced cancer. HiTG was used in these studies because it induced
maximal expansion of CIK cells from healthy donor PBMC. Panel A: The absolute number of PBMC, CD3+CD8+ T cells, NK cells (CD3-CD16+CD56+)
and CIK cells (CD3+CD16+CD56+) was estimated weekly after the provision of hiTG to the cultures. Results summarize (median and inter-quartile
range) 4 independent experiments performed with PBMC preparations from 4 different patients. Panel B: The frequency of CD3+CD8+ T cells, NK
cells (CD3-CD16+CD56+) and CIK cells (CD3+CD16+CD56+) from a representative PBMC sample is shown at baseline (day 0) and after 7, 14 and
21 days in culture. Quadrant markers were set according to the proper isotypic control (not shown). The percentage of cells staining positively
for a given antigen is indicated. Panel C: Flow cytometry detection of intracellular FoxP3 in CD4+ T cells from a representative PBMC culture.
Cells were fixed, permeabilized and labeled as detailed in Materials and Methods. The percentage of cells staining positively for intracellular
FoxP3 is indicated both at baseline and after 21 days in culture. Quadrant markers were set according to the proper isotypic control (not
shown). Panel D: The expression of NK-cell inhibitory/activating receptors was investigated by flow cytometry, as previously detailed. A
representative experiment out of 4 with similar results is shown. Quadrant markers were set according to the proper isotypic control (not
shown). The percentage of cells staining positively for a given antigen is indicated.
CD158a, CD158b and CD94 [31]. The most extensively
characterized human NK antigen-expressing CD3+ Tcell subset is represented by CD56+ T cells that account
for ~5% of peripheral blood T cells. CD56+ T cells lyse
NK-sensitive target cell lines in vitro, can be selectively
expanded by IL-2 and IL-15, but require cell activation
to trigger the secretion of effector cytokines such as
IFN-g and TNF-a. It has been recently shown that CIK
cells expanded with IFN-g, OKT3 and IL-2 resemble
activated effector-memory CD8 + T cells and likely
derive from CD56- T cells, as suggested by gene expression profiling [32]. In this respect, only 50 differentially
expressed genes were identified when comparing CIK
cells and CD56- T cells, whereas 115 genes were either
up-regulated or down-regulated in CIK cells compared
with CD56 - T cells [32]. Collectively, it is now
Bonanno et al. Journal of Translational Medicine 2010, 8:129
/>
Page 11 of 14
Table 3 Phenotypic features of patient-derived effector
cells after 21 days in culture.
CD3+CD8+ (T cells)
CD3+CD16+CD56+
(CIK cells)
CD3-CD16+CD56+
(NK cells)
1
78%
57.64%
0.5%
2
81.5%
40.5%
1.2%
3
79.8%
36.3%
12.2%
4
71.2%
51.2%
3.1%
Pt #
recognized that CIK cells have undisputed advantages
over other cell therapy products that make them particularly attractive, such as ease of in vitro expansion,
superior in vivo activity than LAK cells, and no need for
exogenous administration of IL-2 for in vivo priming
[33,34]. Current laboratory protocols dictate that CIK
cells should be differentiated with IFN-g and the OKT3
mAb to CD3, followed by repeated additions of IL-2 for
a maximum of 21-28 days [3,11,12,33].
Our interest in TG as a candidate drug to expand CIK
cells in preparation for clinical trials originated from
reports indicating that binding of TG to CD16, CD18
and NKp46 on NK cells potentiates their activation and
degranulation, and enhances IFN-g production, although
this translated into the decrease of NK cytotoxicity
against K562 cells [35]. When selecting the optimal TG
concentration to be used in culture, we took advantage of
previously published papers showing the following
points. First, TG may induce ~ 15% NK cell apoptosis in
vitro, when added at concentrations ranging from 1 μg/
ml to 100 μg/ml [35,36]. Second, TG directly affects CD4
+
T-cell function and cytokine release when used at 10
μg/ml, transiently up-regulating CD25, FoxP3 and
CTLA-4 mRNA and protein, and increasing IL-2, IL-4,
IL-10 and IFN-g secretion in culture supernatants. Third,
CD4+ T cells pre-treated with 10 μg/ml TG inhibit the
proliferation of autologous CD4+ T cells to allogeneic
PBMC, suggesting the acquisition of a regulatory phenotype [23]. We therefore elected to provide TG at relatively low concentrations (from 50 to 500 ng/ml) to the
PBMC cultures, in order to minimize both NK and possibly CIK-cell apoptosis as well as the amplification of
Treg cell numbers. TG significantly expanded PBMC
compared with low aCD3 mAb, leading to the in vitro
A
K562 alone
0.8
E:T = 20
8
E:T = 10
6.6
E:T = 5
E:T = 1
6.2
9.2
Pt#1
98.5
91.3
89.3
91.5
B
87.7
0.9
18.0
11.4
8.8
Pt #2
96.1
0.3
13.4
76.2
38.9
84.3
20.5
87.4
10.8
89.8
49.1
70.5
20
10
1.7
Pt #3
99.7
Specific lysis (%)
30
97.2
84.1
0
20
0.6
5.0
4.4
3.2
10
5
E:T ratio
3.6
1
K562
alone
Pt #4
97.5
91.8
91.5
93.2
93.6
Figure 8 Cytolytic activity of CIK cells generated with hi TG from patients with advanced solid cancer. Panel A: CIK cells were
differentiated with hiTG from 4 patients with advanced solid cancer and were used to assess cytolytic activity against NK-sensitive tumor-targets.
K562 CML cells were pre-loaded with CAM, a fluorescent probe, followed by their co-culture with CIK cells for 4 hours at the indicated E:T ratio.
Contour plots depict the raw percentage of 7-AAD+CAMint target cells that have been lysed at the end of the 4-hour co-culture. Quadrant
markers were set according to the proper isotypic control (not shown), i.e., K562 cells that were neither loaded with CAM nor labeled with 7AAD. Panel B: Cumulative cytotoxicity of CIK cells differentiated from the 4 patients with advanced solid cancer. Bars depict median values with
interquartile range. The percentage of 7-AAD+ cells in cultures with K562 target cells alone (background cell death) is shown as uncolored
column.
Bonanno et al. Journal of Translational Medicine 2010, 8:129
/>
generation of a heterogeneous population comprised of
CD8+ T cells, NK cells and CIK cells. Especially when
used at 500 ng/ml, TG augmented the proliferation of
PBMC with subsequent enhanced generation of CD8+ T
cells, NK and CIK cells, compared both with an equally
high concentration of aCD3 mAb and with low TG or
int
TG. This implies that hiTG may be particularly effective
at the concurrent expansion of all three types of immune
effector cells, namely, CD8+ cytotoxic T cells, NK cells
and CIK cells, at variance with aCD3 mAb. Of potential
importance for the design of clinical trials with TG/IL-2expanded CIK cells, the frequency of bona fide Treg cells
at any time-point in culture was similar when comparing
PBMC preparations activated with IL-2 and TG or aCD3
mAb, thus reassuring against the infusion of excessive
numbers of tumor-suppressive Treg cells [25].
NK cells express a wide array of inhibitory and activating receptors such as KIR, NKG2A/CD94, NKG2D,
NKp46 and others, which recognize both foreign and self
antigens expressed by target cells, and finely regulate NK
cytotoxicity against virus-infected and tumor cells [37].
NK receptors play a crucial role in innate immunity
against infections and in anti-tumor immune responses.
It is presently unknown whether TG modulates the
expression of NK receptors on CIK cells, a finding with
important implications for their cytotoxic activity and for
their ability to combat infections. The KIR family consists
of 11 highly polymorphic receptors that are clonally distributed on NK cells and bind directly to classical MHC
molecules such as particular HLA-Cw alleles. KIR may
be expressed at low levels (i.e., < 10%) on CIK cells differentiated with standard protocols [32]. In our study, both
CD158a (KIR2DL1) and CD158b (KIR2DL2/DL3) were
readily detected on CIK cells expanded with hiTG, with
expression levels ranging from ~15% to ~65% of CD3
+
CD56 + cells for CD158a and CD158b, respectively.
Although KIR-expressing CD8+ T cells exist in human
peripheral blood [38], the stimuli that regulate KIR
induction in T cells are poorly defined [39], and may
include demethylation events [40]. Interestingly, engagement of CD158b by MHC ligands on human CD8+ effector T cells hinders TCR signaling and limits T-cell
proliferation [41]. Based on our findings, it is tempting to
speculate that TG provided an in vitro signal orchestrating the expression of KIR on CIK cells. Conceivably, the
TG-driven expression of KIR might represent a feedback
signal to limit excessive CIK expansion and/or uncontrolled in vitro cell death. Although the nature of the signal(s) delivered to CIK cells through TG remains to be
identified, it is unlikely that cytokine stimuli such as IL15 are implicated, based on our observation that IL-15
provision to CIK cultures did not translate into any
further induction of KIR (Rutella S, unpublished observations, 2010). Our statement is also supported by a
Page 12 of 14
previous report demonstrating the inability of IL-15 and
IL-21 to induce KIR expression on cord blood-derived
NK progenitor cells [42].
NKG2D encodes for a lectin-related protein expressed
as a homodimer and functioning as an activating receptor for ligands often expressed by tumor cells, namely,
class I MHC-related molecules such as MICA, MICB,
and UL16-binding proteins [43]. The NKG2A/CD94
receptor contains C-type lectin ectodomains, binds to
HLA-E, a non-classical MHC protein important for viral
surveillance, and functions as an inhibitory receptor by
signaling through ITIM motifs [44,45]. As recently proposed, high surface levels of NKG2A/CD94 may be
required to avoid excessive NK cell-mediated killing of
HLA-E-bearing normal target cells [45]. Of interest,
CD94/NKG2A expression on CD8+ T cells may protect
from apoptosis and favor the eventual emergence of
memory T-cell responses [46]. In light of these findings,
it is conceivable that high levels of CD94/NKG2A and
KIR on TG-differentiated CIK cells promote cell survival, leading to protection from CIK-mediated killing of
normal cells.
NKp46 belongs to a family of activating natural cytotoxicity receptors (NCR) for tumor cells [47], also
including NKp30 and NKp44, that enables a precise
identification of all NK cells. Upon engagement by specific ligands, NCR induce a strong activation of NKmediated cytotoxicity, thus playing a pivotal role in
tumor cell killing [48]. To date, NCR have been detected
on NK cells in a restricted fashion and regardless of
NK-cell activation status. Notably, NKp46 was found on
~15-20% of CD3 + CIK cells differentiated with hi TG,
and lower expression levels of NKp46 correlated with
lower TG concentrations in the culture medium. These
data are backed by a recent study documenting a 1020% expression of NKp30, NKp44 and NKp46 on CIK
cells driven by IFN-g, OKT3 and IL-2 [32]. Overall,
these observations question the specificity of NCR for
cells of the NK lineage and suggest that NCR may also
contribute to the killing activity of CIK cells. When
evaluated for their ability to lyse tumor targets, CIK
effectors differentiated with TG were significantly more
effective at killing K562 cells compared with those nurtured with aCD3 mAb. It should be noted that patientderived CIK cells expressed lower levels of activating/
inhibitory NK receptors and manifested a reduced lytic
activity in vitro in 2 out of 4 cases. Although the very
small number of patients under study precludes any
sensible conclusion, it is likely that the generation of
fully functional CIK cells by TG was hindered by
immune suppressive circuits in patients with advanced
metastatic disease.
IL-12, a prototype member of a family of IL-12-related
cytokines that includes IL-23 and IL-27, is an instigator
Bonanno et al. Journal of Translational Medicine 2010, 8:129
/>
of Th1 immune responses and possesses in vivo antitumor activities [49]. IL-12 is a heterodimer formed by a
35-kDa light chain (known as p35 or IL-12a) and a 40kDa heavy chain (known as p40 or IL-12b). Messenger
RNA encoding IL-12p35 is present in many cell types,
whereas mRNA encoding IL-12p40 is restricted to cells
that produce the biologically active heterodimer [29].
Importantly, CIK cells generated with hi TG released
higher quantities of IL-12p40 compared with the other
culture conditions here established. This finding portends
favorable implications for the use of hiTG in the generation of CIK cells, given the established role of IL-12 in
the promotion of anti-tumor immunity [49].
In conclusion, we propose that TG is an attractive drug
to maximize the yield and anti-tumor potency of CIK cell
preparations. The expansion of immune effector cells in
response to a combination of IFN-g, TG and IL-2
occurred in the absence of a significant induction of Treg
cells, whose infusion into cancer-bearing patients would
be highly undesirable. From a clinical standpoint, CIK
cells are likely to be efficacious at disease stages where
the tumor burden is relatively low or in an adjuvant setting, rather than in advanced disease [10]. It is presently
unknown whether the overall survival rate is significantly
affected by this type of adoptive cellular therapy. Future
studies will have to address whether CIK cells differentiated with TG offer advantages over those obtained with
aCD3-based protocols and whether they may be integrated into current cancer treatments.
Acknowledgements
These studies were supported by a research grant from Fondazione Roma,
Rome, Italy (to S.R. and G.S.) and from Associazione Italiana per la Ricerca sul
Cancro (AIRC; grant #8556 to S.R.).
Author details
1
Department of Gynecology, Catholic University Med. School, Rome, Italy.
2
Department of Blood Transfusion and Cell Therapy, Azienda Ospedaliera “S.
Camillo-Forlanini”, Rome, Italy. 3Department of Experimental Medicine,
University Sapienza, Rome, Italy. 4Department of Hematology, Catholic
University Med. School, Rome, Italy. 5IRCCS San Raffaele Pisana, Rome, Italy.
Authors’ contributions
GB made substantial contributions to conception and design and carried
out the experiments; PI, AM, AP, AP and DF carried out the experiments; MC
helped with some of the flow cytometry experiments; AP and GS
contributed to study design and cared for the patients; LP contributed to
study conception and design; SR made substantial contributions to
conception and design, performed the experiments and the statistical
analysis, analyzed and interpreted data and wrote the paper. All authors
read and approved the final manuscript.
Competing interests
The authors declare that they have no competing interests.
Received: 31 July 2010 Accepted: 7 December 2010
Published: 7 December 2010
Page 13 of 14
References
1. Grimm EA, Mazumder A, Zhang HZ, Rosenberg SA: Lymphokine-activated
killer cell phenomenon. Lysis of natural killer-resistant fresh solid tumor
cells by interleukin 2-activated autologous human peripheral blood
lymphocytes. J Exp Med 1982, 155:1823-1841.
2. Phillips JH, Lanier LL: Dissection of the lymphokine-activated killer
phenomenon. Relative contribution of peripheral blood natural killer
cells and T lymphocytes to cytolysis. J Exp Med 1986, 164:814-825.
3. Introna M, Borleri G, Conti E, Franceschetti M, Barbui AM, Broady R,
Dander E, Gaipa G, D’Amico G, Biagi E, et al: Repeated infusions of donorderived cytokine-induced killer cells in patients relapsing after
allogeneic stem cell transplantation: a phase I study. Haematologica 2007,
92:952-959.
4. Schmidt-Wolf IG, Negrin RS, Kiem HP, Blume KG, Weissman IL: Use of a
SCID mouse/human lymphoma model to evaluate cytokine-induced
killer cells with potent antitumor cell activity. J Exp Med 1991,
174:139-149.
5. Mehta BA, Schmidt-Wolf IG, Weissman IL, Negrin RS: Two pathways of
exocytosis of cytoplasmic granule contents and target cell killing by
cytokine-induced CD3+CD56+ killer cells. Blood 1995, 86:3493-3499.
6. Verneris MR, Karami M, Baker J, Jayaswal A, Negrin RS: Role of NKG2D
signaling in the cytotoxicity of activated and expanded CD8+ T cells.
Blood 2004, 103:3065-3072.
7. Verneris MR, Ito M, Baker J, Arshi A, Negrin RS, Shizuru JA: Engineering
hematopoietic grafts: purified allogeneic hematopoietic stem cells plus
expanded CD8+ NK-T cells in the treatment of lymphoma. Biol Blood
Marrow Transplant 2001, 7:532-542.
8. Kim HM, Lim J, Kang JS, Park SK, Lee K, Kim JY, Kim YJ, Hong JT, Kim Y,
Han SB: Inhibition of human cervical carcinoma growth by cytokineinduced killer cells in nude mouse xenograft model. Int
Immunopharmacol 2009, 9:375-380.
9. Sweeney TJ, Mailander V, Tucker AA, Olomu AB, Zhang W, Cao Y,
Negrin RS, Contag CH: Visualizing the kinetics of tumor-cell clearance in
living animals. Proc Natl Acad Sci USA 1999, 96:12044-12049.
10. Hontscha C, Borck Y, Zhou H, Messmer D, Schmidt-Wolf IG: Clinical trials
on CIK cells: first report of the international registry on CIK cells (IRCC). J
Cancer Res Clin Oncol 2010.
11. Leemhuis T, Wells S, Scheffold C, Edinger M, Negrin RS: A phase I trial of
autologous cytokine-induced killer cells for the treatment of relapsed
Hodgkin disease and non-Hodgkin lymphoma. Biol Blood Marrow
Transplant 2005, 11:181-187.
12. Olioso P, Giancola R, Di Riti M, Contento A, Accorsi P, Iacone A:
Immunotherapy with cytokine induced killer cells in solid and
hematopoietic tumours: a pilot clinical trial. Hematol Oncol 2009,
27:130-139.
13. Deeks ED, Keating GM: Rabbit antithymocyte globulin (thymoglobulin): a
review of its use in the prevention and treatment of acute renal
allograft rejection. Drugs 2009, 69:1483-1512.
14. Myint AA, Malkovska V, Morgan S, Luckit J, Wonke B, Gordon-Smith EC:
Antilymphocyte globulin therapy enhances impaired function of natural
killer cells and lymphokine activated killer cells in aplastic anaemia. Br J
Haematol 1990, 75:578-584.
15. Rutella S, Pierelli L, Bonanno G, Sica S, Ameglio F, Capoluongo E, Mariotti A,
Scambia G, d’Onofrio G, Leone G: Role for granulocyte colony-stimulating
factor in the generation of human T regulatory type 1 cells. Blood 2002,
100:2562-2571.
16. Rutella S, Pierelli L, Bonanno G, Mariotti A, Sica S, Sora F, Chiusolo P,
Scambia G, Rumi C, Leone G: Immune reconstitution after autologous
peripheral blood progenitor cell transplantation: effect of interleukin-15
on T-cell survival and effector functions. Exp Hematol 2001, 29:1503-1516.
17. Rutella S, Bonanno G, Procoli A, Mariotti A, de Ritis DG, Curti A, Danese S,
Pessina G, Pandolfi S, Natoni F, et al: Hepatocyte growth factor favors
monocyte differentiation into regulatory interleukin (IL)-10++IL-12low/neg
accessory cells with dendritic-cell features. Blood 2006, 108:218-227.
18. Cholujova D, Jakubikova J, Kubes M, Arendacka B, Sapak M, Ihnatko R,
Sedlak J: Comparative study of four fluorescent probes for evaluation of
natural killer cell cytotoxicity assays. Immunobiology 2008, 213:629-640.
19. Rutella S, Bonanno G, Marone M, De Ritis D, Mariotti A, Voso MT,
Scambia G, Mancuso S, Leone G, Pierelli L: Identification of a novel
subpopulation of human cord blood CD34-CD133-CD7-CD45+lineage-
Bonanno et al. Journal of Translational Medicine 2010, 8:129
/>
20.
21.
22.
23.
24.
25.
26.
27.
28.
29.
30.
31.
32.
33.
34.
35.
36.
37.
38.
39.
cells capable of lymphoid/NK cell differentiation after in vitro exposure
to IL-15. J Immunol 2003, 171:2977-2988.
Lecoeur H, de Oliveira-Pinto LM, Gougeon ML: Multiparametric flow
cytometric analysis of biochemical and functional events associated
with apoptosis and oncosis using the 7-aminoactinomycin D assay. J
Immunol Methods 2002, 265:81-96.
Kim GG, Donnenberg VS, Donnenberg AD, Gooding W, Whiteside TL: A
novel multiparametric flow cytometry-based cytotoxicity assay
simultaneously immunophenotypes effector cells: comparisons to a 4 h
51
Cr-release assay. J Immunol Methods 2007, 325:51-66.
Bonanno G, Procoli A, Mariotti A, Corallo M, Perillo A, Danese S, De
Cristofaro R, Scambia G, Rutella S: Effects of pegylated G-CSF on immune
cell number and function in patients with gynecological malignancies. J
Transl Med 2010, 8:114.
Liu Z, Fang Y, Wang X, Wang P, Yun P, Xu H: Upregulation of molecules
associated with T-regulatory function by thymoglobulin pretreatment of
human CD4+ cells. Transplantation 2008, 86:1419-1426.
Malek TR, Bayer AL: Tolerance, not immunity, crucially depends on IL-2.
Nat Rev Immunol 2004, 4:665-674.
Ahmadzadeh M, Rosenberg SA: IL-2 administration increases CD4
+
CD25hiFoxp3+ regulatory T cells in cancer patients. Blood 2006,
107:2409-2414.
Wei S, Kryczek I, Edwards RP, Zou L, Szeliga W, Banerjee M, Cost M,
Cheng P, Chang A, Redman B, et al: Interleukin-2 administration alters the
CD4+FoxP3+ T-cell pool and tumor trafficking in patients with ovarian
carcinoma. Cancer Res 2007, 67:7487-7494.
Linn YC, Hui KM: Cytokine-induced NK-like T cells: from bench to
bedside. J Biomed Biotechnol 2010.
Ayello J, van de Ven C, Cairo E, Hochberg J, Baxi L, Satwani P, Cairo MS:
Characterization of natural killer and natural killer-like T cells derived
from ex vivo expanded and activated cord blood mononuclear cells:
implications for adoptive cellular immunotherapy. Exp Hematol 2009,
37:1216-1229.
D’Andrea A, Rengaraju M, Valiante NM, Chehimi J, Kubin M, Aste M,
Chan SH, Kobayashi M, Young D, Nickbarg E, et al: Production of natural
killer cell stimulatory factor (interleukin 12) by peripheral blood
mononuclear cells. J Exp Med 1992, 176:1387-1398.
Beyer M, Schultze JL: Regulatory T cells in cancer. Blood 2006, 108:804-811.
Dunne J, Lynch S, O’Farrelly C, Todryk S, Hegarty JE, Feighery C, Doherty DG:
Selective expansion and partial activation of human NK cells and NK
receptor-positive T cells by IL-2 and IL-15. J Immunol 2001, 167:3129-3138.
Franceschetti M, Pievani A, Borleri G, Vago L, Fleischhauer K, Golay J,
Introna M: Cytokine-induced killer cells are terminally differentiated
activated CD8 cytotoxic T-EMRA lymphocytes. Exp Hematol 2009,
37:616-628, e612.
Lu PH, Negrin RS: A novel population of expanded human CD3+CD56+
cells derived from T cells with potent in vivo antitumor activity in mice
with severe combined immunodeficiency. J Immunol 1994,
153:1687-1696.
Hoyle C, Bangs CD, Chang P, Kamel O, Mehta B, Negrin RS: Expansion of
Philadelphia chromosome-negative CD3+CD56+ cytotoxic cells from
chronic myeloid leukemia patients: in vitro and in vivo efficacy in severe
combined immunodeficiency disease mice. Blood 1998, 92:3318-3327.
Dalle JH, Dardari R, Menezes J, Cordeiro P, Champagne MA, Duval M:
Binding of thymoglobulin to natural killer cells leads to cell activation
and interferon-γ production. Transplantation 2009, 87:473-481.
Penack O, Fischer L, Gentilini C, Nogai A, Muessig A, Rieger K, Ganepola S,
Thiel E, Uharek L: The type of ATG matters – natural killer cells are
influenced differentially by Thymoglobulin, Lymphoglobulin and ATGFresenius. Transpl Immunol 2007, 18:85-87.
Makrigiannis AP, Anderson SK: Regulation of natural killer cell function.
Cancer Biol Ther 2003, 2:610-616.
Mingari MC, Schiavetti F, Ponte M, Vitale C, Maggi E, Romagnani S,
Demarest J, Pantaleo G, Fauci AS, Moretta L: Human CD8+ T lymphocyte
subsets that express HLA class I-specific inhibitory receptors represent
oligoclonally or monoclonally expanded cell populations. Proc Natl Acad
Sci USA 1996, 93:12433-12438.
Vely F, Peyrat M, Couedel C, Morcet J, Halary F, Davodeau F, Romagne F,
Scotet E, Saulquin X, Houssaint E, et al: Regulation of inhibitory and
activating killer-cell Ig-like receptor expression occurs in T cells after
termination of TCR rearrangements. J Immunol 2001, 166:2487-2494.
Page 14 of 14
40. Li G, Yu M, Weyand CM, Goronzy JJ: Epigenetic regulation of killer
immunoglobulin-like receptor expression in T cells. Blood 2009,
114:3422-3430.
41. Arlettaz L, Degermann S, De Rham C, Roosnek E, Huard B: Expression of
inhibitory KIR is confined to CD8+ effector T cells and limits their
proliferative capacity. Eur J Immunol 2004, 34:3413-3422.
42. Bonanno G, Mariotti A, Procoli A, Corallo M, Scambia G, Pierelli L, Rutella S:
Interleukin-21 induces the differentiation of human umbilical cord blood
CD34-lineage- cells into pseudomature lytic NK cells. BMC Immunology
2009, 10:46.
43. Eagle RA, Trowsdale J: Promiscuity and the single receptor: NKG2D. Nat
Rev Immunol 2007, 7:737-744.
44. Kaiser BK, Pizarro JC, Kerns J, Strong RK: Structural basis for NKG2A/CD94
recognition of HLA-E. Proc Natl Acad Sci USA 2008, 105:6696-6701.
45. Borrego F, Masilamani M, Kabat J, Sanni TB, Coligan JE: The cell biology of
the human natural killer cell CD94/NKG2A inhibitory receptor. Mol
Immunol 2005, 42:485-488.
46. Gunturi A, Berg RE, Forman J: The role of CD94/NKG2 in innate and
adaptive immunity. Immunol Res 2004, 30:29-34.
47. Vitale M, Bottino C, Sivori S, Sanseverino L, Castriconi R, Marcenaro E,
Augugliaro R, Moretta L, Moretta A: NKp44, a novel triggering surface
molecule specifically expressed by activated natural killer cells, is
involved in non-major histocompatibility complex-restricted tumor cell
lysis. J Exp Med 1998, 187:2065-2072.
48. Moretta L, Moretta A: Unravelling natural killer cell function: triggering
and inhibitory human NK receptors. EMBO J 2004, 23:255-259.
49. Trinchieri G, Pflanz S, Kastelein RA: The IL-12 family of heterodimeric
cytokines: new players in the regulation of T cell responses. Immunity
2003, 19:641-644.
doi:10.1186/1479-5876-8-129
Cite this article as: Bonanno et al.: Thymoglobulin, interferon-g and
interleukin-2 efficiently expand cytokine-induced killer (CIK) cells in
clinical-grade cultures. Journal of Translational Medicine 2010 8:129.
Submit your next manuscript to BioMed Central
and take full advantage of:
• Convenient online submission
• Thorough peer review
• No space constraints or color figure charges
• Immediate publication on acceptance
• Inclusion in PubMed, CAS, Scopus and Google Scholar
• Research which is freely available for redistribution
Submit your manuscript at
www.biomedcentral.com/submit