Biology of Marine Birds - Chapter 11 pot
Bạn đang xem bản rút gọn của tài liệu. Xem và tải ngay bản đầy đủ của tài liệu tại đây (586.29 KB, 50 trang )
359
Energetics of Free-Ranging
Seabirds
Hugh I. Ellis and Geir W. Gabrielsen
CONTENTS
11.1 Introduction 360
11.2 Basal Metabolic Rate in Seabirds 360
11.2.1 Methods and Errors in Metabolic Measurements 361
11.2.2 Allometry of BMR 364
11.2.3 Anticipated Correlates of BMR 371
11.2.4 Unusual Correlates of BMR 371
11.2.5 Long-Term Fasting Metabolism 373
11.3 Seabird Thermoregulation 373
11.3.1 Thermal Conductance 374
11.3.2 Lower Limit of Thermoneutrality 377
11.3.3 Body Temperature 378
11.4 Other Costs 379
11.4.1 Digestion 379
11.4.2 Molt 379
11.4.3 Locomotion 380
11.4.3.1 Swimming 381
11.4.3.2 Walking 383
11.5 Daily Energy Expenditure and Field Metabolic Rate in Seabirds 383
11.5.1 Types of DEE Measurements 383
11.5.1.1 BMR Multiples and Mass Loss 384
11.5.1.2 Heart Rate 384
11.5.1.3 Existence Metabolism and Metabolizable Energy 385
11.5.1.4 FMR and DEE 385
11.5.2 Field Metabolic Rate 385
11.5.2.1 Conditions and Errors in FMR Studies 386
11.5.2.2 Allometry of FMR 387
11.5.2.3 FMR/BMR Ratios 388
11.5.2.4 Correlates and Influences on FMR 391
11.5.2.5 Partitioning FMR 392
11.6 Community Energetics 393
11.7 Speculations and Future Research Directions 394
Acknowledgments 395
Literature Cited 395
11
© 2002 by CRC Press LLC
360 Biology of Marine Birds
11.1 INTRODUCTION
Nearly 30 years ago, Calder and King (1974), noting that metabolic rates on 38 species of passerine
and 34 species of nonpasserine birds had been measured since 1950 and recognizing the predictive
power of allometric equations, asked whether it was better to add more birds to the list or to ask
new questions. Of course, both happened. In fact, adding more species to the list in part led to new
questions. Among these developments has been the ability to look at groups of birds in terms of
both their phylogeny and their ecology. One such approach has been to single out seabirds as an
ecological group (Ellis 1984, Nagy 1987). In the more than 15 years since a comprehensive review
of seabird energetics has appeared (Ellis 1984), the information on basal metabolic rates (BMR) in
this group has doubled and the reports on field metabolic rates (FMR, using doubly labeled water)
have more than tripled. New analyses using both of these measurements have appeared during that
time. It is the goal of this chapter to summarize our current knowledge of seabird energetics, provide
a comprehensive review of BMR and FMR measurements, and examine many correlates of both.
The relationships of BMR with color and activity pattern (Ellis 1984) need no further development.
However, unlike the earlier review, we treat thermoregulation and provide information on thermal
conductance and lower critical limits of thermoneutrality. For a comprehensive treatment of avian
thermoregulation, refer to Dawson and Whittow (2000). Lustick (1984) remains the best source on
seabird thermoregulation generally. Ellis (1984) demonstrated a latitudinal gradient for BMR in
Charadriiformes. We reevaluate that gradient and consider whether such an analysis can be extended
outside that order. We examine a variety of metabolic costs, including locomotion, and survey
information on community energetics, critiquing old models and suggesting new ones.
In this chapter, we limit ourselves mainly to adults in the four orders of seabirds: Sphenisci-
formes, Procellariiformes, Pelecaniformes, and Charadriiformes. Where feasible, we also include
available information on sea ducks (Anseriformes). References to shorebirds or other birds are
made only when necessary. But because the energetics of seabird migration is so poorly known,
we direct the reader to those publications, relevant for shorebirds, which may provide useful insights
(e.g., Alerstam and Hedenström 1998).
11.2 BASAL METABOLIC RATE IN SEABIRDS
Basal metabolic rate is a unique parameter (McNab 1997). It represents a limit, the minimal rate of
energy expenditure in an endotherm under prescribed conditions (see below) and otherwise subject
only to variations in time of day or season. Because it is replicable under those conditions, comparisons
across a variety of species are possible. McNab (1997) cites seven conditions for BMR, some of
which we view as too restrictive. We believe that BMR should be defined as the rate found in a
thermoregulating, postabsorptive, adult animal at rest in its thermoneutral zone. This is fairly close
to the definition given by Bligh and Johnson (1973), except that it does not demand measurement in
the dark (although in actual practice it is typically measured in the dark or in dim light), and, like
McNab (1997), requires the measurement be of adults to remove potential costs of growth. However,
we believe that BMR is a statistic, not a constant because of circadian and seasonal effects. For
example, Aschoff and Pohl (1970) demonstrated that for many birds that period of activity affects
BMR; namely, BMR may be lower in the inactive (ρ) period and higher in the active (α) period.
BMR may also change with season as found for a gull (Davydov 1972), sea duck (Jenssen et al.
1989, Gabrielsen et al. 1991a), and shorebird (Piersma et al. 1995); this is also known in terrestrial
birds (Gavrilov 1985) and mammals (Fuglei and Ørietsland 1999). Fyhn et al. (2001) have even shown
in Black-legged Kittiwakes (Rissa tridactyla) that BMR may change from one stage of the breeding
season to another (although different individuals were used in the two periods chosen). Consequently,
it is essential to note the circumstances under which BMR was measured (i.e., time of day, season)
in addition to the complete experimental protocols urged by McNab (1997). The repeatability of BMR
measurements within individuals, sometimes assumed by researchers, has now been demonstrated in
Black-legged Kittiwakes over relatively long periods of time (1 year; Bech et al. 1999).
© 2002 by CRC Press LLC
Energetics of Free-Ranging Seabirds 361
There are areas where there is contention over whether measured metabolic rates can be
considered basal. McNab (1997) warns against the measurement of endotherms in a reproductive
condition; he includes incubating birds. Indeed, King (1973) and Walsberg and King (1978) report
incubation metabolic rates (IMR) above BMR, although there may be no appreciable differences
between IMR and BMR in other species (cf. Williams 1996). Values for IMR in seabirds are reported
in this volume by Whittow (see Chapter 12), who discusses this problem. Whereas the effect of
incubation on metabolism is varied, changes in body composition (e.g., liver mass) during chick-
rearing can affect metabolic rate (Langseth et al. 2000). In fact, changes in body composition in a
variety of contexts, such as migration (Weber and Piersma 1996), can affect metabolic rate. We
are undecided on whether these metabolic rates should be considered BMR. Although body com-
position may change during long-term fasting, metabolic rate may drop in Phase I of the fast before
those changes become apparent; Cherel et al. (1988) consider this to be a change in BMR. Long-
term fasting is further discussed in Section 11.2.5 below. Is metabolism during sleep BMR? Most
metabolic experiments are done in the dark or in dim light, but the bird is thought to be awake.
That often is not verifiable. However, Stahel et al. (1984) argue that for Blue Penguins (Eudyptula
minor) the reduction in BMR (≤8%) due to sleep is minor.
The literature has many measurements reported as SMR (standard metabolic rate) or RMR
(resting metabolic rate). Generally, SMR in endotherms can be considered equivalent to BMR.
That is not necessarily the case with RMR. Resting rates may not be measured in the zone of
thermoneutrality nor on birds that are postabsorptive. The RMR reported for Common (Uria aalge)
and Thick-billed Murres (U. lomvia) were measured under the conditions specified for BMR (Croll
and McLaren 1993). On the other hand, insufficient information exists to draw that conclusion in
the case of Tufted Ducks (Aythya fuligula; Woakes and Butler 1983) used in comparisons with
seabirds in Section 11.4.3.1 below. In fact, the ducks’ RMRs were measured in water; in most
cases RMR of a floating bird is higher than BMR (Prange and Schmidt-Nielsen 1970, Hui 1988a,
Luna-Jorquera and Culik 2000, H. Ellis unpublished, in Eared Grebes, Podiceps nigricollis). Similar
problems are reported in penguins by Culik and Wilson (1991a).
The use of BMR and other physiological parameters has recently come under scrutiny by those
who argue that phylogenetic relationships must be considered in all such comparisons, especially
across broad taxonomic groups (Garland and Carter 1994, Reynolds and Lee 1996). However, this
presumes knowledge of phylogenetic relationships that may be unknown or disputed, and it is not
without its detractors (Mangum and Hochachka 1998). In this paper, we have chosen to provide
metabolic data in a straightforward manner. However, there are differences among the orders; for
example, sphenisciform birds have generally a lower BMR (see Section 11.2.2).
Our allometric equations below are given both for seabirds as a group and for each of the four
orders of seabirds. It is our intention to provide as much information as possible, but we recommend
that workers interested in making seabird comparisons use the all-seabird equation unless they have
specific reasons for doing otherwise. Other, more serious problems affect the validity of the data
themselves. These occur during both the measurement of metabolism and the conversion of units
in metabolic studies and are discussed below.
11.2.1 M
ETHODS AND
E
RRORS IN
M
ETABOLIC
M
EASUREMENTS
Direct and indirect calorimetry are the two main methods used to determine BMR in birds. The
origins of both go back to Lavoisier; they are compared in Brody (1945). The indirect method has
been used in most metabolic studies, including all those cited in this chapter. It is based on
determinations of the quantities of oxygen consumed or carbon dioxide produced or food assimi-
lated. In fact, for reasons discussed in most introductory physiology texts, oxygen consumption is
the primary means by which such information is obtained.
Two methods have been used to measure oxygen consumption in animals: closed- and open-
circuit respirometry. In open-circuit respirometry, a constant flow of air goes to an animal and then
© 2002 by CRC Press LLC
362 Biology of Marine Birds
to some analytical device. In closed-circuit respirometry, gas pressure is measured as it decreases
due to the consumption of oxygen; carbon dioxide production does not compensate for such
reductions because it is absorbed by some chemical (NaOH, Ascarite
®
, soda lime, etc.). Although
not essential, closed-circuit respirometry often reduces metabolic chamber size to increase the
pressure change signal. These experiments typically have shorter equilibration times and are of
shorter duration than open-circuit experiments. All of these introduce sources of error likely to
raise metabolic rate. We think that is likely to be the case for the study by Ricklefs and White
(1981) on Sooty Terns (Sterna fuscata). This study is cited in Table 11.1, which compares data
collected in open circuitry with those collected in closed circuitry for the same species but in
different studies.
An opposite problem that may occur in closed-circuit respirometry is an apparently reduced
metabolic rate due to a buildup of carbon dioxide. This would occur if the CO
2
absorbent failed,
was depleted, or was ineffective (this last may occur because, unlike open systems where the
absorbent is in columns through which the air passes, in closed systems it is often on the bottom of
the chamber providing limited surface area). This may have occurred in the studies by Cairns et al.
(1990) on the Common Murre and Birt-Friesen et al. (1989) on the Northern Gannet (Morus
bassana), as shown in Table 11.1. Not only may the buildup of CO
2
reduce apparent metabolic rate
by giving false readings of pressure changes in a closed system, but it may, in extreme cases, actually
reduce the metabolic rate of a bird directly. The situation is complicated in the Northern Gannets
because while the closed system of Birt-Friesen et al. (1989) may have allowed a buildup of CO
2
,
the experiment by Bryant and Furness (1995) actually did result in CO
2
levels as high as 2.8%.
Although we tend to trust open-circuit respirometry over closed-circuit respirometry when the
results are as different as they often are in Table 11.1, we recognize that other errors may make
the results of open systems suspect. The study by Kooyman et al. (1976) on Adélie Penguins
(Pygoscelis adeliae) probably gives an inflated value for BMR because the birds were restrained.
This practice, almost entirely abandoned today, may be necessary in unusual cases; but its conse-
quences are likely to compromise results.
Another problem that can create problems for open- as well as closed-circuit respirometry
involves the respiratory quotient. Respiratory quotient (RQ) is the ratio of the volume of CO
2
produced to the volume of O
2
consumed. It varies with the food substrate being metabolized by
the subject. A carbohydrate diet yields an RQ of 1.0; a diet based on lipids yields an RQ of 0.71;
protein substrates (Elliott and Davison 1975) and mixed substrates are intermediate (Schmidt-
Nielsen 1990). An animal that is postabsorptive, a condition of BMR, would typically be
sustaining itself on stored fat. Consequently, RQs measured during studies of BMR should be
around 0.71. In fact, reported RQs measured in fasting birds, usually during metabolic experi-
ments, show values at or close to 0.71 (King 1957, Drent and Stonehouse 1971). This is equally
true for seabirds (Pettit et al. 1985, Gabrielsen et al. 1988, Chappell et al. 1989). Higher values
suggest that birds were not postabsorptive or that CO
2
built up during the experiment. This may
be illustrated by Iversen and Krog (1972) whose open-circuit BMR for Leach’s Storm-petrels
(Oceanodroma leucorhoa) is about 30% higher than was found in two closed-circuit studies
(Table 11.1). Iversen and Krog did not remove CO
2
before measuring oxygen and reported RQ
= 0.83. The buildup of CO
2
explains the high RQ, although not the high BMR. That high value
may be a function of the very small (0.5 L) chamber used. Small chambers, often used in closed
systems (see above) may cause inflated levels of oxygen consumption (H. Ellis unpublished).
Here, we prefer the comparable closed-circuit experiments which used much larger chambers.
A high RQ may also reflect a nonpostabsorptive condition.
Open and closed systems, when used with care, can give similar results. The nearly identical
results coming from the independent studies on Southern Giant Fulmars (Macronectes giganteus)
by Ricklefs and Matthew (1983) using a closed system and Morgan et al. (1992) using an open
one underscore that (see Table 11.1). Overall, while we recognize that a closed system is sometimes
© 2002 by CRC Press LLC
Energetics of Free-Ranging Seabirds 363
TABLE 11.1
Open- vs. Closed-Circuit Respirometry in Independent Studies
Species N
a
Mass
b
BMR: Open
c
BMR: Closed
c
% Open Reference
Sooty Tern (Sterna fuscata) 4 150.4 ± 13.0 0.97 ± 0.14 — — MacMillen et al. 1977
5 156.6 ± 8.4 0.93 ± 0.14 — — Ellis, Pettit, and Whittow unpublished in 1982
4 170.4 — 1.75 80.4 Ricklefs and White 1981
Common Murre (Uria aalge) 11 913 ± 53 1.20 ± 0.03 — — Gabrielsen 1996
3 972 ± 24 — 0.77 ± 0.15 –35.8 Cairns et al. 1990
Northern Gannet (Morus bassana) 4 2574 ± 289 0.89 ± 0.16 — — Bryant and Furness 1995
4 3030 ± 140 — 0.48 ± 0.10 –46.1 Birt-Friesen et al. 1989
Southern Giant Fulmar (Macronectes giganteus) 6 3929 0.92 — — Morgan et al. 1992
8 3460 — 0.89 –3.3 Ricklefs and Matthew 1983
Leach’s Storm-petrel (Oceanodroma leucorhoa) 2 42 2.77
d
— — Iversen and Krog 1972
4 47 — 1.92 ± 0.37 –30.7 Ricklefs et al. 1986
7 46.6 — 2.02 ± 1.01 –27.1 Montevecchi et al. 1992
Adélie Penguin (Pygoscelis adeliae) 13 3970 1.20
e
— — Kooyman et al. 1976
8 3500 ± 60 — 0.92 ± 0.06 –23.3 Ricklefs and Matthew 1983
a
Number of experimental birds.
b
Mass in g.
c
mL O
2
g
–1
h
–1
.
d
RQ = 0.83.
e
Restrained animals.
© 2002 by CRC Press LLC
364 Biology of Marine Birds
the only practical method under often difficult field conditions, and that it can give reliable results,
we think caution should be exercised in choosing it when both options are available (Figure 11.1).
The conversion of metabolic data from units actually measured (typically oxygen consumption)
to derivative units of energy (kJ, W, or previously kcal), invariably used in allometric studies
(Lasiewski and Dawson 1967, Aschoff and Pohl 1970, Ellis 1984), may also be a source of error.
The conversion of oxygen consumption to energy is a function of RQ, for which caloric equivalents
of oxygen are provided by Bartholomew (1982). Scattered throughout the metabolic literature is
the equivalency of 20.8 kJ/L O
2
. This is based on an RQ of 0.79. The more reasonable RQ of 0.71
for a postabsorptive bird gives an equivalency of 19.8 kJ/L O
2
. So a common misunderstanding of
RQ introduces a 5% overestimate in many metabolic papers. We suggest that authors provide
measured data (e.g., mL O
2
h
–1
) or conversion factors used.
Other problems may affect the data base for seabirds. For instance, it is possible that some values
presented in this chapter do not represent true values of BMR because they were not measured within
the thermoneutral zone (TNZ, that range of environmental temperatures across which resting metabolic
rates are lowest and independent of temperature). McNab (1997) provides examples of this. We have
found far fewer data in the seabird literature on thermal conductance and lower limits of thermoneutrality
than BMR. This suggests that full metabolic profiles may not always have been done and that the actual
TNZ may not always have been known (e.g., Roby and Ricklefs 1986, Bryant and Furness 1995).
Not all differences in BMR can be attributed to obvious sources of error, however. The BMR
of Blue Penguins (Eudyptula minor) reported by Stahel and Nicol (1982) is 69% higher than the
value reported by Baudinette et al. (1986). We cannot explain this difference but it can have
implications beyond the BMR value itself, as noted in Section 11.4.2 below. Table 11.2 includes
all the measurements of BMR we found in the literature.
11.2.2 ALLOMETRY OF BMR
King and Farner (1961) reviewed previous allometric analyses and provided the best equation then
possible. But they noted an incongruity between small birds and those exceeding 125 g. In 1967,
Lasiewski and Dawson argued that passerines and nonpasserines required separate allometric
analyses. Their nonpasserine equation is given below:
BMR = 327.8 m
0.723
(11.1)
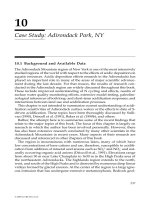
FIGURE 11.1 Conducting physiological studies under field conditions is often difficult: catching and con-
fining the animal, working without electricity, dealing with weather conditions. All of these can add error to
measurements. (Photo by R. W. and E. A. Schreiber.)
© 2002 by CRC Press LLC
Energetics of Free-Ranging Seabirds 365
TABLE 11.2
Body Mass, Basal Metabolic Rates (BMR; in kJ d
–1
and kJ g
–1
h
–1
), and Breeding Region in Seabirds
Order/Species
Body
Mass
(g)
BMR Latitude/
Region
(degree)n (kJ d
–1
) (kJ g
–1
h
–1
) Source
Sphenisciformes
Adelie Penguin
Pygoscelis adeliae
3970 14 1060 0.0111 64 S Kooyman et al. 1976
Adelie Penguin
P. adeliae
3500 8 1552 0.0185 64 S Ricklefs and Matthew 1983
Emperor Penguin
Aptenodytes forsteri
23370 5 3704 0.0066 78 S Pinshow et al. 1976
Emperor Penguin
A. forsteri
24800 11 4239 0.0071 46 S Le Maho et al. 1976
Fjordland Penguin
Eudyptes pachyrhynchus
2600 4 599 0.0096 40 S In Drent and Stonehouse 1971
B. Stonehouse unpublished
Yellow-eyed Penguin
Megadyptes antipodes
4800 1 996 0.0086 40 S In Drent and Stonehouse 1971
B. Stonehouse unpublished
Humboldt Penguin
Spheniscus humboldti
3870 3 821 0.0088 49 N Drent and Stonehouse 1971
Blue Penguin
Eudyptula minor
900 6 384 0.0178 42 S Stahel and Nicol 1982
Blue Penguin
E. minor
1106 8 298 0.0112 36 S Baudinette et al. 1986
Blue Penguin
E. minor
1082 14 308 0.0119 42 S Stahel and Nicol 1988
Procellariiformes
Wandering Albatross
Diomedea exulans
8130 4 1755 0.0090 47 S Adams and Brown 1984
Laysan Albatross
Phoebastria immutabilis
3103 5 637 0.0086 24 N Grant and Whittow 1983
Grey-headed Albatross
Thalassarche chrysostoma
3753 3 735 0.0082 47 S Adams and Brown 1984
Sooty Albatross
Phoebetria fusca
2875 4 715 0.0104 47 S Adams and Brown 1984
Southern Giant Petrel
M. giganteus
3460 8 1466 0.0177 64 S Ricklefs and Matthew 1983
Southern Giant Petrel
M. giganteus
4780 6 1154 0.0101 47 S Adams and Brown 1984
Southern Giant Petrel
Macronectes giganteus
3929 6 1735 0.0184 64 S Morgan et al. 1992
Southern Fulmar
Fulmarus glacialoides
780 5 437 0.0233 69 S Weathers et al. 2000
Northern Fulmar
F. glacialis
651 16 314 0.0201 79 N Gabrielsen et al. 1988
Northern Fulmar
F. glacialis
728 4 330 0.0189 56 N Bryant and Furness 1995
Antarctic Petrel
Thalassoica antarctica
718 6 408 0.0237 69 S Weathers et al. 2000
Cape Pigeon
Daption capense
420 7 317 0.0314 69 S Weathers et al. 2000
Snow Petrel
Pagodroma nivea
292 6 199 0.0284 69 S Weathers et al. 2000
© 2002 by CRC Press LLC
366 Biology of Marine Birds
Kerguelen Petrel
Leugensa brevirostris
315 2 153 0.0202 47 S Adams and Brown 1984
Soft-plumaged Petrel
Pterodroma mollis
274 2 151 0.0230 47 S Adams and Brown 1984
Bonin Petrel
Pterodroma hypoleuca
180 2 89 0.0206 24 N Grant and Whittow 1983
Bonin Petrel
P. hypoleuca
167 7 72 0.0181 24 N Pettit et al. 1985
Salvin’s Prion
Pachyptila salvini
165 3 134 0.0338 47 S Adams and Brown 1984
Bulwer’s Petrel
Bulweria bulwerii
87 6 44 0.0211 24 N Pettit et al. 1985
White-chinned Petrel
Procellaria aequinoctialis
1287 3 545 0.0176 47 S Adams and Brown 1984
Grey Petrel
P. cinerea
1014 2 433 0.0178 47 S Adams and Brown 1984
Wedge-tailed Shearwater
Puffinus pacificus
332 18 121 0.0152 24 N Pettit et al. 1985
Sooty Shearwater
P. griseus
740 3 249 0.0140 37 N Krasnow 1979
Christmas Shearwater
P. nativitatis
308 6 127 0.0172 24 N Pettit et al. 1985
Manx Shearwater
P. puffinus
413 10 195 0.0197 62 N Bech et al. 1982
Manx Shearwater
P. puffinus
367 4 201 0.0228 57 N Bryant and Furness 1995
Georgian Diving-petrel
Pelecanoides georgicus
127 2 85 0.0279 47 S Adams and Brown 1984
Georgian Diving-petrel
P. georgicus
119 5 122 0.0427 54 S Roby and Ricklefs 1986
Common Diving-petrel
P. urinatrix
132 4 126 0.0398 54 S Roby and Ricklefs 1986
Wilson’s Storm-petrel
Oceanites oceanicus
42 9 37 0.0367 64 S Obst et al. 1987
Wilson’s Storm-petrel
O. oceanicus
34 6 35 0.0429 64 S Morgan et al. 1992
Leach’s Storm-petrel
Oceanodroma leucorhoa
47 7 45 0.0399 47 N Montevecchi et al. 1991
Leach’s Storm-petrel
O. leucorhoa
45 4 43 0.0402 45 N Ricklefs et al. 1986
Leach’s Storm-petrel
O. leucorhoa
44 6 59 0.0565 48 N Ricklefs et al. 1980
Leach’s Storm-petrel
O. leucorhoa
42 2 55 0.0548 54 N Iversen and Krog 1972
Fork-tailed Storm-petrel
O. furcata
49 16 56 0.0476 54 N Iversen and Krog 1972
Fork-tailed Storm-petrel
O. furcata
45 1 39 0.0361 59 N Vleck and Kenagy 1980
TABLE 11.2 (Continued)
Body Mass, Basal Metabolic Rates (BMR; in kJ d
–1
and kJ g
–1
h
–1
), and Breeding Region in Seabirds
Order/Species
Body
Mass
(g)
BMR Latitude/
Region
(degree)n (kJ d
–1
) (kJ g
–1
h
–1
) Source
© 2002 by CRC Press LLC
Energetics of Free-Ranging Seabirds 367
Pelecaniformes
Red-tailed Tropicbird
Phaethon rubricauda
593 5 288 0.0202 24 N Pettit et al. 1985
Australian Pelican
Pelecanus conspicillatus
5090 1 1566 0.0128 41 N Benedict and Fox 1927
Brown Pelican
P. occidentalis
3510 1 1105 0.0131 41 N Benedict and Fox 1927
Brown Pelican
P. occidentalis
3038 3 896 0.0123 29 N H. Ellis and W. Hennemann
unpublished data
Magnificent Frigatebird
Fregata magnifiscens
1078 4 240 0.0093 9 N Enger 1957
Cape Gannet
Morus capensis
2660 5 856 0.0134 32 S Adams et al. 1991
Northern Gannet
M. bassanus
3030 4 701 0.0096 47 N Birt-Friesen et al. 1989
Northern Gannet
M. bassanus
2574 4 1079 0.0175 55 N Bryant and Furness 1995
Masked Booby
Sula dactylatra
1289 1 476 0.0154 28 N H. Ellis unpublished data
Red-footed Booby
S. sula
1017 8 376 0.0154 21 N Ellis et al. 1982a
Double-crested Cormorant
Hypoleucos auritus
1330 5 537 0.0168 28 N Hennemann 1983a
Great Cormorant
Phalacrocorax carbo
1950 3 721 0.0154 35 N Sato et al. 1988
Imperial Shag
Notocarbo atriceps
2660 6 1317 0.0206 64 S Ricklefs and Matthew 1983
European Shag
Stictocarbo arstotelis
1619 4 739 0.0190 56 N Bryant and Furness 1995
Charadriiformes
Parasitic Jaeger
Stercorarius parasiticus
351 4 199 0.0236 60 N Bryant and Furness 1995
Great Skua
S. skua
970 1 410 0.0176 41 N Benedict and Fox 1927
Great Skua
S. skua
1159 4 538 0.0193 60 N Bryant and Furness 1995
South Polar Skua
Catharcta maccormicki
1130 9 705 0.0260 64 S Ricklefs and Matthew 1983
South Polar Skua
C. maccormicki
1250 6 708 0.0236 64 S Morgan et al. 1992
Pacific Gull
Larus pacificus
1210 1 532 0.0183 41 N Benedict and Fox 1927
Common Gull
L. canus
428 1 201 0.0196 55 N Gavrilov 1985
Ring-billed Gull
L. delawarensis
439 3 250 0.0237 29 N Ellis 1980a
Kelp Gull
L. dominicanus
980 4 610 0.0259 64 S Morgan et al. 1992
TABLE 11.2 (Continued)
Body Mass, Basal Metabolic Rates (BMR; in kJ d
–1
and kJ g
–1
h
–1
), and Breeding Region in Seabirds
Order/Species
Body
Mass
(g)
BMR Latitude/
Region
(degree)n (kJ d
–1
) (kJ g
–1
h
–1
) Source
© 2002 by CRC Press LLC
368 Biology of Marine Birds
Western Gull
L. occidentalis
761 7 294 0.0161 34 N Obst unpublished data
Glaucous Gull
L. hyperboreus
1210 2 754 0.0260 71 N Scholander et al. 1950b
Glaucous Gull
L. hyperboreus
1326 9 562 0.0177 79 N Gabrielsen and Mehlum 1989
Herring Gull
L. argentatus
1000 6 415 0.0173 45 N Lustick et al. 1978
Herring Gull
L. argentatus
924 6 428 0.0193 56 N Bryant and Furness 1995
Common Black-headed Gull
L. ridibundus
285 1 173 0.0253 55 N Gavrilov 1985
Common Black-headed Gull
L. ridibundus
252 10 188 0.0311 60 N Davydov 1972
Laughing Gull
L. atricilla
276 4 162 0.0250 29 N Ellis 1980a
Black-legged Kittiwake
Rissa tridactyla
407 11 242 0.0248 57 N Gabrielsen et al. submitted
Black-legged Kittiwake
R. tridactyla
420 17 304 0.0302 70 N G. Gabrielsen unpublished
Black-legged Kittiwake
R. tridactyla
365 16 289 0.0330 79 N Gabrielsen et al. 1988
Black-legged Kittiwake
R. tridactyla
305 4 237 0.0324 56 N Bryant and Furness 1995
Red-legged Kittiwake
R. brevirostris
333 7 230 0.0288 57 N Gabrielsen et al. submitted
Ivory Gull
Pagophila eburnea
508 2 443 0.0363 79 N Gabrielsen and Mehlum 1989
Royal Tern
Sterna maxima
373 3 217 0.0242 29 N Ellis 1980a
Arctic Tern
S. paradisaea
85 3 79 0.0386 79 N Klaassen et al. 1989
Grey-backed Tern
S. lunata
131 2 61 0.0192 24 N Pettit et al. 1985
Sooty Tern
S. fuscata
148 6 69 0.0194 21 N MacMillen et al. 1977
Brown Noddy
Anous stolidus
139 16 67 0.0201 21 N Ellis et al. 1995
Black Noddy
A. tenuirostris
90 4 55 0.0260 24 N Pettit et al. 1985
White Tern
Gygis alba
98 6 70 0.0299 24 N Pettit et al. 1985
Dovekie
Alle alle
153 23 178 0.0490 79 N Gabrielsen et al. 1991b
Razor-billed Auk
Alca torda
589 2 311 0.0220 56 N Bryant and Furness 1995
Common Murre
Uria aalge
836 8 517 0.0258 57 N Croll and McLaren 1993
Common Murre
U. aalge
803 10 461 0.0239 57 N Gabrielsen et al. submitted
TABLE 11.2 (Continued)
Body Mass, Basal Metabolic Rates (BMR; in kJ d
–1
and kJ g
–1
h
–1
), and Breeding Region in Seabirds
Order/Species
Body
Mass
(g)
BMR Latitude/
Region
(degree)n (kJ d
–1
) (kJ g
–1
h
–1
) Source
© 2002 by CRC Press LLC
Energetics of Free-Ranging Seabirds 369
where BMR is in kJ d
–1
and m is mass in kg. Unfortunately, Lasiewski and Dawson (1967) assumed
a caloric equivalency of 4.8 kcal/L O
2
, which represents an RQ of about 0.79, for all data given in
original gaseous units. Aschoff and Pohl (1970) proposed separate allometric relationships for pas-
serines and nonpasserines based on activity pattern (anticipated earlier by King and Farner 1961).
Their equations were used for most studies that thereafter noted the time that experiments were done,
and most experiments were conducted at night from that time on. Their equations for nonpasserines are
BMR
α
= 381.0 m
0.729
(11.2)
BMR
ρ
= 307.7 m
0.734
(11.3)
where α refers to the active phase and ρ the resting phase; the units are as in Equation 11.1. None
of these studies included many seabirds. Ellis (1984) provided a comparison of seabird BMR with
Aschoff and Pohl (1970) predictions where possible, but relied on the Lasiewski and Dawson (1967)
model, which used data collected both in the day and at night, for several reasons: (1) some of the
Common Murre
U. aalge
956 4 588 0.0256 65 N Johnson and West 1975
Common Murre
U. aalge
913 11 580 0.0270 70 N Gabrielsen 1996
Common Murre
U. aalge
771 4 390 0.0211 56 N Bryant and Furness 1995
Thick-billed Murre
U. lomvia
803 6 595 0.0309 57 N Croll and McLaren 1993
Thick-billed Murre
U. lomvia
1094 11 619 0.0236 57 N Gabrielsen et al. submitted
Thick-billed Murre
U. lomvia
989 5 588 0.0248 65 N Johnson and West 1975
Thick-billed Murre
U. lomvia
819 11 438 0.0223 79 N Gabrielsen et al. 1988
Black Guillemot
Cepphus grylle
342 13 262 0.0319 79 N Gabrielsen et al. 1988
Parakeet Auklet
Cyclorrhynchus psittacula
243 3 172 0.0300 57 N Gabrielsen et al. submitted
Least Auklet
Aethia pusilla
83 5 116 0.0582 56 N Roby and Ricklefs 1986
Atlantic Puffin
Fratercula arctica
329 4 313 0.0396 56 N Bryant and Furness 1995
Atlantic Puffin
F. arctica
470 22 335 0.0300 70 N Barrett et al. 1995
Horned Puffin
F. corniculata
452 5 296 0.0273 57 N Gabrielsen et al. submitted
Anseriformes
Common Eider
Somateria mollissima
1600 12 649 0.0169 79 N Gabrielsen et al. 1991a
Oldsquaw
Clangula hyemalis
490 5 237 0.0202 63 N Jenssen and Ekker 1989
TABLE 11.2 (Continued)
Body Mass, Basal Metabolic Rates (BMR; in kJ d
–1
and kJ g
–1
h
–1
), and Breeding Region in Seabirds
Order/Species
Body
Mass
(g)
BMR Latitude/
Region
(degree)n (kJ d
–1
) (kJ g
–1
h
–1
) Source
© 2002 by CRC Press LLC
370 Biology of Marine Birds
older literature did not give the time of the experiment; (2) it was unclear at very high latitudes,
where summers lacked nights and winters days, that the α/ρ differences of Aschoff and Pohl (1970)
would hold; and (3) it seemed that not all seabirds followed those activity differences. Ellis (1984)
then constructed an allometric relationship exclusively for seabirds:
BMR = 381.8 m
0.721
(11.4)
where the units are the same as in Equations 11.1 to 11.3. Ellis’ equation is very close to the α
Equation 11.2 of Aschoff and Pohl (1970), but because he did not distinguish between active and
resting phases, it is probably not directly comparable. Ellis meant for the equation to be descriptive
only, but in fact it has been used in a predictive manner as well.
While we acknowledged above that BMR may vary with activity phase (Aschoff and Pohl
1970), we suspect that activity phase may not be as important as is often considered. Differences
due to activity phase were not found in several high-latitude seabirds (Gabrielsen et al. 1988, Bryant
and Furness 1995) or in three tropical or temperate seabirds (H. Ellis unpublished). Brown (1984)
found no activity phase difference in either Macaroni Penguins (Eudyptes chrysolophus) or Rock-
hopper Penguins (E. chrysocome), and although Baudinette et al. (1986) did find one in Blue (=
Little) Penguins, it was not significant. Because of the difficulty in ascertaining a metabolic differ-
ence between activity phases in some seabirds and because not all studies report the time at which
measurements were made, our allometric equation for BMR in seabirds includes all measurements
without respect to phase. For ease of comparison, our equation, like Equations 11.1 to 11.4 above,
employs units of kJ d
–1
. However, if there are circadian differences, those units are inappropriate;
so Table 11.2 also provides units of kJ g
–1
h
–1
. But in many instances these mass-specific units are
inferred from an average body mass and an average BMR. Readers should consult original papers
where possible. Finally, several species in Table 11.2 are represented by multiple studies. We
averaged multiple studies, weighting them with the number of individuals (n) used in each.
Our overall equation for BMR in all seabirds of the four main orders, based on 110 studies on
77 species (Table 11.2) and irrespective of any possible circadian influence, is
BMR = 3.201 m
0.719
(11.5)
with mass in g (intercept s.e. = 1.143; exponent s.e. = 0.021; R
2
= 0.919). The exponent is close
to that of Ellis (1984; Equation 11.4 above).
Table 11.3 provides the BMR equations for each order. Based on our analysis, Sphenisciformes
and all but the largest Pelecaniformes have the lowest BMRs. The lower body temperatures, longer
incubation times, and longer times to raise chicks in procellariiform birds generally are not reflected
TABLE 11.3
Comparison of Allometric Equations for BMR in All Seabirds, including
Two Sea Ducks, and by Order
Taxon Total N R
2
s.e. intercept s.e. exponent
All Seabirds BMR = 3.201 m
0.719
77 0.919 1.143 0.021
Charadriiformes BMR = 2.149 m
0.804
31 0.842 1.374 0.052
Pelecaniformes BMR = 1.392 m
0.823
12 0.756 2.729 0.135
Procellariiformes BMR = 2.763 m
0.726
26 0.954 1.176 0.027
Sphenisciformes BMR = 1.775 m
0.768
6 0.944 1.721 0.066
Note: BMR is in units of kJ d
–1
and mass (m) is in g. N refers to number of species; for the
number of studies, see Table 11.2. N for all the seabird equations includes two sea ducks,
which explains the apparent discrepancy between the values in the table.
© 2002 by CRC Press LLC
Energetics of Free-Ranging Seabirds 371
in a lower BMR except when compared to charadriiform species. However, at larger body sizes
(>1 kg), pelecaniform BMR exceeds that of the procellariiforms. The number of pelecaniform
species in our analysis is relatively small (12) and there is a greater variance in both the intercept
and the exponent of that equation (reflected also in the low R
2
value). More data on a variety of
pelecaniform birds would be useful.
Finally, we would like to address the predictive value of allometric equations. We feel that
enough birds fall away from allometric predictions that allometric equations must be used with
care. Using an equation to predict BMR and then treating it as fact remains risky, a point also noted
by Bryant and Furness (1995). In spite of our hesitancy about using allometric equations for
prediction, we know they will inevitably be used that way (e.g., Ellis 1984). If that be the case,
we urge readers to pay close attention to the standard errors and R
2
values we provide; only Equation
11.5 and the procellariiform equation (Table 11.3) should even be considered for such use. Given
that caveat, we present in Table 11.2 every value for BMR that we know.
11.2.3 ANTICIPATED CORRELATES OF BMR
We tested BMR as a function of: (1) taxonomic order, (2) latitude/region, (3) ocean regime, (4)
season, (5) activity mode, and (6) body mass. Of these parameters, only order and latitude increase
the ability of body mass to predict BMR. Of those two, latitude was the more important. Using N
= 107 studies on 76 species, we found
BMR = 1.865 (mass
0.712
)[exp
10
(latitude)]
0.0047
(11.6)
where BMR remains in kJ d
–1
, mass in g, and latitude in degrees (intercept s.e. = 1.120; body mass
s.e. = 0.015; and latitude exponent s.e. = 0.001; R
2
= 0.958). The inclusion of order does not
increase the predictive value much (R
2
= 0.966). This confirms the importance of latitude in seabird
BMR first noted by Ellis (1984) for charadriiforms and extended to other seabird taxa by Bryant
and Furness (1995).
A correlate of BMR found in birds (McNab 1988) and mammals (McNab 1986a, b) is food
habits. We failed to find such a relationship among seabirds, probably owing to the lack of variety
in diet among these carnivores. Whether some relationship may eventually be found that allows,
for example, filter-feeders (of plankton) to be separated from feeders of whole fish or squid by
BMR awaits a more comprehensive data set.
Ellis (1984) suggested a correlation between activity mode, in terms of flight or feeding, and
BMR. That was not verified statistically in this study, when looking at all seabirds as a group.
Whether it exists within specific taxa is currently unknown and may also, for some taxa, require
a larger data set.
11.2.4 UNUSUAL CORRELATES OF BMR
Basal metabolic rate can be invoked as a correlate of several characters in the life histories and
demographics of birds. One of these is life span, since life span in birds scales positively with body
size (Lindstedt and Calder 1976), which is the major predictor of BMR as noted above (Figure
11.2; see Chapters 5 and 8). Similarly, mass-specific BMR can be inferred to vary inversely with
life span. For example, long-lived Laysan Albatrosses (Phoebastria immutabilis) have a low BMR
(Grant and Whittow 1983) based on the predictions of Equation 11.5 or even the procellariiform
equation (Table 11.3). However, there has not yet been a systematic study of the relationship of
BMR and life span in seabirds or any other birds in spite of Calder’s (1985) hypothesis. A
particularly interesting correlate of BMR is the intrinsic rate of reproduction (r). McNab (1980a,
1987) and Hennemann (1983b) suggested a positive correlation between BMR and r, both factors
under the control of natural selection. Though Hennemann’s formulation has been challenged
© 2002 by CRC Press LLC
372 Biology of Marine Birds
(Hayssen 1984), testing this imputed association may be of great value to seabird biologists looking
for relationships between reproductive effort and energy costs.
Another interesting correlate of BMR is the cost of feather production. Lindström et al. (1993)
demonstrated that the cost of feather production (C
f
in kJ g
–1
of dry feathers) is a function of mass-
specific BMR. They found
C
f
= 270 BMR m
–1
(11.7)
where BMR is in units of kJ g
–1
d
–1
. They further inferred an inverse relationship between body
mass and molt efficiency. Recent work on penguin molting (Cherel et al. 1994) seems to confirm
this relationship and therefore suggests confirmation of Equation 11.7 for seabirds as well (see
Section 11.4.2).
Once it was recognized that different taxa have different evolutionary molecular clocks (see
Nunn and Stanley 1998), efforts were made to determine the factor or factors that set that rate.
(a)
(b)
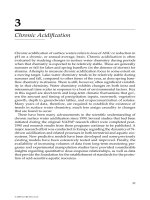
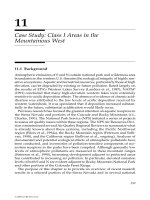
FIGURE 11.2 Body size scales directly with BMR: (a) BMR in albatrosses ranges from 637 to 1755 kJ d
–1
,
here Laysan and Black-footed Albatrosses weighing 3000 g; (b) BMR of Sooty Terns is 69 kJ d
–1
, body mass
150 g. (Photos by R. W. and E. A. Schreiber.)
© 2002 by CRC Press LLC
Energetics of Free-Ranging Seabirds 373
Martin and Palumbi (1993) suggested that metabolic rate was the key determinant because it was
related to higher mutation rates. Nunn and Stanley (1998), recognizing the close correspondence
of FMR and especially BMR with body mass, used body mass as a surrogate in their analysis of
85 species of procellariiform seabirds. They concluded that in these seabirds, metabolic rate was
the most likely factor setting the rate of change in the mitochondrial gene for cytochrome b. Stanley
and Harrison (1999) subsequently explained why molecular clocks in birds were slower than those
of mammals, despite higher metabolic rates in birds, by reconciling the avian constraint hypothesis,
which argues that increased functional constraint in birds limits substitutions of mutations, with
the metabolic rate hypothesis. This work is likely to stimulate new areas of research for birds
generally and may lead to the justification of many more BMR measurements. One question that
might be addressed is how very different metabolic rates in closely related birds (e.g., Egretta; see
Ellis 1980b) may affect this analysis.
11.2.5 LONG-TERM FASTING METABOLISM
While the measurement of BMR is dependent upon the animal being postabsorptive, this involves
a fast of only 8 to 14 h. However, several seabirds are deprived of food for longer periods during
incubation. The best known of these are the penguins, albatrosses, and eiders which can go from
several days to weeks without food (e.g., Croxall 1982, Gabrielsen et al. 1991a). During these long-
term fasts, the metabolic substrates can change from a largely lipid form to include more protein
(Groscolas 1990), which may be reflected in an increase in the RQ of the animal. A description of
the physiology and biochemistry of this kind of fast may be found in Le Maho (1993) and Cherel
et al. (1988) who describe the three phases of fasting. Briefly, Phase I is a period of adaptation and
lipid mobilization; body mass decreases with BMR decreasing even faster. Phase II is a period of
reduced activity and slow loss of body mass; mass-specific BMR reaches an equilibrium, and 90%
or more of the metabolic substrate is lipids. It is in Phase III that proteins may be mobilized; daily
body mass loss increases rapidly, and various behaviors, including locomotor activity, return,
perhaps as a hormonal “refeeding signal” to improve the bird’s chances of survival (Robin et al.
1998). These changes in metabolic activity should be noted, because many studies on the costs of
molt (Section 11.4.2) and incubation (see Chapter 12 and Section 11.5.1.1 below) have been done
on birds during long-term fasting.
11.3 SEABIRD THERMOREGULATION
When physiological studies of thermoregulation were still relatively new, Scholander et al. (1950a,
b, c) argued that birds and mammals in cold climates could evolve higher metabolic rates (BMR)
or lower thermal conductance (that is, better insulation). They demonstrated the latter, but not the
former. However, Weathers (1979) and Hails (1983) showed some effect of climate on BMR in
birds. Ellis (1984), using latitude as a general proxy for climate, also demonstrated a BMR
correlation for charadriiform seabirds. Reducing thermal conductance would reduce the lower
critical limit of an endotherm’s thermoneutral zone (TNZ), thus effectively extending downward
the range of temperatures at which its metabolism could remain basal. In this section, we address
both thermal conductance and the lower critical temperature.
Seabirds have metabolic rates that are somewhat higher than would be expected from an
analysis of all nonpasserine birds. Climate might be one reason for this. Due to sea-surface
temperatures (SST), tropical seabirds often have cooler environments than their terrestrial coun-
terparts. Polar seabirds may actually benefit in winter from the moderating temperatures of the
sea when compared to their terrestrial counterparts. Unlike the majority of polar land birds, many
seabird species do not migrate to warmer climates during winter. Whether higher metabolic rates
are accompanied by increases in insulation or reductions in the lower critical limit of the thermo-
neutral zone has not been analyzed in a comprehensive way for seabirds. We present a preliminary
© 2002 by CRC Press LLC
374 Biology of Marine Birds
analysis here but studies of the thermal biology of seabirds at different latitudes and under different
conditions are needed. Aside from a study on the influence of wind speed on thermal conductance
in Adélie Penguins and Imperial Shags (Notocarbo atriceps) by Chappell et al. (1989), these are
not yet available.
11.3.1 THERMAL CONDUCTANCE
Thermal conductance (C) is a coefficient of heat transfer (Calder and King 1974) and is inversely
related to insulation. It is the sum of many processes, including radiation, conduction, and convec-
tion. Whether it should also include the evaporative process is the subject of some debate. McNab
(1980b) distinguishes between “wet” conductance, which includes the evaporative factor, and “dry”
conductance, which does not. Drent and Stonehouse (1971) compared the wet and dry thermal
conductances of many species, and the difference decreased with increasing size. Of the 16 species
in their study exceeding 100 g, wet conductance averaged 15.5% higher than dry. In the only two
seabirds in that analysis, the Common (Mew or Short-billed) Gull (Larus canus) and Humboldt
Penguin (Spheniscus humboldti) both showed a difference of 11%. The difference between wet
and dry thermal conductance in Double-crested Cormorants (Hypoleucos auritus) was also small
(13%, which was not significant), though in the same study (Mahoney 1979) a large and significant
difference of 31.5% was found in Anhingas (Anhinga anhinga).
We have found 37 values for C in seabirds (see Table 11.4), a mix of wet and dry values.
Because the differences are likely to be small (≤15%), we do not distinguish between them in our
analysis. Most are “wet.” It should be noted, however, that these differences often become exacer-
bated when the correction of Dawson and Whittow (1994) is applied to one set of the data. Using
the same data set, Ellis et al. (1982b) referred to a wet thermal conductance 25% higher than the
dry, “corrected” values later reported for Brown Noddies (Anous stolidus) by Ellis et al. (1995)
and cited in Table 11.4.
A more fundamental difference involves the nature of the measurement. Originally, thermal
conductance was measured as a function of body surface area. This made sense, since heat exchange
is across the surface; it also conforms to the definition provided by Bligh and Johnson (1973). But
beginning with Morrison and Ryser (1951), McNab and Morrison (1963), and Lasiewski et al.
(1967), conductance was reported as a function of body mass. In our review, we favor the use of
body mass since surface area is not measurable, varies with posture, erection of feathers, etc., and
is approximated by (Meeh’s) equation. Prosser (1973) viewed this approximation as a source of
error. McNab (1980b) also noted that having surface area in the units for thermal conductance
makes them inconsistent with the units typically reported for metabolism. Luna-Jorquera et al.
(1997), analyzing the use of Meeh’s equation in penguins, argued that surface area is too prob-
lematic a measure and urged the use of body mass in the reporting of thermal conductance.
Consequently, we use a modified Meeh’s equation to back calculate all values of thermal conduc-
tance in surface area units to body mass units (kJ g
–1
h
–1
°C
–1
rather than kJ cm
–2
h
–1
°C
–1
). As
with BMR, these are derived units, so wherever possible we began with the original units for
oxygen consumption, and converted assuming RQ = 0.71 and a conversion of 19.8 kJ/L O
2
. Where
the original data were already in heat or caloric equivalents, there exists the possibility of a 5%
overestimate, as noted above. Finally, because avian conductance often drops with decreasing
ambient temperatures (Drent and Stonehouse 1971), wherever possible we follow the convention
of McNab (1980b) in using the lowest values of C at which the birds are still thermoregulating.
This is the minimal thermal conductance.
Allometric relationships for thermal conductance in birds have been reported by Herreid and
Kessel (1967) using cooling curves, Lasiewski et al. (1967) using metabolic data, Calder and King
(1974) combining both 1967 data sets, and Aschoff (1981) who distinguished between active and
resting phases. Seabirds barely contributed to any of those curves. Weathers et al. (2000) presented
thermal conductances for 17 species of seabirds, but all were from high latitudes. The data set
© 2002 by CRC Press LLC
Energetics of Free-Ranging Seabirds 375
TABLE 11.4
Body Mass, Thermal Conductance (C), and Lower Critical Temperatures (LCT) in Seabirds,
by Breeding Region
Order/Species
Body
Mass
(g) n
C
(mL O
2
g
–1
h
–1
ºC
–1
)
LCT
(ºC)
Latitude/
Region
(degree) Source
Sphenisciformes
Gentoo Penguin
Pygoscelis papua
5850 0.0222 Scholander et al. 1940
Adelie Penguin
P. adeliae
3980 5 0.0132 10 65 S Chappell et al. 1989
Emperor Penguin
Aptenodytes forsteri
23370 5 0.007 –7 78 S Pinshow et al. 1977
Blue Penguin
Eudyptula minor
900 6 0.0346 10 41 S Stahel and Nicol 1982
Procellariiformes
Southern Fulmar
Fulmarus glacialoides
780 5 0.036 5.6 69 S Weathers et al. 2000
Northern Fulmar
F. glacialis
651 16 0.0336 9 79 N Gabrielsen et al. 1988
Antarctic Petrel
Thalassoica antarctica
718 6 0.037 6.4 69 S Weathers et al. 2000
Cape Pigeon
Daption capense
420 7 0.058 10.8 69 S Weathers et al. 2000
Snow Petrel
Pagodroma nivea
292 6 0.058 13.6 69 S Weathers et al. 2000
Wedge-tailed Shearwater
Puffinus pacificus
321 0.0625 22.5 20 N Whittow et al. 1987
Manx Shearwater
P. puffinus
413 8 0.0513 62 N Bech et al. 1982
Georgian Diving-petrel
Pelecanoides georgicus
119 5 0.070 20 54 S Roby and Ricklefs 1986
Common Diving-petrel
P. urinatrix
132 4 0.070 20 54 S Roby and Ricklefs 1986
Wilson’s Storm-petrel
Oceanites oceanicus
36 0.117 16 64 S Obst 1986
Leach’s Storm-petrel
Oceanodroma leucorhoa
45 4 0.0318 14 45 N Ricklefs et al. 1986
Leach’s Storm-petrel
O. leucorhoa
47 7 0.0222 47 N Montevecchi et al. 1991
Pelecaniformes
Magnificent Frigatebird
Fregata magnificens
1100 4 0.023 20 9 N Enger 1957
Red-footed Booby
Sula sula
994 4 0.0394 19 21 N H. Ellis unpublished
Double-crested Cormorant
Hypoleucos aristotolis
1500 12 0.0492 26 N Mahoney 1979
Imperial Shag
Notocarbo atriceps
2630 6 0.0278 0 65 S Chappell et al. 1989
Charadriiformes
Heerman’s Gull
Larus heermanni
383 5 0.0506 23 32 N H. Ellis unpublished
© 2002 by CRC Press LLC
376 Biology of Marine Birds
provided in Table 11.4 is the first comprehensive compilation of thermal conductances for seabirds
from a variety of latitudes. It includes 37 measurements on 35 species. Unlike Aschoff (1981) or
the restricted set of thermal conductances presented by Weathers et al. (2000), it does not separate
these values into active and passive activity categories. This is because that information was not
always available in the studies we cited and because of the absence of a clear activity dichotomy
in the BMR data of many birds (see Section 11.2 above). Two of these measurements, both for
Leach’s Storm-petrel, represent significant outliers. Without them, we found the following relation-
ship for all seabirds:
C = 0.435 m
–0.374
(11.8)
Ring-billed Gull
L. delawarensis
470 2 0.0443 16 29 N Ellis 1980a
California Gull
L. californicus
565 5 0.0412 20 38 N H. Ellis unpublished
Glaucous Gull
L. hyperboreus
1326 9 0.0248 2 79 N Gabrielsen and Mehlum 1989
Herring Gull
L. argentatus
1000 6 0.0385 10 45 N Lustick et al. 1978
Laughing Gull
L. atricilla
278 4 0.0559 22 29 N Ellis 1980a
Black-legged Kittiwake
Rissa tridactyla
365 16 0.0466 4.5 79 N Gabrielsen et al. 1988
Ivory Gull
Pagophila eburnea
508 2 0.0488 0.5 79 N Gabrielsen and Mehlum 1989
Royal Tern
S. maxima
386 3 0.0612 23 29 N Ellis 1980a
Sooty Tern
Sterna fuscata
150 4 0.084 30 21 N MacMillen et al. 1977
Brown Noddy
Anous stolidus
140 15 0.0513 20 21 N Ellis et al. 1995
Dovekie
Alle alle
153 23 0.063 4.5 79 N Gabrielsen et al. 1991b
Common Murre
U. aalge
956 4 0.0492 5 65 N Johnson and West 1975
Thick-billed Murre
Uria lomvia
819 11 0.0282 2 79 N Gabrielsen et al. 1988
Black Guillemot
Cepphus grylle
342 13 0.0475 7 79 N Gabrielsen et al. 1988
Least Auklet
Aethia pusilla
83 5 0.084 15 56 N Roby and Ricklefs 1986
Anseriformes
Common Eider
Somateria mollissima
1661 12 0.024 7 79 N Gabrielsen et al. 1991a
TABLE 11.4 (Continued)
Body Mass, Thermal Conductance (C), and Lower Critical Temperatures (LCT) in Seabirds,
by Breeding Region
Order/Species
Body
Mass
(g) n
C
(mL O
2
g
–1
h
–1
ºC
–1
)
LCT
(ºC)
Latitude/
Region
(degree) Source
© 2002 by CRC Press LLC
Energetics of Free-Ranging Seabirds 377
where m is mass in g and C in mL O
2
g
–1
h
–1
°C
–1
(N = 35; intercept s.e. = 1.225; exponent s.e. =
0.032; R
2
= 0.806). If the outliers were included, R
2
would drop dramatically to 0.511 and the
equation would become 0.231 m
–0.281
(N = 37 measurements on 36 species; intercept s.e. = 1.337;
exponent s.e. = 0.046). Equation 11.8 differs considerably from earlier equations. Compared to the
equation of Lasiewski et al. (1967), which like ours also avoids circadian phase, our equation
predicts higher values of thermal conductance at all body masses above 150 g.
Thermal conductance varies among seabirds. In accordance with the analysis of Scholander et
al. (1950a, c), low thermal conductance (i.e., good insulation) is one adaptation which might be
expected in cold climates. On the other hand, high values of C (i.e., poor insulation) would promote
convective heat loss and might be expected in warm climates (Yarborough 1971). In a hot climate,
forced convection (wind) might be advantageous to a bird, but in a cold climate it represents a real
threat, lowering effective operative temperatures (T
e
). This must be the case for seabirds nesting
in polar areas where a combination of wind and cold temperatures leads to substantial increases
in metabolic rates, especially in adults (Chappell et al. 1989).
Avian insulation can derive from either the tissues or the feathers. Drent and Stonehouse (1971)
reported that about 20% of the total insulation of the Humboldt Penguin comes from body tissues,
including subcutaneous fat, the remainder being from the feathers. That being the case, it is likely
that molt should be important in certain seasonal adjustments. The winter acclimatized Common
Eider (Somateria mollissima) has a C which is 25% lower than the summer acclimatized eider
(Jenssen et al. 1989, Gabrielsen et al. 1991a). This is also seen in land birds in the Arctic and sub-
Arctic (West 1972, Bech 1980, Rintamäki et al. 1983, Barre 1984, Mortensen and Blix 1986).
Mortensen and Blix found that ptarmigans (Lagopus spp.) reduced C in the winter by 8 to 32%
by increasing subcutaneous fat and plumage thickness. Common Eiders probably reduce insulation
in the summer by molting their down (which is then used as nest material) and producing naked
brood patches (Gabrielsen et al. 1991a). Females also reduce insulation by losing fat during
incubation (Korschgen 1977, Parker and Holm 1990, Gabrielsen et al. 1991a).
Thermal conductance does not seem to vary in a predictable way with latitude (Gabrielsen et
al. 1988, 1991a, b). This may be because evolution may modify metabolic rate as well as thermal
conductance in cold climates (Scholander et al. 1950a, c). But comparing seabirds as a group with
land birds does indicate some connection between thermal conductance and climate. As was noted
above, polar seabirds may actually be at a thermal advantage compared to polar land birds because
of the high heat capacity of water and its moderating effect on climate. In fact, many land birds
have a better insulation. Both arctic-breeding ravens (Schwann and Williams 1978) and ptarmigan
(West 1972, Mortensen and Blix 1986) have lower values of C than do seabirds, indicating that
these permanent residents may be better cold adapted than seabirds.
11.3.2 LOWER LIMIT OF THERMONEUTRALITY
The lower critical temperature (LCT) or lower limit of thermoneutrality is an indicator of ther-
moregulatory ability since below that level metabolism must increase. Scholander et al. (1950b)
demonstrated the value of a reduced LCT in the metabolic economy of endotherms. Table 11.4
shows that, as expected, seabirds show an inverse relationship between size and LCT. We also find
that there is an influence between LCT and latitude, with Arctic and Antarctic birds having a lower
LCT than birds of similar mass from warmer climates. These relationships can be expressed by
the equation
LCT = 43.15 – 6.58 log mass – 0.26 latitude (11.9)
where LCT is in degrees Celsius; mass is in g; latitude in degrees (N = 33; intercept s.e. = 3.94;
log mass coefficient s.e. = 1.43; latitude coefficient s.e. = 0.03; R
2
= 0.779).
© 2002 by CRC Press LLC
378 Biology of Marine Birds
11.3.3 BODY TEMPERATURE
Deep body temperature (T
b
) is dependent on metabolic rate and insulation (Irving 1972). There is
no evidence that body temperature varies with climate or latitude across a range from the Arctic
through temperate and tropical to Antarctic regimes (Scholander et al. 1950c, Irving and Krog
1954, Drent 1965, Irving 1972, Barrett 1978, Prinzinger et al. 1991, Morgan et al. 1992). Body
temperatures in seabirds are typical of birds generally, though Prinzinger et al. (1991) found T
b
to
be lower in Procellariiformes and Sphenisciformes than the average for all birds. The earliest
measurements were by Eydoux and Souleyet (1838; cited in Warham 1996) on procellariiforms
and Martins (1845) who measured T
b
at 40.6°C in ten species of “webfooted” birds during summer
expeditions to Svalbard in 1838 and 1840. We do not know the species in the Martins study, but
they probably included Common Eider, Glaucous Gull (Larus hyperboreus), kittiwakes, and alcids.
His value is very close to those presented in later studies of Arctic and sub-Arctic seabirds (Irving
1972). In the Antarctic, body temperature remains at expected avian levels (Chappell et al. 1989,
Weathers et al. 2000). On the other hand, some tropical species allow T
b
to show some lability
under different conditions and even fall somewhat (Red-footed Boobies, Sula sula [Shallenberger
et al. 1974]; Great Frigatebirds, Fregata minor [Whittow et al. 1978]).
While T
b
is resistant to climate, it is linked tightly to metabolic rate. If metabolism drops for
any reason, T
b
may drop as well. This is the case with the Atlantic Puffin (Fratercula arctica) which
can lower its RMR while incubating to conserve its energy reserves. Consequently, T
b
drops and
incubation times are lengthened (Barrett et al. 1995). There seems to be some linkage to BMR as
well: procellariiform birds as a group have somewhat lower BMR than other seabirds (see Section
11.2.2) and their body temperatures are also lower (Warham 1971, 1996).
Body temperature may vary as a function of activity phase. Typically, birds that show a reduction
in metabolic rate during the ρ-phase also show a depression in T
b
(cf. Warham 1996). Great
Frigatebirds drop T
b
by 3 to 4°C during the night (Whittow et al. 1978). The linkage between T
b
and metabolism is not dependent only on activity phase. Regel and Pütz (1997) found that Emperor
Penguins (Aptenodytes forsteri) showed increases in body temperature as a function of human
disturbance as mediated by metabolic rate.
Body temperature may also be affected by the water which, because of its high heat capacity,
can represent an enormous heat sink when cold. Dumonteil et al. (1994) found T
b
to remain very
constant in water, although it was slightly (0.3°C) depressed below measurements in air. Bank
Cormorants (Compsohalieus neglectus) show a more pronounced T
b
depression in the water, either
because of poor insulation or insufficient heat production from swimming activity. These birds may
allow T
b
to drop as much as 5°C while diving to save energy (Wilson and Grémillet 1996), regaining
it quickly through sunning behavior out of the water (Grémillet 1995). On the other hand, Great
Cormorants (Phalacrocorax carbo), which do not experience as much solar radiation as Bank
Cormorants, show smaller depressions of T
b
and have better insulation (Grémillet et al. 1998).
Imperial Shags (Bevan et al. 1995a, Grémillet et al. 1998) and South Georgia Shags (Notocarbo
georgianus, Bevan et al. 1997) in Antarctic seas face such cold waters and dive so deeply they
cannot prevent T
b
from dropping. The T
b
of South Georgia Shags may drop by 5°C or more during
diving. Abdominal temperature in King Penguins (Aptenodytes patagonicus) may fall to as low as
11°C, 10 to 20° below the normal stomach temperature. A slowing of metabolism in certain
anatomical areas when diving may help explain why penguins can dive for such long durations
(Handrich et al. 1997). Similar studies on diving birds in warm water do not exist.
Deep core temperatures monitored by implants in or near the stomach are likely to be distorted
by feeding in free-ranging birds. The ingestion of food in petrels (Obst et al. 1987), boobies
(Shallenberger et al. 1974), and cormorants (Ancel et al. 1997) is known to drop stomach temper-
ature by 5°C or more. While there are obvious advantages to knowing when a diving bird ingests
prey, the effect that event has on T
b
needs to be understood better. Handrich et al. (1997) reported
that low abdominal temperatures may preserve food until the bird reaches its chicks in the colony.
© 2002 by CRC Press LLC
Energetics of Free-Ranging Seabirds 379
11.4 OTHER COSTS
BMR is defined for very specific sets of conditions, as noted above. If any of the restrictions are
violated, metabolism is not basal. However, the metabolic rates then measured may convey addi-
tional information. Metabolism in nonpostabsorptive birds, for example, may provide information
on the costs of digestion. Similarly, the costs of molt and locomotion have been quantified. Croll
and McLaren (1993) provided one such measure which is otherwise rare in the seabird literature.
They found the cost of preening in murres to be 2.5 to 3 × RMR which was the most expensive
activity these birds engaged in. Earlier Butler and Woakes (1984) had reported a preening cost in
Humboldt Penguins of just over twice resting rates. Croll and McLaren (1993) suggested that the
high increase in metabolic rate in preening murres might be linked to producing more heat for
thermoregulation in cold water.
11.4.1 DIGESTION
The cost of digestion is often referred to as specific dynamic action (SDA) in the older literature,
and today is more often referred to as the heat increment of feeding (HIF). The heat produced by
digestion is transient, but it may aid thermoregulation (Hawkins et al. 1997), though Dawson and
O’Connor (1996) did not find such a connection for most birds in their review. Baudinette et al.
(1986) found metabolic rate in Blue Penguins increased by 87% as a result of feeding. The increment
is smaller, though still appreciable (36 to 49%) in Common and Thick-billed Murres according to
two studies (Croll and McLaren 1993, Hawkins et al. 1997). Hawkins et al. suggested that this
increment could be responsible for nearly 6% of the daily energy expenditure of either murre
species. However, caution is urged because Wilson and Culik (1991) found the increase in metabolic
rate associated with feeding in Adélie Penguins to result from heating cold food to body temperature
rather than actual SDA. Weathers et al. (2000) discussed the effect of HIF on nestling metabolic
rates in four Antarctic fulmarine petrels. They do not attribute a thermoregulatory role to HIF in
these birds.
11.4.2 MOLT
The metabolic cost of molt in birds was not known in any detail until late in the 20th century (King
1974, 1981). Murphy (1996) provides an excellent summary of the energetics of molt, but provides
no information about seabirds. Among seabirds, molt has been best studied in penguins and was
reviewed by Adams and Brown (1990). This section supplements that work with some more recent
information and some slightly different perspectives. Readers concerned with the mechanisms of
molt in penguins are referred to Groscolas (1990).
Adams and Brown (1990) evaluate the use of mass loss in estimating the energetic cost of molt
in penguins. Based on mass loss, Williams et al. (1977) estimated the cost of molt to be 1.6 and
2.1 × BMR for Macaroni Penguins and Rockhopper Penguins, respectively. However, these mul-
tiples were based on predictions from the Lasiewski-Dawson (1967) allometric equation, and the
mass losses assumed a large component of fat during molt. Relying primarily on studies using
mass loss, Croxall (1982) estimated the cost of molt at twice BMR and established that only about
half the material lost was fat, which had clear energy implications. Brown (1985) underscored this
by comparing the cost of molt in Macaroni and Rockhopper Penguins using both mass loss and
oxygen consumption. Using mass loss, he estimated the cost to be 1.96 and 1.79 × IMR (incubation
metabolic rate, a value Brown felt was close to BMR; see Whittow on IMR, Chapter 12), respec-
tively; but with oxygen consumption the multiples were 1.81 and 1.50. These two sets of figures
could be partially reconciled by reducing the proportion of fat in the mass loss below the level
assumed by Williams et al. (1977). Groscolas and Cherel (1992) reported the daily rate of mass
specific weight loss to double in King Penguins and increase fivefold in Emperor Penguins during
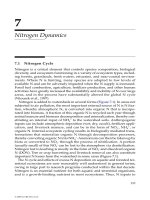
molt compared to breeding, suggesting a high associated cost of molt. Cherel et al. (1994) used
© 2002 by CRC Press LLC
380 Biology of Marine Birds
mass loss to estimate the cost of molt in King Penguins; it agreed with a value determined by
indirect calorimetry. They found the metabolic rate of fasting King Penguins in molt to be 21%
higher than in birds that were fasting during the breeding season (Figure 11.3). Their value for cost
of molt as a multiple of BMR depends on the value for BMR used. It is 1.30 × BMR as determined
by Le Maho and Despin (1976) but 1.67 × BMR (Adams and Brown 1990). These values bracket
the 50% increase in Blue Penguins (Baudinette et al. 1986, Gales et al. 1988). Both Baudinette et
al. (1986), using oxygen consumption in confined birds, and Gales et al. (1988), using doubly
labeled water in free-ranging penguins, found the cost of molt to be 1.5 × BMR. However, they
used different values for BMR (see Section 11.2.1). If Gales et al. had used the average value
reported by Baudinette et al. (1986), or Stahel and Nicol (1988) instead of Stahel and Nicol (1982),
their multiple would have been 2.6 × BMR.
Murphy (1996) reported that the energy content of feathers and other associated keratinous
structures is 22 kJ g
–1
of dry mass and argued that the cost of depositing these structures should
be minimal, perhaps <6% of BMR. However, the actual energy costs of molt are higher because
of associated costs including the processing and utilizing of nutrients for feather growth, specific
nutritional costs associated with molt, etc. (King 1981, Lindström et al. 1993, Murphy 1996). These
associated costs may not include additional thermogenesis, which Murphy (1996) discounted as a
problem in most birds (but see Groscolas and Cherel 1992 for a different view regarding penguins).
She cites a total cost of molt between 109 and 211% of nonmolt (BMR?) levels. Values for penguins,
which have a more intense molt than most other birds, tend toward the upper end of that range.
Lindström et al. (1993) looked at energetic efficiencies (energy deposited as feathers and associated
structures divided by the feather mass specific cost of molt) of several avian species (none seabirds).
They found efficiencies to increase with increasing body mass because the cost of feather production
was inversely related to mass. This is validated by Cherel et al. (1994) who found the lowest cost
of feather production (85 kJ g
–1
) and one of the highest efficiencies (25%) in King Penguins, which
began their molting fasts at 18 kg and ended them at a still quite large 10 kg.
11.4.3 LOCOMOTION
Seabirds move by flight, swimming, and walking, though several species are incapable of at least
one such form (e.g., some of the better diving birds such as tropicbirds, loons, and grebes have
legs so far back that they cannot walk; penguins cannot fly; frigatebirds and skimmers do not swim).
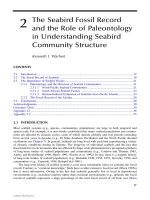
FIGURE 11.3 In King Penguins (Crozet Island), adults during the breeding season (here incubating eggs on
their feet) have a significantly lower metabolic rate of fasting than when fasting during molt, implying a high
cost of molt. (Photo by H. Weimerskirch.)
© 2002 by CRC Press LLC
Energetics of Free-Ranging Seabirds 381
The energetics of flight in birds generally was reviewed recently (Norberg 1996, Butler and Bishop
2000). Two papers (Pennycuick 1987a, b) missed in those reviews add to our understanding of
flight in seabirds. Pennycuick (1987b) noted that in spite of the great variety of feeding methods
and provisioning frequencies found in seabirds, the only factor that has had a “drastic” effect on
flight adaptations is the use of wings under water. That is obvious in penguins and will be noted
below for alcids. Those interested in the full range of physiological trade-offs between flight and
diving should consult Lavvorn and Jones (1994).
The costs of flight in particular species of seabirds was noted in Ellis (1984). Wind seems to
be a major environmental factor. Sooty Terns have a low cost of flight due to their partial reliance
on soaring (Flint and Nagy 1984). Red-footed Boobies also take advantage of the wind during
flight and show considerably lower costs than would otherwise be expected (Ballance 1995). This
was also inferred for Gray-headed Albatrosses (Thalassarche chrysostoma); the indirect measure
of their flight costs was compared also to those of other seabirds known at that time (Costa and
Prince 1987). The geographic distribution of the Wandering Albatross (Diomedea exulans; Jouven-
tin and Weimerskirch 1990) and Northern Fulmar (Fulmarus glacialis; Furness and Bryant 1996)
may be limited by the absence of wind. Boobies and frigatebirds roost in greater numbers during
low or no-wind days implying a greater cost of flight on those days (Schreiber and Chovan 1986,
Schreiber 1999). On the other hand, wind has been reported to increase the cost of flight (Black-
legged Kittiwakes and Dovekies, Alle alle; Gabrielsen et al. 1987, 1991b).
11.4.3.1 Swimming
Large numbers of species of seabirds swim on the surface of the water; fewer swim under the
surface. Of those that do, penguins, alcids (auks and their relatives), sulids (gannets and boobies),
and some shearwaters propel themselves under water with their wings, whereas tropicbirds, diving
petrels, and cormorants use their feet, as do the seasonally marine grebes and loons. Some of the
larger procellariiforms (albatrosses and shearwaters) use both modes. The fact that many albatrosses
dive at all was not well known until recently (Prince et al. 1994). In this section, the terms diving
and subsurface or underwater swimming are used synonymously.
The earliest examination of the energetics of surface swimming was on ducks (Prange and
Schmidt-Nielsen 1970). Most of the information developed recently on the energetics of diving
has been for the wing-propelled groups. Baudinette and Gill (1985) compared surface and under-
water swimming in Blue Penguins and found a 40% reduction in the cost of a penguin swimming
below the surface compared to one swimming at the surface. Several studies have shown that as
speed increases, birds that have a choice switch from surface to underwater swimming which can
be accomplished more cheaply at higher speeds (Baudinette and Gill 1985, Hui 1988a). The greater
efficiency of penguins may be gauged in a comparison of the metabolic costs of wing-propelled
Humboldt Penguins at 1.26 × RMR (Butler and Woakes 1984) with wing-propelled Common
Murres at 1.8 × RMR and Thick-billed Murres at 2.4 × RMR (Croll and McLaren 1993) and foot-
propelled divers (Tufted Ducks at 3.5 × RMR; Woakes and Butler 1983). Schmid et al. (1995)
reported a multiple nearly 12 × BMR (daytime) and 2.6 × RMR (in water) in the Great Cormorant
(foot-propelled). Given the paucity of data in foot-propelled divers, this very high value cannot be
easily evaluated.
Cormorant feathers are more wettable than other diving birds, so buoyancy is a relatively small
problem for them (Schmid et al. 1995, Grémillet et al. 1998). That suggests that one reason given
for the poorer performance of ducks and alcids (greater costs of overcoming buoyancy; Woakes
and Butler 1983, Croll and McLaren 1993) may not be as important as previously thought (but see
Ancel et al. 2000). However, thermoregulatory costs may add to the high expense of diving in
cormorants (Schmid et al. 1995, Grémillet and Wilson 1999, Ancel et al. 2000; but see also Section
11.3.3 above). Potential thermoregulatory costs may be countered by more fat insulation, but that
may confer additional costs for flight (Butler 2000). A more fundamental difference may be that
© 2002 by CRC Press LLC
382 Biology of Marine Birds
wing-propelled diving is cheaper than foot-propelled diving, and that wings uncompromised by
the demands of flight confer an additional advantage.
Total efficiency of swimming is the ratio of power input (the product of drag and speed) to
metabolic power output. In surface swimming, the efficiencies of Mallards (Anas platyrhynchos;
Prange and Schmidt-Nielsen 1970), Black Ducks (A. superciliosa; Baudinette and Gill 1985), Blue
Penguins (Baudinette and Gill 1985), and Humboldt Penguins (Hui 1988a) are remarkably similar:
4 to 5%. However, maximal efficiency for Humboldt Penguins is achieved when swimming under
water; it is 19.2% (Hui 1988a). Hui attributes the increased efficiency to the greater proportion of
wing muscles to body mass in penguins compared to the proportion of leg muscles in ducks.
Efficiencies can often be reflected in the cost of transport (COT), which is the metabolic expenditure
needed to move a unit of mass a unit distance (usually oxygen consumption or SI units of energy
times kg
–1
m
–1
). Typically, it is the minimal COT which is reported. Blue Penguins swimming
underwater have lower costs of transport than surface-swimming birds (Baudinette and Gill 1985);
their costs are comparable to those found for Humboldt Penguins (Hui 1988a) and Jackass Penguins
(Spheniscus demersus; Nagy et al. 1984), 13.5 to 15.5 J kg
–1
m
–1
. More recent studies that use birds
that dive voluntarily and do not carry external devices indicate that COT values may be much lower
in diving penguins. Culik et al. (1994) report values of 7.1, 6.3, and 8.9 J kg
–1
m
–1
for Adélie,
Chinstrap (Pygoscelis antarctica), and Gentoo (P. papua) Penguins, respectively. Using a similar
analysis, Luna-Jorquera and Culik (2000) found a comparably low cost of transport, 6.8 J kg
–1
m
–1
in Humboldt Penguins. A still lower value of 4.7 J kg
–1
m
–1
has been reported for King Penguins
(Culik et al. 1996). This lower COT increases still further the difference between surface and
underwater swimming. By contrast, minimal COT = 19 J kg
–1
m
–1
in foot-propelled Great Cormo-
rants (Schmid et al. 1995) and Brandt’s Cormorants (Compsohalieus penicillatus; Ancel et al. 2000).
The effect of using external devices on birds for which either swimming metabolism or dive
performance is measured has been questioned. In a swim channel, Adélie Penguins (Culik and
Wilson 1991b) and Great Cormorants (Schmid et al. 1995) carrying external packs had higher costs
of transport largely due to increases in drag; the penguins even had higher RMR values than controls.
Culik and Wilson (1991b) predicted that penguins and alcids so instrumented would show reduced
speeds, smaller foraging ranges, and lower food acquisition. Ropert-Coudert et al. (2000), using
free-ranging animals, confirmed this with King Penguins carrying external packs. Their proportion
of consecutive deep dives was reduced compared to birds with internal instrumentation. Ropert-
Coudert et al. join Culik and Wilson (1991b) in recommending internal instrumentation in studies
of free-living diving birds. However, the implanting of such devices requires a level of surgical
skill not necessary with external devices.
The multiples of BMR or RMR noted above are all low, with the possible exception of the Great
Cormorant, compared to the maximum multiples we see in birds for aerial or cursorial locomotion.
It is reasonable to infer that maximal metabolic rates were never achieved in these studies. In the
case of the surface swimmers, the reason was first proposed by Prange and Schmidt-Nielsen (1970),
later confirmed by Baudinette and Gill (1985): surface-swimming birds cannot exceed a particular
“hull speed” dictated by forces of drag even if they have more metabolic capacity available. In the
case of diving birds, it is likely that maximal speeds and thus power output were not achieved under
experimental conditions. However, Kooyman and Ponganis (1994) attempted to achieve such a power
output by attaching loads to swimming Emperor Penguins. Although they did not find a maximum
metabolic rate, they felt that the 7.8 × RMR was close to it. Because they were hesitant to accept
RMR as true BMR (for reasons noted also above; Kooyman personal communication), they also
provide a multiple of 9.1 × the value predicted by Aschoff and Pohl (1970) for a 20.8-kg bird. Either
multiple is smaller than found in running or flying birds, which Kooyman and Ponganis (1994)
attribute to a higher anaerobic capacity of (Emperor) penguin muscles and the ability to conserve
oxygen for longer periods while diving (see also Kooyman et al. 1992a). It is widely thought that
diving birds, especially penguins, will attempt to remain within their aerobic dive limit (ADL), which
is the dive duration that produces no increased lactate levels after a dive. Since ADL is rarely
© 2002 by CRC Press LLC
Energetics of Free-Ranging Seabirds 383
measured, a calculated version (cADL) is often used. Analyzing these data for three penguin species,
Butler (2000) concluded that the cost of normal dives may be very close to RMR values in the water.
This surely is not true for cormorants (Ancel et al. 2000) and warrants additional testing.
The energetics of swimming in penguins is treated in several reviews (Oehme and Bannasch
1989, Croxall and Davis 1990, Kooyman and Ponganis 1990). Croxall and Davis (1990) also
presented a valuable analysis and critique of methods used. One concern raised by Butler and Woakes
(1984) was that attempts to quantify swimming costs using isotopes (doubly labeled or tritiated water;
Kooyman et al. 1982) might confound the costs associated with locomotion and those reflecting
thermoregulation. This is only a problem where water temperatures are considerably below the TNZ.
An attempt to model the metabolic costs of (underwater) swimming in marine homeotherms, based
on pinnipeds, but purportedly applicable to birds as well, is presented by Hind and Gurney (1997).
Although it is ancillary to a discussion on metabolic costs, the mechanics of swimming in penguins
(Hui 1988b, Oehme and Bannasch 1989) and in foot-propelled swimmers (Lavvorn 1991, Lavvorn
et al. 1991) is available. A general review of the hydrodynamics and power requirements of all divers
is provided by Kooyman (1989), and Butler and Jones (1997) reviews of the physiology of diving.
11.4.3.2 Walking
LeMaho and Dewasmes (1984) reviewed walking in penguins. In fact, all the work on seabird
walking continues exclusively in this group. Although the cost of transport for walking has long
been known to be higher than for other modes of locomotion (Baudinette and Gill 1985), the
multiple of active metabolic rate to BMR in an extremely cursorial species (Rheas, Rhea americana;
35 × BMR) may be the highest locomotion multiple reported in vertebrates (Bundle et al. 1998).
To the extent that walking represents a major part of a species’ time-activity budget, its energetics
is of some importance. The Emperor Penguin has been documented to walk as far as 300 km to
get to foraging areas (Ancel et al. 1992).
Pinshow et al. (1977) compared the metabolic rates and costs of transport of Emperor, Adélie,
and White-flippered Penguins (Eudyptula minor albosignata) with those of other walking birds.
They found penguin COT values to be quite high. But Wilson et al. (1999), observing that
Magellanic Penguins (Spheniscus magellanicus) walked up the slope of a shore from the water’s
edge at a 39° angle, instead of the shorter 90° angle, concluded that COT in walking penguins may
have been overestimated by as much as two times and that waddling walk might not be so expensive
as suggested by Pinshow et al. (1977). Griffen and Kram (2000) concluded that the high cost of
walking in Emperor Penguins is not due to waddling, which they found actually to conserve energy,
but to their short legs which require them to generate muscular force more rapidly. Wilson et al.
(1991) showed that tobogganing in Adélie Penguins was less expensive than walking under most
conditions, but the savings were countered by feather wear, consequential reduced diving perfor-
mance, and the added costs of feather maintenance.
11.5 DAILY ENERGY EXPENDITURE AND FIELD METABOLIC RATE
IN SEABIRDS
Daily energy expenditure (DEE) is the energetic cost for an animal to live throughout a day during
its normal routine. DEE may vary somewhat from day to day and more across seasons. It includes
all those general maintenance functions necessary to stay alive and included in measurements of
BMR; also included are the cost of thermoregulation and all other activities from feeding to
locomotion to reproduction appropriate to the particular part of the annual cycle being studied.
11.5.1 TYPES OF DEE MEASUREMENTS
The development of a daily energy budget was long a goal of those working in the field
of energetics. King (1974) explained several ways to estimate energy budgets: extrapolating
© 2002 by CRC Press LLC