ECOTOXICOLOGY: A Comprehensive Treatment - Chapter 9 docx
Bạn đang xem bản rút gọn của tài liệu. Xem và tải ngay bản đầy đủ của tài liệu tại đây (389.8 KB, 28 trang )
Clements: “3357_c009” — 2007/11/9 — 12:41 — page 135 — #1
9
Lethal Effects
9.1 OVERVIEW
When toxicologists added the prefix eco to the field of toxicology, so that the word became ecotoxicology,
they continued primarily to make the same measurements they made before the name changed.
(Cairns 1992)
Death can result from acute or chronic exposures to toxicants contained in many diverse sources.
The distinction between acute and chronic exposure duration, adopted from human toxicology, is
based as much on pragmatism as sound toxicology. A lethal exposure is customarily categorized
as acute if it is a relatively brief and intense one to a poison. Standard durations are espoused for
conducting acute lethality tests. For example, Sprague (1969) argued for 96 h after observing that
“For 211 of 375 toxicity tests reviewed, acute lethal action apparently ceased with 4 days, although
this tabulation may have been biased ” This kind of correlative analysis and the convenience of
fitting a test within the workweek motivated the initial codification of a 96-h test.
It is important to note that Sprague stated in his 1969 monograph that his intentions were to
describe “profitable bioassay methods” about which there was ample “room for healthy disagree-
ment.” Along the vein of healthy disagreement, one could conclude from these same data that a 96-h
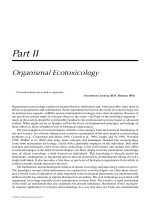
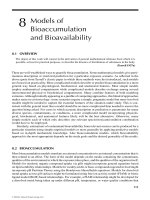
duration was insufficient for characterizing acute lethality in more than 4 out of 10 tests (Figure 9.1).
Further, Sprague notes that the tests considered in making his recommendation included many static
tests
1
in which toxicant concentrations probably decreased substantially during the exposures and
that those results from continuous flow tests that had much less chance of substantial toxicant con-
centration decrease during the tests generally indicated a longer duration was needed than did the
static tests. Given the urgency in the 1960s for standard tools for dealing with pervasive pollution,
the assumption that mortality by 96 h accurately reflected that occurring during any acute exposure
duration is an understandable regulatory stance. However, it is scientifically indefensible and insuf-
ficient for today’s needs. Consequently, many thoughtful ecotoxicologists now generate lethal effect
metrics several times during acute toxicity tests.
2
And, as we will see, alternative approaches exist
that avoid this issue altogether.
A similar blend of science and pragmatism contributed to the current selection of test durations
for chronic exposures. By recent convention, chronic exposure occurs if exposure duration exceeds
10% of an organism’s lifetime (Suter 1993); however, this has not always been the convention
and 10% is an arbitrary cut-off point. Consequently, other durations are specified in some standard
chronic test protocols and associated results are reported throughout the peer-reviewed literature.
Test protocols have emerged for exposures differing relative to the medium containing the tox-
icant(s) as well as exposure duration. For example, test protocols for acute (e.g., EPA 2002a) and
chronic (e.g., EPA 2002b) water exposures quantify lethality under these two general categories
of exposure duration. Exposures occur by oral, dermal, and respiratory routes, and accordingly,
testing techniques have emerged that accommodate these routes (e.g., EPA (2002) for sediments).
1
Generally, the toxicant is introduced into the test tanks at the beginning of a static aquatic toxicity test and not renewed
for the test duration. Such tests are often characterized by substantial decreases in toxicant concentrations as the toxicant
degrades, volatilizes, adsorbs to solids, or otherwise leaves solution. Such dosing problems in early, static tests have been
reduced in current techniques by either periodic renewal of toxicant solutions or supplying a continuous flow of toxicant
solution into exposure tanks (see for more detail Buikema et al. 1982).
2
Sprague (1969) recommended this strategy to increase the information drawn from acute lethality tests.
135
© 2008 by Taylor & Francis Group, LLC
Clements: “3357_c009” — 2007/11/9 — 12:41 — page 136 — #2
136 Ecotoxicology: A Comprehensive Treatment
125
100
75
50
25
0
Number of days (or less)
Number of toxicity tests
<1
<2
<4
>4
>7
>14
FIGURE 9.1 The number ofearlytoxicity tests tabulatedby Sprague (1969) inwhich acute mortality appeared
to be completely expressed in exposed individuals by the specified exposure duration. Sprague noted that this
data set included results from many static exposure tests in which the toxicant solutions were not changed
and, as a consequence, the toxicant concentrations likely decreased substantially during testing. The tests are
categorized here based on the time interval thought to be adequate for full expression of acute mortality, for
example, “<1” = complete acute lethality expressed in 1 day or shorter.
Unfortunately, standard methods incorporating predictions of mortality from pulsed exposures are
yet to be codified, but methods for dealing with these exposure scenarios are becoming increasingly
seen as necessary to consider by ecological risk assessors. Those accommodating simultaneous
exposure to several sources are also less common than warranted.
Approaches for characterizing or predicting lethal effects of single toxicant exposures are well
established although some potentially useful approaches have yet to be explored sufficiently. This
being the case, conventional and emerging approaches will be described in this chapter after dis-
cussion of some examples of lethality as manifested at the whole organism level of biological
organization.
9.1.1 DISTINCT DYNAMICS ARISING FROM UNDERLAYING
MECHANISMS AND MODES OF ACTION
Molecular, cellular, anatomical, and physiological alterations that contribute to somatic death were
sketched out in preceding chapters. Here, organismal consequences of such processes as nar-
cosis, uncoupling of oxidative phosphorylation, and general stress will be explored. Hopefully,
these examples demonstrate that all lethal responses to poisonings are not identical and that under-
standing the suborganismal processes resulting from exposure is extremely helpful for predicting
consequences to individuals and populations.
Narcosis is often described as a reversible, chemically induced decrease in general nervous
system functioning. The decrease in nervous system function results from disruption of nerve cell
membrane functioning in higher animals as explained earlier (Chapter 3, Section 3.10); however,
narcotic effects due to pervasive membrane dysfunction also manifest as a general depression of
biological activity inorganisms lacking nervoussystems. Narcosis ofsufficient intensity andduration
lowers biological activities of any organism below those essential to maintaining the soma, resulting
in death. But, because narcosis is reversible, postexposure mortality may be low relative to that
resulting from damage which requires more time to repair. For example, grass shrimp (Palaemonetes
pugio) acutely exposed for 48 or 60 h to polycyclic aromatic hydrocarbons (1-ethylnaphthalene,
© 2008 by Taylor & Francis Group, LLC
Clements: “3357_c009” — 2007/11/9 — 12:41 — page 137 — #3
Lethal Effects 137
0
0.1
0.2
0.3
0.4
0.5
0.6
0.7
0.8
0.9
0 20 40 60 80 100 120
Proportion dead
Time (h)
Exposure Postexposure
Control
0.2 mg/L
0.3 mg/L
0.4 mg/L
0.6 mg/L
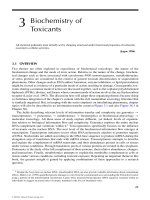
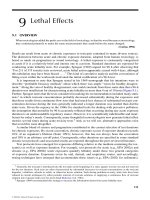
FIGURE 9.2 Cumulativemortality, includingpostexposuremortality, ofamphipods (Hyalella azteca) exposed
to four concentrations of dissolved copper. (Modified panel from Figure 1 of Zhao and Newman (2004).) Note
that substantial mortality occurred after copper exposure ended.
2,6-dimethylnaphthalene, and phenanthrene) showed minimal postexposure mortality (Unger et al.
2007). In contrast, mortality experienced by amphipods (Hyalella azteca) after exposure to dissolved
copper was quite high (Figure 9.2) because, as discussed in previous chapters, metals cause extensive
biochemical, cellular, and tissue damage that takes considerable time to repair (Zhao and Newman
2004).
Another specific mechanism that can produce mortality is oxidative phosphorylation uncoupling.
Such disruption of this essential mitochondrial process is typical of many substituted phenols (see
Chapter 3, Section 3.9). At the organismal level, consequences range from elevated blood pH to
disruption of normal respiratory processes to somatic death. Like the narcosis-related mortality
just described, there can be minimal postexposure death in an exposed population. For example,
amphipods acutely exposed to sodium pentachlorophenol showed minimal postexposure mortality
(Zhao and Newman 2004). The pentachlorophenol is quickly eliminated from this amphipod and
effects are reversible (Nuutinen et al. 2003). Mosquitofish (Gambusia holbrooki) acutely exposed to
pentachlorophenol showed similar minimal postexposure mortality for the same reasons (Newman
and McCloskey 2000).
In contrast to the lethal dynamics of such poisons, some toxicants cause pervasive changes or
damage that requires considerable time to recover. The copper damage that resulted in the post-
exposure mortality shown in Figure 9.2 is one example. The tissue damage resulting from metal
exposure took considerable time to repair and, consequently, mortality continued well beyond ter-
mination of exposure. Similarly, mosquitofish (G. holbrooki) acutely exposed to high concentrations
of sodium chloride showed prolonged and high postexposure mortality (Newman and McCloskey
2000). The cellular and tissue damage caused by the associated isomotic and ionic conditions takes
time to repair. Fish, succumbing after exposure ends, did not have enough time or energy reserves
to recuperate.
The nature of the lethal response can vary in other important ways. Some toxicants will display
a concentration or dose threshold below which no lethal consequences are apparent. Mosquitofish
exposure to high concentrations of sodium chloride is one obvious example in which death will
not occur as long as the individual is able to osmo- and ionoregulate sufficiently at the particular
sodium chloride concentration. However, the energetic burden imposed on the individual might
© 2008 by Taylor & Francis Group, LLC
Clements: “3357_c009” — 2007/11/9 — 12:41 — page 138 — #4
138 Ecotoxicology: A Comprehensive Treatment
result in decreased fitness in other aspects of the individual’s life cycle. In addition, some, but
not all, toxicants are characterized by a minimum time to die: the individual simply cannot die
faster than this threshold time regardless of the exposure concentration or dose (Gaddum 1953). The
presence and magnitude of a threshold time depends on the toxicant’s bioaccumulation kinetics and
the suborganismal nature of its effect upon any particular species or individual.
Complete freedom from stress is death.
(Selye 1973)
The somatic deaths described above involved specific modes of action but some somatic deaths
involve the general stress process. Like the inappropriate toxicant-induced apoptosis described in
Chapter 4 (Section 4.2.1) or the adverse consequences of inflammation described in Chapter 4
(Section 4.2.3), inappropriate or inadequate expression of the body’s general reaction to stressors
can lead to death of individuals. Such somatic death is said to result from what Selye (1984) described
as a disease of adaptation. Regardless of the stressor, the body invokes a general suite of reactions
that, because of their universal presence and integrative nature, merit detailed discussion at the level
of the individual.
3
The endocrinologist Hans Selye was the first to describe biological stress (Selye 1936). He
defined stress as all nonspecific responses induced by intense demands placed on the organism.
He named the associated syndrome, the general adaptation syndrome (GAS) (Selye 1950). The
GAS has three phases: the alarm reaction, resistance, and exhaustion phases. The alarm phase is
easily recognized as the immediate one in which the soma’s resources are mustered suddenly to
cope with a stressor. Rapid hormonal changes cause an organism’s pulse and blood pressure to
increase, putting it into a “flight or fight” state that takes considerable energy to maintain. Other
immediate changes include those to breathing, blood flow to muscles, the immune system, behavior,
and even, memory.At the cellular level, secretory granules discharge from cells of the adrenal cortex
(Selye 1950). Characteristics emerging later in the resistance phase that Selye first identified in
stressed rats are adrenal cortex enlargement with reappearance of normal levels of secretory granules,
thymus and lymph node atrophy, and appearance of gastric ulcers. In mammals, such changes are
brought about by the hypothalamic-pituitary-adrenal system’s response to a stressor (see Tsigos
and Chrousos (2002) for details). Analogous systems are involved in other vertebrates (i.e., the
hypothalamo-pituitary-interrenal system of fishes and amphibians). The glucocorticoid cortisol and
the catecholamines dopamine, norepinephrine, and epinephrine are prominent facilitators of the
stress response. The resistance or adaptation phase is reached only if stress is sufficiently prolonged,
resulting inorganand physiological changessuchas those mentionedabove. These shifts areintended
to resist changes associated with a stressor by using less energy than changes associated with the
alarm phase, and also, to maintain homeostasis. Examples of changes are adrenal gland enlargement
to produce glucocorticoids that modify metabolism and also shifts in the immune system so that
the body generally has reduced ability to express an inflammation response.
4
Selye refers to this
state of artificially increased homeostasis as heterostasis. If stress continues and eventually exceeds
the individual’s finite adaptive energy, the exhaustion phase is entered in which the individual
gradually loses its ability to maintain any semblance of essential stasis in the presence of the stressor.
3
A reasonable argument could be made that this issue, because of the essential role played by hormones, should have been
discussed in Chapter 6. However, the associated processes involve the integration of many biochemicals, organs, tissues, and
organ systems within the individual, so it is more appropriate to discuss it here. The fact that it could be covered in either
chapter attests to the soundness of the central theme of this book that making linkages among levels of biological organization
is important and possible in ecotoxicology.
4
The body’s response to a local stressor is called a Local Adaptation Syndrome (LAS) and will be coordinated within the
GAS. An example of such coordination is the influence of the GAS on the degree to which the body expresses inflammation
locally in a damaged tissue.
© 2008 by Taylor & Francis Group, LLC
Clements: “3357_c009” — 2007/11/9 — 12:41 — page 139 — #5
Lethal Effects 139
Box 9.1 The Pharmacologist of Dirt
As a University of Prague medical student in 1925, Selye noticed a consistent syndrome with
patients suffering from different, but intense, demands on their bodies (Selye 1973, 1984).
A decade later as a young researcher studying sex hormones, he saw the same syndrome mani-
fest in laboratory rats after injection with ovarian extracts. Rats showed a distinct syndrome
in which the adrenal cortex enlarged, lymphatic structures (thymus, spleen, and lymph nodes)
shrunk, and stomach ulcers appeared. He later found that injection of extracts from other tissues
and even formalin elicited this same syndrome.
Because his original intent had been to identify novel sex hormones by injecting ovarian
extracts into rats, his findings were extremely disheartening. That tissues other than ovaries
elicited the same response might be an acceptable finding because tissues other than gonads
were known at that time to produce sex hormones. But the appearance of the syndrome after
formalin injection was inexplicable by any mechanism involving a sex hormone. After perform-
ing several more permutations of his experiments, he reluctantly came to the conclusion that
the syndrome was not a specific one to an extracted hormone, but a general defense response
to demands placed on the soma by a stressor. But his mood gradually changed from despair
to fascination. He had found a general adaptive response, yet medical convention at that time
focused solely on telltale effects produced by specific disease agents. Contrary to convention,
he had discovered a nonspecific, defensive response. He shared his excitement about this novel
vantage with a valued mentor who, after failing to dissuade him from further work along this
theme, exclaimed, “But, Selye, try to realize what you are doing before it is too late. You have
now decided to spend your entire life studying the pharmacology of dirt.” After recovering
from the sting of this comment, Selye spent his career studying what later became known as
the theory of stress. Along the way, he published 1500 articles and 30 books that established
a completely new discipline. Fortunately, the label “dirt pharmacology” never caught on.
What is the point? To use Selye’s own thoughts about his experience, “My advice to a novice
scientist is to look for the mere outlines of the big things with his fresh, untrained, but still
unprejudiced mind” (Selye 1984). Respect, but do not be confined by, the current thinking in
your field (see also Chapter 36).
Many changes that appeared during the alarm stage and abated during the resistance phase can
reappear during the exhaustion phase (Selye 1950). Death occurs at the end of the exhaustion
phase.
What is the significance of the GAS-associated shifts relative to coping with an infectious or
noninfectious stressor? Selye breaks these changes down into responses facilitated by syntoxic and
catatoxic hormones. Syntoxic hormones facilitate an individual’s ability to coexist with the stressor
during the period of challenge (e.g., those modulating the inflammation response during a general
infection). Specific examples include cortisone and cortisol inhibition of inflammation as well as
their altering of glucose metabolism. The catatoxic hormones are designed to enhance stressor
destruction, “mostly through the induction of poison-metabolizing enzymes in the liver” (Selye
1984). Dysfunctions of these responses are called diseases of adaptation because they reflect health-
enhancing processes gone awry. Human diseases of this sort include hypertension, some heart and
kidney diseases, and rheumatoid arthritis. The activation of chemicals by liver enzymes discussed
in previous chapters fit into this category of diseases also. Regardless, the reader will probably
recognize at this point that the syntoxic and catatoxic hormones are pivotal to integrating the diverse
defense mechanisms described in earlier chapters at the organismal level.
Not only can stress cause direct mortality of exposed individuals but can also, as suggested by
the immunological changes described above, modify an individual’s risk of death from toxicants or
© 2008 by Taylor & Francis Group, LLC
Clements: “3357_c009” — 2007/11/9 — 12:41 — page 140 — #6
140 Ecotoxicology: A Comprehensive Treatment
infectious agents. Friedman and Lawrence (2002) describe such exacerbation by stress of environ-
mentally induced human maladies. Contaminants can also modify the stress response of exposed
species. Hontela (1998) reported that low, chronic toxicant field exposures of fish appeared to reduce
plasma corticosteroid levels, suggesting a compromised ability to respond to other stressors. Amphi-
bians (Necturus maculosus) exposed in the field to polychlorinated biphenyls and organochlorine
pesticides also demonstrated reduced ability to produce corticosterone when stressed (Gendron et al.
1997). As a final example, Benguira and Hontela (2000) documented reduced ability of rainbow
trout (Oncorhychus mykiss) interrenal tissue to secrete cortisol with adrenocorticotropic hormone
stimulation after in vitro exposure to o,p
-dichlorodiphenyldichloroethane (DDD).
So, toxicant-induced death can result from specific and nonspecific effects to or responses of
individuals. This conclusion should create in the reader an anticipation that a diversity of mortality
dynamics exist within groups of exposed individuals. In the next section, the focus will shift to the
nature of these differences among lethally exposed individuals.
9.1.2 LETHALITY DIFFERENCES AMONG INDIVIDUALS
It has been recognized that in bioassays, the least and most resistant individuals in a group show much
greater variability in response than individuals near the median. A good deal of accuracy may therefore
be gained by measuring some average response rather than a minimum or maximum response
(Sprague 1969)
Not surprisingly, toxicologists see variability in the resistance of individuals to lethal agents. Several
factors contribute to this variability including allometric scaling, sex, age, genetics, and random
chance. Even inthe earliestpublications quantifyinglethal effects (e.g.,Gaddum 1933), theinfluences
of these factors were known. Except for random chance, which will be discussed in Sections 9.1.2.1
and 9.1.2.2, these factors will be described briefly here.
Scaling is simply the influence of organism size on structural and functional characterist-
ics (Schmidt-Nielsen 1986). Many relevant processes such as those determining bioaccumulation
(Anderson and Spear 1980), structures such as gill exchange surface area (Hughes 1966), and states
such as metal body burden (Newman and Heagler 1991) are subject to scaling, so it is no surprise
that the risk of death can be influenced by organism size. In fact, allometry, the science of scaling,
is used to quantitatively predict differences in mortality for individuals differing in size (see New-
man (1995) for details). Bliss (1936) developed a general power model that, in its various forms,
currently enjoys widespread use for scaling lethal effects. As an important example, Anderson and
Weber (1975) extended Bliss’s approach to predict the mortality expected in a toxicity test if tested
fish differed in size:
Probit(P) = a −b log(M/W
h
), (9.1)
where Probit(P) = the probit transform
5
of the proportion of exposed fish dying, M = the toxicant
concentration, W = the weight of the exposed fish for which prediction was being made, and h = an
exponent adjusting mortality predictions for fish weight. Hedtke et al. (1982) used Equation 9.1
successfully to quantify the influence of Coho salmon (Oncorhynchus kisutch) size on the lethal
effects of copper, zinc, nickel, and pentachlorophenol. Anderson and Weber (1975) advocated that
this relationship be applied generally; however, some studies such as Lamanna and Hart (1968) show
that not all data sets fit this relationship. As will be discussed later in this chapter, scaling effects on
mortality can also be easily accommodated using survival time modeling, as implemented by many
statistical programs.
5
See Section 9.2.2 for details about the probit transformation.
© 2008 by Taylor & Francis Group, LLC
Clements: “3357_c009” — 2007/11/9 — 12:41 — page 141 — #7
Lethal Effects 141
Sex and age can influence the risk of dying during toxicant exposure. Several studies have shown
differences in sensitivity between the sexes including Kostial et al. (1974) and Newman et al. (1989).
Age is commonly an important factor determining sensitivity of toxicants (e.g., Hogan et al. 1987)
although its influence isoftenconfounded by its positive correlation withsize. Acursory reviewofthe
previous chapters should reveal important biochemical, physiological, and anatomical differences
that could give rise to sex- and age-dependent sensitivities. Some of these differences can produce
unexpected results in combination. As an example, Williamson (1979) found that age and size of
the land snail (Cepaea hortensis) had opposite effects on cadmium accumulation and probably the
adverse effects of this toxic metal.
As a quick glance ahead to Chapters 16 through 18 will confirm, many opportunities exist
for genetic qualities to contribute to tolerance differences.
6
There is no need to discuss genetic
tolerance further at this point except to point out that one example described in Box 18.1 can be
linked to the GAS. In that example, mosquitofish differed in the genetically determined form of
a glycolytic enzyme(glucosephosphate isomerase) that ispivotalin the processing ofglucose through
metabolic pathways. Glucosephosphate isomerase-2genotypesdiffered intheir survival probabilities
under stress and these differences were correlated with those in changes in glycolytic flux under
general stress. Downward in the biological hierarchy, explanation for these response differences
could notionally be linked to syntoxic hormone (glucocorticoid) responses in which blood glucose
increases under stress. As done in Chapter 16, the glucosephosphate isomerase genotype differences
during stress can also be projected upward in the biological hierarchy as one mechanism contributing
to phenotypic plasticity and associated changes in life history strategies.
9.1.2.1 Individual Effective Dose Hypothesis
On this theory, the dosage-mortalitycurve isprimarilydescriptive ofthe variation insusceptibility between
individuals of a population the susceptibility of each individual may be represented by a smallest dose
which is sufficient to kill it, the individual lethal dose.
(Bliss 1935)
The distributions of the individual effective doses and the results of the tests are in most cases
“lognormal”
(Gaddum 1953)
In modeling lethal effects, the variation in response among tested individuals is most often explained
in the context of the individual effective dose or lethal tolerance hypothesis. The two quotes above
present the essential features of this hypothesis. There is a minimum dose (or concentration) that is
characteristic of each individual in a population at or above which it will die, and below which
it will survive under the specified exposure conditions. For most populations, the distribution of
such tolerances is believed to be described best by a log normal distribution with some individuals
being very tolerant (Figure 9.3). Early toxicologists conjectured mechanisms for differences based
on the then-popular Weber–Fechner Law
7
or conventional adsorption laws such as the Langmuir
isotherm model. The context from which these conjectures emerged was conventional laboratory
toxicity testing in which most variables such as animal age, sex, and size were controlled, so the
tolerance differences being explained were inherent—perhaps genetic—qualities. However, because
conventional ecotoxicity test data are generated for diverse inbred laboratory lines or field-collected
6
See Mulvey and Diamond (1991) for a general review.
7
Afield called psycho-physics emerged during the first half of the nineteenth century in an attempt to quantify the intensity
of human sensation resulting from a stimulus of a specified magnitude. The Weber–Fechner Law of psycho-physics states that
the magnitude of the sensation (expressed on an arithmetic scale) increases in proportion to the logarithm of the stimulation.
Extending this law, early toxicologists related the magnitude of toxic response to the logarithm of the dose or exposure
concentration.
© 2008 by Taylor & Francis Group, LLC
Clements: “3357_c009” — 2007/11/9 — 12:41 — page 142 — #8
142 Ecotoxicology: A Comprehensive Treatment
Proportion dying (P)
ln exposure concentration
P = .50
P = .50
P = .84
P = .16
Mean
−1 SD +1 SD
cdf
Frequency
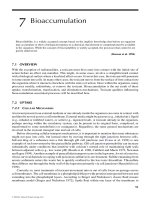
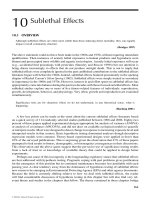
FIGURE 9.3 The upper panel shows the typical sigmoid concentration- (or dose-) mortality curve. The
logarithm of the exposure concentration is plotted on the x-axis against the proportion of individuals dying
during the exposure (P). This sigmoid curve can be described as a cumulative density function (cdf, upper
panel) in which P = .16, .50, and .84 correspond to approximately –1 standard deviation below the mean, the
mean, and +1 standard deviation above the mean. The antilogarithm of the x-value associated with P = .50 is
an estimate of the median lethal concentration (LC50) or dose (LD50). The bottom panel shows the same data
expressed as a probability density function, that is, as the conventional normal “bell curve.” The cumulative
area to the left of the mean is .50, corresponding to P = .50 in the cdf above.
individuals, it is difficult to imagine a genetic mechanism that consistently produced a log normal
distribution of tolerances for most populations and toxicants. Mono- and multigenetic differences in
tolerance (see Chapters 17 and 18) could produce a variety of distributions from ecotoxicity testing.
Moreover, some conventional tests use metazoan clones (e.g., Daphnia magna or Lemna minor)or
unicellular algal or bacterial cultures. It is difficult to invoke a genetic mechanism that produces
a log normal distribution of tolerances for these diverse clones, laboratory strains, and field-caught
individuals. It is more plausible that phenotypic plasticity (see Chapter 16) might generate variability
in many of these cases but there does not seem to be a clear mechanism associated with phenotypic
plasticity that would consistently produce a log normal distribution of tolerances. Regardless, this
concept of a log normal distribution of inherent tolerance differences in all test populations was the
first, and remains the dominant, explanation presented in the current ecotoxicology literature.
9.1.2.2 Probabilistic Hypothesis
If it is seriously believed that there is some physical property more or less stably characterizing each
organism, which determines whether or not it succumbs, then it is justifiable to advance the hypothesis
of tolerances. In that case one should be prepared to suggest the nature of this characteristic so that
© 2008 by Taylor & Francis Group, LLC
Clements: “3357_c009” — 2007/11/9 — 12:41 — page 143 — #9
Lethal Effects 143
the hypothesis may be capable of corroboration by independent experiments. If on the other hand the [log
normal] formulation is only that of a “mathematical model” then it would be [better] not to create any
hypothetical tolerances
(Berkson 1951)
This quote by Berkson precedes his counterargument that it is better to apply a log logistic model than
a log normal one to toxicity data. But, more generally, it is an eminently reasonable point that remains
inadequately addressed more than half a century later (see Box 12.2 in Chapter 12). Disinterest with
the underlying mechanismby the founders ofmoderntoxicology arises from pragmatismas is evident
in the following quote from Finney’s seminal book (1947):
The validity and appropriateness of the logarithmic transformation in the analysis of experimental
data are not dependent on the truth or falsity of any hypotheses relating to adsorption; use of the log
concentration requires no more justification than it introduces a simplification into the analyses.
In his arguments, Berkson (1951) related one experiment involving human tolerances to high
altitude conditions that did not support the individual tolerance hypothesis, suggesting instead that
differences in individual tolerances during testing were mostly random. Such a conclusion gives
rise to an alternate explanation (probabilistic or stochasticity hypothesis) that most of the variation
among similar individual’s results from a random process (or processes) that is best modeled with
a log normal or a similar skewed distribution. Which specific individual dies within a treatment is
a matter of chance. Nearly half a century later, Newman and McCloskey (2000) tested these two
hypotheses, rejecting the customary assumption that the individual tolerance hypothesis was the
sole explanation for observed differences in response of lethally exposed individuals. The stochasti-
city hypothesis was supported in two cases and the individual tolerance hypothesis in another.
Neither hypothesis alone was adequate to explain the observed differences. Similar conclusions were
recently made by Zhao and Newman (2007) for amphipods (H. azteca) exposed to copper or sodium
pentachlorophenol.
Two questions may have occurred to the critical reader at this point. First, why was the underly-
ing mechanism for a foundation approach in classic toxicology left undefined for so long? Second,
why is an understanding of the underlying mechanism important to the practicing ecotoxicologist?
An inkling of an answer to the first question emerges from statements of prominent toxicologists
of the time such as that of Finney above. Originally, the log normal model was applied to quantify
relative poison toxicity or drug potency so it did not matter what the underlying mechanism was.
Within the context of the laboratory bioassay, one chemical was or was not more potent than another.
Classic toxicology could progress just fine without knowing the reason that data seemed to fit
a skewed distribution. Precipitate explanation was presented without much scrutiny and the methods
were broadly applied in studies of poisons and drugs. Unfortunately, because many ecotoxico-
logists tend to feel that anything good for mammalian toxicologists is good enough for them, it
has been erroneously supposed that the underlying mechanism is also an esoteric issue in eco-
toxicology, the science concerned with effects ranging from those to individuals to those to the
biosphere. The error in this supposition can be shown in several ways but we will illustrate it
here using only population consequences under repeated toxicant exposures. Suppose that a pop-
ulation was exposed for exactly 96 h to a toxicant concentration that kills half of the exposed
individuals. Only the most tolerant individuals remain alive according to the individual tolerance
theory but the stochasticity hypothesis would predict that, after recovery, the tolerances of the
survivors will be the same as those of the original population. During a second exposure, the
concentration-response curve could be very different (individual tolerance theory) or the same
(stochasticity theory) as that for the original population during the first exposure. Indeed, dur-
ing a sequence of such exposures, the survivors would drop in numbers by 50% during the first
exposure and then remain at that number under the individual tolerance hypothesis but would drop
© 2008 by Taylor & Francis Group, LLC
Clements: “3357_c009” — 2007/11/9 — 12:41 — page 144 — #10
144 Ecotoxicology: A Comprehensive Treatment
Proportion dying (P )
ln exposure concentration
Threshold
model
Spontaneous
mortality model
Hormesis
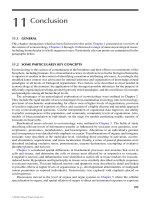
FIGURE 9.4 Conventional sigmoid and sigmoid models with spontaneous (natural) mortality or
a dose/concentration threshold. The inset illustrates hormesis at sublethal concentrations.
down 50% with each exposure under the stochasticity hypothesis. The likelihood of local popu-
lation extinction is quite different depending on which hypothesis is most appropriate or if both
manifest in combination. Knowing which hypothesis is correct should be important to the ecotoxic-
ologist attempting to predict population and associated community changes resulting from multiple
exposures.
9.1.3 SPONTANEOUS AND THRESHOLD RESPONSES
The model shown in Figure 9.3 can have an additional feature in some cases. If the test involves
a prolonged exposure relative to the longevity of the test organism or tested life stage of the organism,
there can be a certain level of spontaneous (natural) mortality. Unfortunately, in still other cases in
which the husbandry of the test species is imperfect, there may be background mortality associated
with the general stress placed on the test organisms. In these cases, the mortality curve will take on
an additional feature as shown in Figure 9.4.
Another change in Figure 9.3 is required if a threshold concentration or dose is characteristic
of a chemical agent (Cox 1987). Like the minimum time-to-death described in Section 9.1.1, some
toxicity test data appear to have a minimum concentration or dose that must be exceeded before any
deaths occur in the test treatments (Figure 9.4).
9.1.4 HORMESIS
The nature of toxicologically-based dose-response relationships has a long history that is rooted in the
development and interpretation of the bioassay. While the general features of the bioassay were clearly
established in the 19th century, the application of statistical principles and techniques to the bioassay is
credited to Trevan and the subsequent contributions of Bliss and Gaddum [which] described the nature
of the S-shaped dose-response relationship and the distribution of susceptibility within the context of the
normal curve Despite this long history of the S-shaped dose-response relationship, a substantial
number of toxicologically-based publications from the 1880s to the present indicate that biologically
relevant activity may occur below the NOAEL
8
(Calabrese and Baldwin 1998)
8
The NOAEL (no observed adverse effect level) is a statistically derived measure often used to imply a threshold
concentration or dose below which no effect will be observed. See Chapter 10, Section 10.3 for more detail.
© 2008 by Taylor & Francis Group, LLC
Clements: “3357_c009” — 2007/11/9 — 12:41 — page 145 — #11
Lethal Effects 145
As described in the above quote, the sigmoid model that emerged out of a long history of bioassay
research has gained a well-deserved place in the mammalian and ecological toxicology literatures.
However, its prominence comes at the expense of some important features. One such example has
already been discussed (i.e., the weak foundation for the oft-assumed individual tolerance theory).
Another is associated with the lower end of the dose/concentration–(lethal or sublethal) effect model.
Hormesis is the apparent stimulatory effect of a toxicant at subinhibitory concentrations or doses.
With hormesis, the sigmoid curve is not monotonic and, instead, drips down at very low doses or
concentrations (Figure 9.4). Superficially, hormesis might seem counterintuitive. How can a small
amount of a poison be “good” for an exposed individual? However, as we have seen, a stressor can
evoke the GAS or some other process, creating the potential for overcompensation at low levels. To
use Selye’s terms, it can produce a state of heterostasis in which one aspect of fitness is conditionally
enhanced. In Chapter 16, related shifts in phenotypes such as those associated with life history
strategies under harsh environmental conditions, also provide a rationale for such “stimulation”
under subinhibitory doses or concentrations.
Hormesis has been recognized for some time, being established at various periods under the
labels of Arndt-Schultz law or Hueppe’s rule; however, it is only recently being discussed as a
general phenomenon, rather than a surprising oddity. Further discussion of hormesis and associated
models can be found in Calabrese et al. (1987), Calabrese and Baldwin (1998, 2001), and Sagan
(1987).
9.1.5 T
OXICANT INTERACTIONS
To this point, the lethal effects of single toxicants have been emphasized, but many expos-
ures involve simultaneous exposure to several toxicants that can interact. There are two tra-
ditional vantages for discussing the joint action of toxicants: mode of action and additivity
based.
Relative to mode of action, toxicants are said to have similar joint action if they act through
the same mechanism. The joint lethal effects of two similarly acting toxicants can be predicted
by knowing the dose or concentration of each toxicant and adjusting these concentrations for the
relative potencies of each (Finney 1947). If toxicants have independent joint action, they have
different modes of action and prediction of mixture effects is not as straightforward. In instances
of potentiation, one chemical that is not toxic under the exposure conditions being considered can
worsen—potentiate—the effect of another chemical. Synergistic action is the final joint action mode
for which prediction is possible only after one has a sound understanding of the means by which
one toxicant synergizes (increases) or antagonizes (decreases) the action of the other. Antagonism
between chemical agents can result from a variety of mechanisms. Afunctional antagonism occurs if
the two chemicals counterbalance one another by affecting the same process in opposite directions.
Two chemicals combine to form a less potent product with chemical antagonism. Dispositional
antagonism involves chemicals that influence the uptake, movement or deposition within the body,
or elimination of each other in a way that lessens their joint effect. Finally, receptor antagonism
occurs if one chemical blocks the other from a receptor involved in its action and, in doing so, lowers
its ability to adversely affect the exposed organism.
Mixture treatment in terms of additivity is based on deviations from simple addition of two
or more toxicant effects. Two or more chemicals are said to be (effect) additive if their combined
effect in mixture is simply the sum of the effects expected for each if each were administered
separately. If their effects together are less than additive, they are said to be acting antagonistic-
ally. If their effects together are greater than additive, they are said to be acting synergistically.
This approach will not be described in further detail because it provides less potential for linkage
between suborganismal and organismal population-level effects than the vantage based on mode of
action.
© 2008 by Taylor & Francis Group, LLC
Clements: “3357_c009” — 2007/11/9 — 12:41 — page 146 — #12
146 Ecotoxicology: A Comprehensive Treatment
9.2 QUANTIFYING LETHALITY
9.2.1 G
ENERAL
In 1927 Trevan drew attention to the fact that the threshold dose [of a drug] varies enormously even when
the animals are as uniform as possible, and proposed that toxicity testing should be based on the median
lethal dose, which kills 50 per cent of the animals.
(Gaddum 1953)
The toxicity test methods employed by modern ecotoxicologists have their roots in mammalian
toxicology, where the aim was to determine the relative toxicity of poisons or relative potencies
of drugs (e.g., Bliss and Cattell 1943). In contrast, results of toxicity testing are used by the eco-
toxicologist to infer consequences to valued individuals, populations, and ecological communities.
Borrowing methods from classical toxicology accelerated the establishment of ecotoxicity tests
when they were sorely needed. Unfortunately, the differences in goals in applying these methods
led to the amassing of interpretive incongruities, lethality metrics that are less useful than other
metrics, and consequently, a habit of being reluctantly satisfied with weak scientific inferences about
lethal consequences. The strong and weak points of the conventional approach will be described in
Section 9.2.2.
9.2.2 DOSE or CONCENTRATION–RESPONSE MODELS
QUANTIFYING LETHALITY
9
Awell-establishedapproachexists forquantifyinglethal effects fromdatasets ofconcentrationversus
proportion of exposed individuals dying. The most common is the log normal model discussed above
which involves log transformation of the concentration and then fitting of the data to the following
model (Finney 1947):
P =
1
σ
√
2
x
0
−∞
e
−
1/2σ
2
(x−µ)
2
dx, (9.2)
where P = the proportion expected to die, x
0
= the concentration for which predictions are being
made, µ = the mean, and σ = the standard deviation.
Early in the formulation of quantitative methods for dealing with concentration-effect data, there
was a need to transform data into terms that could easily be dealt with using simple logarithm tables
and mechanical adding machines. The model above was transformed accordingly by expressing the
proportions responding in units of standard deviations from the mean of the normal distribution.
10
The name given to this transformed proportion was the normal equivalent deviation (NED). This
transformation still resulted in some computational inconvenience at that time because NED values
for proportionsbelow 0.5 werenegative numbers. Simply toavoid negativenumbersin computations,
five was added to the NED to produce the probit transformation: Probit(P) = NED(P) +5. Aplot of
NED or probit versus log concentration should produce a straight line if the log normal model was
appropriate for a data set. Now, using some method such as maximum likelihood estimation, these
types of data could be fit to a model such as the following:
Probit(P) = a +b(log C) + ε (9.3)
9
For convenience, concentration will be used in discussions in this section although both dose and concentrations can be
applied in the described data analysis methods.
10
That is to say the data are normally distributed when the logarithm of the concentration is used instead of concentration.
© 2008 by Taylor & Francis Group, LLC
Clements: “3357_c009” — 2007/11/9 — 12:41 — page 147 — #13
Lethal Effects 147
where C = the exposure concentration, a = an estimated regression intercept, and b = an estimated
regression parameter accounting for the influence of exposure concentration. Because no advantage
exists forusingthe probit transformafter the advent ofmodern computers, models also areformulated
using the NED instead oftheprobit. Nonlinear fitting can also bedone with standard software without
any computational difficulty.
The simple generalized model can be specified based on the cumulative normal function (( )),
11
P = [a +b(log C)]. (9.4)
Spontaneous mortality (P
S
= the proportion of unexposed individuals dying) can be included in
this model. If P ≥ P
S
,
P = P
S
+(1 −P
S
)((a +b(log C))) (9.5)
and P = P
S
at C = 0. A lethal threshold can also be included in Equation 9.4 for concentrations (C)
greater than the threshold concentration (C
T
),
P = {a +b[log(C −C
T
)]}. (9.6)
The P approaches 0 if C ≤ C
T
for this model. This model can be modified further to include
natural mortality (e.g., Equation 9.5) in which case P = P
S
if C ≤ C
T
. Including hormesis in these
models is more involved but can be done as demonstrated by Bailer and Oris (1994).
Several other functions are commonly fit to these kinds of data. Those associated with the log
logistic (or logit) model are the most common alternatives to the log normal functions just described.
Conventionally, the log odds or logit transformation is applied:
Logit(P) = ln
P
1 −P
. (9.7)
For historical reasons of convenience such as those just described for the probit transform, this
logit is often transformed further to avoid negative numbers and to produce values similar to probit
values:
Transformed logit =
Logit(P)
2
+5. (9.8)
A less common, but very useful, transformation is the Wiebull transformation:
Wiebit(P) = ln [−ln(1 −P)]. (9.9)
Christensen (Christensen 1984, Christensen and Nyholm 1984) used the Wiebull function very
effectively in modeling ecotoxicity effects. The next most commonly applied is the Gompertz or
extreme value function (Gompit transformation). Newman (1995) provides an example of applying
a Gompertz model to ecotoxicity data. All of these models can be applied to concentration-lethal
response data after appropriate substitutions into Equations 9.4 through 9.6.
11
Toillustratetheeaseto which these calculations cannow be done,invoking the Excel™ functionNORMINV(Probability,
Mean, Standard Deviation) where Probability = the proportion for which the calculation is to be done, Mean = the distri-
bution mean, and Standard Deviation = the distribution standard deviation, calculates the NED if mean = 0 and standard
deviation = 1, that is, for the unit normal curve, N(0,1). As an example, NORMINV(.84134474,0,1) will return 1. The
following function would return the probit, NORMINV() +5.
© 2008 by Taylor & Francis Group, LLC
Clements: “3357_c009” — 2007/11/9 — 12:41 — page 148 — #14
148 Ecotoxicology: A Comprehensive Treatment
Concentration–lethal
effect data
Assume model?
No
Ye s
Trimming
desired?
No
Ye s
Spearman–Karber
method
Trimmed Spearman–
Karber method
Spontaneous mortality,
threshold, or hormesis
present?
No
Ye s
Assume
best model
known?
Ye s
No
Compare and select
best model with
goodness-of-fit
statistic (e.g.,
2
)
Maximum likelihood
estimation (MLE)
MLE fit to
the appropriate
model
FIGURE 9.5 Methods for estimating LC50 and associated confidence limits from dose/concentration versus
proportion dying data sets. Although not shown in the diagram, these summary statistics can be eked out of data
sets in which all of the treatments had either complete or no mortality at all. A binomial method can provide an
estimate for such data sets with no partial kills.
Parametric and nonparametric methods exist for analyzing data from concentration-lethal
response tests. Many can also be applied for nonlethal effects. Each (Figure 9.5) carries advantages
and disadvantages. The best methods can be applied if one assumes an explicit model. The presence
of spontaneous or threshold mortality, or hormesis requires a model incorporating these features.
Such more complicated models are available that use maximum likelihood methods to estimate the
associated model parameters and lethality metrics such as the LC50. Most concentration-lethal effect
data are analyzed using simpler models that assume a specific model. If there is no a priori reason to
select one model over another, for example, log normal over the log logistic, Gompertz, or Weibull,
the data can be fit to all of the candidate models and then the results compared. Comparison usually
involves plotting the actual dataandmodel predictions, and also calculating agoodness-of-fit statistic
such as the χ
2
-statistic. The model providing the best fit is selected for estimating model parameters
and predicting metrics such as the LC50 and its 95% fiducial (confidence) limits. Nonparametric
methods can be used to estimate the LC50 and 95% fiducial limits if an acceptable model was not
apparent. The Spearman–Karber method, with or without trimming, is the most commonly applied
nonparametric approach. Most applications of the Spearman–Karber approach conform to recom-
mendations of Hamilton et al. (1977), especially those about trimming rules. In some applications
of toxicity testing, there are no partial kills: each treatment in the test has either no mortality or
complete mortality. Stephan (1977) suggested that an LC50 and associated confidence limit could
be estimated from such data using a binomial method. Essentially, the LC50 can be estimated from
the highest concentration treatment with no mortality (C
NO
) and the lowest concentration treatment
with complete mortality (C
ALL
),
LC50 =
C
NO
C
ALL
. (9.10)
© 2008 by Taylor & Francis Group, LLC
Clements: “3357_c009” — 2007/11/9 — 12:41 — page 149 — #15
Lethal Effects 149
The interval from C
NO
to C
ALL
is at least the 95% confidence interval for the LC50 if the number
of individuals exposed in each treatment was five or more. He suggests that the exact percentage for
the estimated confidence interval is the following if the same numbers of individuals were exposed
in the C
NO
and C
ALL
treatments:
Coefficient = 100[1 −2(0.5)
n
], (9.11)
where n is the number of individuals in the treatment. If the numbers of individuals were different
for the C
NO
(n
NO
) and C
ALL
(n
ALL
), the following equation is used:
Coefficient = 100[1 −(0.5)
n
NO
−(0.5)
n
ALL
]. (9.12)
Models for joint action of toxicants in mixture build upon these models. If two independently
acting chemicals, A and B, were combined at specific concentrations in an exposure solution, the
proportion dying (or probability of dying) of individuals exposed to the mixture (P
A+B
) can be
predicted from the proportion/probability of death if the individuals were exposed to A alone at the
specified concentration (P
A
) and the proportion/probability of death if the individuals were exposed
to B alone at the specified concentration (P
B
).
P
A+B
= P
A
+P
B
(1 −P
A
) = P
A
+P
B
−P
A
P
B
. (9.13)
The reason P
A+B
is not simply the sum of P
A
and P
B
is easily understood in terms of probab-
ilities.
12
If an outcome can result from two independent processes with associated probabilities of
P
A
and P
B
, the probability of the event occurring is defined by Equation 9.13. The term, –P
A
P
B
,is
needed to adjust for the fact that, if an organism dies from A, it is not available to die from B. This
model can be expanded to include many toxicants:
P
A+B+C+···
= 1 − (1 −P
A
)(1 −P
B
)(1 −P
C
) ··· . (9.14)
A slightly different model is required if the two toxicants in mixture display similar action.
To implement this approach, Finney (1947) noted that toxicity curves are parallel for toxicants
with similar action. The influence of each toxicant alone could be modeled with a conventional
probit model and then the two models combined as shown below to predict the joint effect. Let
Equations 9.15 and 9.16 be the probit (i.e., log normal) models for each toxicant alone:
Probit(P
A
) = Intercept
A
+Slope(log C
A
), (9.15)
Probit(P
B
) = Intercept
B
+Slope(log C
B
). (9.16)
The log of the relative potency of A and B (log ρ) can be estimated from these two models:
log ρ
B
=
Intercept
B
−Intercept
A
Slope
. (9.17)
This relative potency measure can now be used to combine both toxicants into one model:
Probit(P
A+B
) = Intercept
A
+Slope ·log(C
A
+ρ
B
C
B
). (9.18)
More similarly acting toxicants can be included in the model using the appropriate relative
potencies.
12
This is a simple case of the general probability law of independence.
© 2008 by Taylor & Francis Group, LLC
Clements: “3357_c009” — 2007/11/9 — 12:41 — page 150 — #16
150 Ecotoxicology: A Comprehensive Treatment
9.2.3 TIME–RESPONSE MODELS QUANTIFYING LETHALITY
Uncertainty enters predictions of exposure consequences because all field exposure durations are not
identical to those set in the concentration-effect tests described in the last section. As discussed at the
beginning of this chapter, an argument of convenience was made that most acute mortality manifests
within a specific time and the LC50 value for that duration is sufficient for predicting effects at all
other acute exposures. After frequent repetition, but weak scrutiny, such arguments have become
generally accepted.
Concerning acute toxicity to fish, there seems to be a working consensus that it occurs within the first
100 hr of exposure Of 375 cases [examined], 211 or 56 per cent showed a lethal threshold in 4 days
or less. Only 42 cases are clearly longer than 4 days The overall distribution tends to substantiate that
4 days is a reasonable limit of occurrence of acutely lethal toxicity of most pollutant [but] Caution in
generalizing too much from these results is particularly necessary since such a tabulation may apparently
be easily biased.
(Sprague 1969)
What was really being advocated in this and similar statements that emerged during a period
when environmental issues required immediate, pragmatic solutions? A critical reading of Sprague’s
argument indicates that 4 days was not sufficient for 4 of 10 tests. Sprague also indicates that con-
siderable data used in his tabulations came from static toxicity tests. The exposure solutions were
not changed in these static tests and, therefore, it is very plausible that the toxicant concentrations
dropped substantially during the test.Although Sprague’s inference was weak, he attempted respons-
ibly to address the expediency of establishing a way to approach very real and immediate problems: it
was a pragmatic stance that early ecotoxicologists accepted in order to move forward. Unfortunately,
the position is still taken uncritically in the current literature and applied to problems requiring much
more certitude than it can afford. Important studies that try to relate LC50 values derived for one
duration to consequences of importance to ecotoxicologists and risk assessors at other durations are
still done (e.g., Stark 2005).
Slight changes to the conventional concentration/dose-lethal effect framework allow the ecotox-
icologist to obtain the increasingly essential informationaboutexposureduration effects. Proportions
dying in each treatment might be noted at several times during a test and LC50 values estimated
for each; however, the estimates might be suboptimal for many durations because the test treatment
concentrations are normally selected to give the best distribution of responses atoneduration. Classic
toxicological approaches include estimation of LC50 values for a set of durations and then producing
plots such as a logarithm of LC50 versus logarithm of duration to extrapolate from one duration to
another. This involves many tests and organisms if treatment concentrations are optimized at each
duration (see Gaddum (1953), Newman (1995), Sprague (1969) for details). Methods even exist for
extrapolating from the abundant acute lethality metrics to chronic lethal effects using a variety of
approximations (Mayer et al. 1994). Shareware is available to facilitate the associated calculations
(Ellersieck et al. 2003). Recently, Duboudin et al. (2004) used species distributions to do such extra-
polations. However, each of these approaches can fall short of predicting with the necessary certainty
the lethality expected for different exposure durations or the associated mortality rates needed for
population modeling.
Although adequate to address questions posed when they were first established, current methods for
generating andsummarizing mortality dataare inadequatefor answering the complex questionsassociated
with ecological risk assessment. Time to event methods have the potential to improve this situation. The
two critical components of exposure intensity (concentration or dose) and duration, can be included in
the associated predictions.
(Newman and McCloskey 2002)
© 2008 by Taylor & Francis Group, LLC
Clements: “3357_c009” — 2007/11/9 — 12:41 — page 151 — #17
Lethal Effects 151
Originally defined as reaction timeassays, a wide range ofsurvival time or time-to-event methods
that steer clear of many of the shortcomings just described exist. The associated experimental design
is similar to that used in conventional concentration-effect tests except that the time-to-death for each
individual is noted during testing. Time-to-death might be noted as an exact time or as occurring
within an interval such as “between 4 and8hofexposure.” Qualities of individuals (e.g., sex or
size) can also be included in the data set because the response variable (time-to-death) is associated
with individuals instead of the tank or cage of individuals (e.g., proportion dying). The substantial
increase in information afforded for lethality tests by measuring time-to-death instead of proportion
of exposed individuals responding at a specified time has been known since the advent of classic
methods (e.g., Bliss and Cattell 1943). Time is also incorporated directly into the time-to-death
models. Although these methods were underutilized for decades by ecotoxicologists, they are now
being applied increasingly to relevant problems (Crane et al. 2002, Newman 1995, Newman and
Dixon 1996).
Survival analysis can be conducted in a variety of ways that share common characteristics. Most
important, discrete events are noted through time in this approach. Although in the case of death,
the event can only occur once for an individual, other events such as time-to-partition, time-to-
stupification, or time-to-flower can occur several times and can be accommodated in time-to-event
models. Also common is the presence of survivors (nonresponders) at the end of the test. Such
individuals are identified as right censored (i.e., having times-to-death longer than the test duration)
and incorporated into the models accordingly. Because it is common to have censored individuals,
most survival time models are fit by a computationally intense method such as maximum likelihood
estimation. If times-to-death were noted within wide intervals for logistical reasons, the associated
times-to-death are recorded as having occurred within the interval instead of at a particular moment.
Maximum likelihood methods can accommodate such interval censoring.
Nonparametric, semiparametric and fully parametric survival methods exist for analyzing time-
to-death data sets (Figure 9.6). All of these methods are described in detail elsewhere and are only
described here enough for the reader to understand the general advantages and disadvantages of
Time-to-event
data
Assume model?
Assume only
proportional hazards
or fully parametric model?
No Yes
Product-
limit or
life table
analysis
Cox
proportional
hazards
analysis
Not
full
Full
Proportional
hazards?
Ye s
No
Model:
exponential
Weibull
Model:
normal,
log normal,
gamma, etc.
FIGURE 9.6 Methods for analyzing time-to-event data including nonparametric, semiparametric and fully
parametric methods.
© 2008 by Taylor & Francis Group, LLC
Clements: “3357_c009” — 2007/11/9 — 12:41 — page 152 — #18
152 Ecotoxicology: A Comprehensive Treatment
each approach. The reader is directed to Miller (1981), Cox and Oakes (1984), Marubini and Grazia
Valsecchi (1995), Newman (1995), and Crane et al. (2002) for more detail.
Nonparametric methods include the Product Limit (also called Kaplan–Meier) and life table
methods. Life table methods will not be described here because they are described in Chapter 15.
The Product Limit approach allows estimation of survival through a time course and the associated
variance for each estimate. The estimated cumulative survival for a group of individuals can be
calculated with the following equation:
ˆ
S(t
i
) =
i
j=1
1 −
d
j
n
j
, (9.19)
where t
j
= a specific failure time, n
j
= the number of individuals alive before and available to
die at t
i
, and d
j
= the number dying at t
j
. Obviously, cumulative mortality (
ˆ
F()) is estimated as
1−
ˆ
S(). The
ˆ
S() is appropriate for all times up to the end of the exposure experiment and is undefined
thereafter. Greenwood’s formula can be used to estimate the variance associated with each estimated
ˆ
S() (or (
ˆ
F()):
ˆσ
2
=
ˆ
S
2
(t
j
)
i
j=1
d
j
n
j
(n
j
−d
j
)
. (9.20)
Nonparametric methods including several rank sum tests are available if differences in survival
curves are to be tested statistically.
Fully parametric methods fit a specific model to the survival time data, allowing data description,
testing for significant effects of covariates, and communication of lethal risk. Afew statistics must be
defined before the different models can be understood. Cumulative mortality at any time (F(t))isthe
number of individuals dead at t divided by the total number of individuals exposed. The cumulative
survival (S(t)) is simply 1 −F(t). The hazard or hazard rate (h(t) = instantaneous mortality rate at
a moment, t) and cumulative hazard (H(t)) can be defined in terms of F(t) and S(t):
h(t) =−
1
S(t)
dS(t)
dt
, (9.21)
H(t) =−ln[1 −F(t)]. (9.22)
A survival model can take the form of a proportional hazard model (Equation 9.23) if hazards
remain proportional through time. For example, if survival curves for males and females are gen-
erated, the proneness to die of one sex might remain proportional by the same amount to the other
throughout the exposure duration. Regardless of exposure duration, one simply uses one proportion
to predict the hazard rate of one sex from that of the other. Similarly, the influence of the logar-
ithm of exposure concentration on h(t) would remain the same through time. The general form of
a proportional hazard model is
h(t, x
i
) = e
f (x
i
)
h
0
(t), (9.23)
where f (x
i
) is some conventional function of the covariate x, and h
0
() is the baseline hazard rate
that is being modified by the covariate. As an example, a linear function of logarithm of exposure
concentration (a+b(log Concentration
i
)) might modify the baseline proneness to die of the exposed
individuals: the rate of mortality is changed by the covariate to the same degree regardless of duration
of exposure.
© 2008 by Taylor & Francis Group, LLC
Clements: “3357_c009” — 2007/11/9 — 12:41 — page 153 — #19
Lethal Effects 153
Box 9.2 Survival of Salted Fish
Newman and Aplin (1992) exposed female mosquitofish (G. holbrooki) to a series of sodium
chloride concentration treatments to illustrate survival modeling of ecotoxicologically relevant
data. Briefly, subsets of female mosquitofish differing in size were exposed to one of six
concentrations of sodium chloride ranging from 10.3 to 20.1 g/L, and time-to-death for fish
recorded at 4-h intervals for 96 h. In addition to the time-to-death for each fish, duplicate tank to
which the fish had been assigned within an exposure treatment, exposure concentration (g/L),
and individual fish wet weight (g) were included in the data set. After nonparametric rank
sum methods testing of survival curves for duplicate tanks detected no significant difference
(α = 0.05), data for duplicate tanks were combined for each treatment concentration and
a parametric survival model generated using a variety of underlying distributions (Newman and
Dixon 1996).
The accelerated failure time model assuming a log logistic model will be used here for
purposes of illustration.
Time-to-death = e
15.2860
e
−4.2129(ln[NaCl])
e
0.2545(ln Wgt)
e
0.2081L
p
,
where L
p
= a value for the log logistic function corresponding with the desired proportion dead
(p) for which the prediction is being made. The units of [NaCl] and Wgt are g/L and g wet
weight, respectively. The L
p
is simply the value obtained if the p was inserted into the logistic
function {ln[p/(1−p)]}. With this model, the proportion of exposed fish dying can be predicted
for combinations of exposure concentration and duration. Given a particular L
p
predicted for
some combination of concentration and duration, the corresponding p dying is calculated from
this relationship or extracted from a table such as Appendix 7 in Newman (1995). In fact, an
entire p response surface for all combinations of concentration and duration (within the tested
ranges) can be generated.
Other useful lethality metrics can be produced. The LC50 can be calculated for any exposure
duration within the tested range by rearranging the model
LC50 =
ln t −15.2860 −0.2545(ln Wgt) −0.2081L
0.5
−4.2129
,
where LC50 =the LC50 for the duration of interest (t), L
0.5
= 0, and Wgt =the wet weight of
the fish for which predictions are being made.
Often, hazard rates do not remain proportional through time and an accelerated failure time
model is more appropriate
ln t
i
= f (x
i
) +ε
i
, (9.24)
where ε = the error term. In this formulation, the time-to-death instead of the hazard rate is being
modified directly by the covariates.
In other cases, it may not be possible or desirable to generate a fully parametric survival
model. For instance, the underlying distribution might be uninteresting but the relative hazards
of tested groups might be important. Specific examples might be a study interested in determining
the relative risk of two populations under different exposure scenarios or a study of the success of
a remediation activity. In both cases, the proportional hazards are the focus, not the nature of the
© 2008 by Taylor & Francis Group, LLC
Clements: “3357_c009” — 2007/11/9 — 12:41 — page 154 — #20
154 Ecotoxicology: A Comprehensive Treatment
underlying distribution (h
0
in Equation 9.23). The Cox proportional hazard method is a semiparamet-
ric method that allows one to estimate the proportional hazards without obligating the user to fully
define h
0
.
9.3 LETHALITY PREDICTION
The fundamental premise is that the structure of a chemical implicitly determines its physical and
chemical properties and reactivities, which, in interaction with a biological system, determine its
biological/toxicological properties.
(McKinney et al. 2000)
Often the relative potencies of similar chemicals can be predicted based on their chemical proper-
ties. Which qualities are most useful depends on the chemical class and effects for which predictions
are being made. Examples of such predictions are provided below for lipophilic organic compounds,
ionizable organic compounds, and metal cations. Some of the basic concepts associated with these
examples were provided already in Chapters 3 and 7, and as a consequence, will get only brief
mention here.
9.3.1 O
RGANIC COMPOUNDS AND THE QSAR APPROACH
One of the earliest forms of what would later become known as quantitative structure–activity rela-
tionships (QSARs) (or physicochemical property–activity relationship) is the Meyer–Overton rule.
This rule states that the potency of candidate anesthetics can be quantitatively predicted within a class
of compounds from their oil:water or oil:air partition coefficients. The general theme that bioactivity
or bioavailability of nonpolar organic compounds can be related to lipophilicity has expanded vastly
during the last century to include diverse classes of compounds and species, including description
of deviations from the rule (e.g., Cantor 2001). Even exceptions can be quantitatively predicted
with QSAR that incorporate other molecular qualities. Rich medical, pharmacological, and ecotox-
icological literatures now exist for the QSAR approach (McKinney et al. 2000). Depending on the
class of compounds of interest, these QSAR may require good information about nucleophilicity
(i.e., how readily the compound donates electrons to form a covalent bond), electrophilicity (i.e., how
readily the compound accepts electrons), topology (e.g., molecular connectivity), or steric qualities
(e.g., steric hindrance or total molecular surface area). They use such qualities to predict effects of
specific compounds from a group that shares a common mechanism, such as narcosis, acetylcholin-
esterase inhibition, membrane irritation, or respiratory uncoupling (McKim et al. 1987, Ren 2003,
Schultz and Cronin 2003). Therefore, some knowledge of mode of action is also extremely helpful
for effective QSAR generation. In addition to data about compound qualities and modes of action,
QSAR development requires statistical or mechanistic models to construct and then validate pre-
dictions (Schultz and Cronin 2003). Models vary greatly in complexity. Some modern QSAR use
complex computational models (e.g., 3D-QSAR) to predict potential effects based on availability
and configuration of reactive regions on molecules (Chen et al. 2004, McKinney et al. 2000, Tong
et al. 2003). QSAR are even applied to assess potential interactions as illustrated in the work of
Altenburger et al. (2005) with algae exposed to mixtures of nitrobenzenes. The predictive utility of
QSAR continues to improve as our knowledge of modes of action grows and computational tools
become widespread. A wide range of computer programs that facilitate the implementation of QSAR
in ecotoxicological studies are now available (Moore et al. 2003). Simple and complex QSAR have
become essential tools in many regulatory activities because testing is impossible for all new organic
compounds introduced annually (Zeeman et al. 1995).
© 2008 by Taylor & Francis Group, LLC
Clements: “3357_c009” — 2007/11/9 — 12:41 — page 155 — #21
Lethal Effects 155
Box 9.3 Narcosis by the Numbers
McKim et al. (1987) inferred common modes of action for organic compounds, including nar-
cotics, using distinct physiological and biochemicalshiftsin exposed organisms. They identified
what they called the fish acute toxicity syndrome by multivariate statistical analysis of these
changes. Narcosis was characterized in their fish acute toxicity syndrome scheme by a dramatic
drop in respiratory and cardiovascular functions, and a range of hematological adjustments
to consequent hypoxia. Despite the similarity in symptoms for polar and nonpolar narcotics,
differences in lethality existed in the QSAR developed for fish exposed to these two classes
of narcotics. Adjustment for ionization (see Section 3.10 in Chapter 3) did not always resolve
differences among polar and nonpolar narcotic compounds relative to their lethal potency. How-
ever, one team (Vaes et al. 1998) was able to account for these differences and their approach
is outlined briefly here.
Utrecht University workers generated a nice illustration of the QSAR approach for predict-
ing lethal effects of organic compounds with a narcosis mode of action (Vaes et al. 1998).
This was done by focusing carefully on the differences in partitioning between water and the
phospholipids of the cell membrane. Lethality data (LC50) were collected for guppies (Poecilia
reticulata) and fathead minnows (Pimephales promelas) exposed to polar or nonpolar narcotic
compounds. Consideration of polar and nonpolar narcotics together can require inclusion of the
pK
a
for the polar narcotics but, in this study, conditions where used in which polar compounds
remained unionized. This allowed polar and nonpolar narcotics to be combined into the same
QSAR that focused only on lipid solubilities.
First, as done with many conventional QSAR, the logarithm of each LC50 value for the polar
and nonpolar narcotics was plotted against the logarithm of the corresponding octanol–water
partition coefficient (K
ow
). Two distinct linear relationships became apparent (Figure 9.7): the
unionized polar narcotic compounds were more toxic than nonpolar narcotics with similar
lipophilicities. Reasoning that the K
ow
was not an ideal metric for partitioning of a com-
pound between actual membrane phospholipids and water, Vaes’s group built another QSAR
using a more realistic partition coefficient for the cell membrane. When a partition coef-
ficient for l-α-dimyristoylphosphatidylcholine (DMPC) and water was used, data for all
narcotics (except quinoline) converged into a single line (r
2
= .98). The unionized polar
and nonpolar compounds fit to the same QSAR when a more realistic partition coefficient
was used.
0
–6
–5
–4
–3
–2
–1
Log LC50 (mol/L)
Log partition coefficient
051234
Polar narcotics
Nonpolar narcotics
K
ow
K
ow
K
DMPC
FIGURE 9.7 Partition coefficient-based
QSAR models for polar and nonpolar nar-
cotics based on K
ow
(separate dashed lines)
and K
DMPC
(single solid line). (This figure is
a composite of both panelsof Figure 1 of Vaes
et al. (1998).)
© 2008 by Taylor & Francis Group, LLC
Clements: “3357_c009” — 2007/11/9 — 12:41 — page 156 — #22
156 Ecotoxicology: A Comprehensive Treatment
9.3.2 METALS AND THE QICAR APPROACH
Quantitative structure–activity relationships (QSARs) are applied widely to predict bioactivity (e.g., tox-
icity or bioavailability) of organic compounds. In contrast, models relating metal ion characteristics to
their bioactivity remain underexploited.
(Newman et al. 1998)
As described briefly in Chapters 7 (Section 7.2.3) and 8 (Section 8.2), qualitative rules exist for
predicting trends in metal bioactivity. More than a century ago, Matthews (1904) found that the
ionic form of a metal is generally its most toxic one. This concept later was referred to as the Ionic
Hypothesis. He correlated metal bioactivity with metrics of metal binding to oxygen, nitrogen, or
sulfur donor atoms of biomolecules. A series of researchers (Babich et al. 1986a,b, Biesinger et al.
1972, Binet 1940, Jones 1939, 1940, Jones and Vaughn 1978, Kaier 1980, Loeb 1940, McGuigen
1954, Turner et al. 1985, Willams and Turner 1981) expanded this approach, incorporating a range
of metals, species, and metal qualities into their qualitative models. Most notably, Jones (1939),
Jones and Vaughn (1978), Williams and Turner (1981), and Turner et al. (1985) squarely framed
these trends within the context of fundamental Hard Soft Acid Base (HSAB) theory.
13
All that
remained to be done to produce QSAR-like models for metals was to extract metrics of metal
binding tendencies from the literature and then apply statistical methods to the trends noted by these
early workers. Newman and coworkers (McCloskey and Newman 1996, Newman and McCloskey
1996, Newman et al. 1998, Ownby and Newman 2003, Tatara et al. 1998) did this, using what
they called a quantitative ion character–activity relationship (QICAR) approach. Newman et al.
(1998) and Ownby and Newman (2003) provide a general description of this QSAR-like approach,
discussing the ion characters most useful in producing predictive QICAR models.
Box 9.4 Metal Interactions by the Numbers
As mentioned above, Newman and coworkers described the QICAR approach to quantitatively
predict relative metal bioactivities. Newman and McCloskey (1996) briefly assessed whether
the QICAR approach could be applied to binary metal mixtures. Using a Microtox
®
bioassay,
Ownby and Newman (2003) conducted a more extensive study, applying the concepts associ-
ated with independent action (Equation 9.13). The similarities in binding tendencies between
the paired metals were quantified using the softness index (σ
p
), a measure of the metal ions
tendency to share electrons with ligand donor atoms. Here, these same data are analyzed again
using the following modification of Equation 9.13 in which an interaction coefficient (β)is
added. The interaction coefficient would be 1 if the joint actions of the mixed metals were
perfectly independent. It would deviate from 1 as the joint actions deviated from the assumed
independence of action.
P
A+B
= P
A
+P
B
−βP
A
P
B
. (9.25)
The valueof theinteraction coefficientforpaired metalswas estimatedby fittingEquation 9.25
to data from a series of metal mixture tests (upper panel of Figure 9.8). The x-axis of Figure 9.8
is the absolute value of the difference between the softness indices of the paired metals. A very
13
HSAB theory provides a general scheme for quantifying metal binding tendencies. The hard–soft label has to do with
the propensity for the metal’s outer electron shell to deform during interactions with ligands. TheAclass metals in the periodic
table (IA, IIA, IIIA) tend to be hard relative to the softer b class metals (in periods from Mo to W, and Sb to Bi) (Fraústo
da Silva and Williams 1991, Jones and Vaughn 1978). Hard metals are not as polarizable as soft metals. Other metals are
intermediate to the soft and hard metals. Acid–base refers to the Lewis acid (accepting an electron pair) or base (donating an
electron pair) context for predicting the nature and stability of the metal interaction with ligands.
© 2008 by Taylor & Francis Group, LLC
Clements: “3357_c009” — 2007/11/9 — 12:41 — page 157 — #23
Lethal Effects 157
CuCo
CuNi
CuMn
CuZn
CoZn
NiZn
MnZn
CoMn
CoNi
MnNi
0
0.01 0.02 0.03
Absolute difference in
p
4
3
2
1
0
Interaction coefficient
Absolute difference in slopes
0
1
2
3
MnNi
CoNi
CoMn
MnZn
CuZn
NiZn
CoZn
CuMn
CuNi
CuCo
FIGURE 9.8 A σ
p
-derived QICAR pre-
dicting binary metal effects based on joint
action models for independent (upper panel)
and similar (lower panel) acting toxicants.
(Recalculated using data generated by Ownby
and Newman (2003).)
small absolute difference would indicate very similar binding tendencies for the paired metals
and a very large absolute difference would indicate very dissimilar binding tendencies. On the
basis of the hypothesis that similar binding tendencies result in similar modes of action, Ownby
and Newman reasoned that deviations from perfect independence of the paired metals could be
predicted from the absolute difference in their binding tendencies as quantified with σ
p
. The
data clearly supported this assumption.
The bottom panel was generated from the vantage of similar joint action model. A review
of our discussions about Equations 9.15 through 9.18 should make it clear that paired metals
with similar joint action should have identical slopes. Therefore, the absolute difference in
slopes for the probit models for the paired metals (Equations 9.15 and 9.16) should be very
small for metals with similar joint action but become increasingly larger as the paired metals
deviate from similar joint action. It is also clear from this plot that deviation from similar action
was related to differences in binding tendencies. Although not as clear a relationship as that
based on joint independent action (Equation 9.25), this approach did not require a full mixture
experiment, only the slopes from single metal concentration-response models. So, in general,
metal interactions could be predicted based on binding tendencies using either independent or
similar joint action models.
9.4 SUMMARY
The manner in which lethal effects are addressed was detailed in this chapter. Topics included
underlying mechanisms and dynamics, factors contributing to individual differences in tolerance,
types of models used to quantify mortality, models for predicting lethal effects of toxicant mixtures,
QSAR, and QICAR. Below are some of the major points covered in this chapter.
9.4.1 SUMMARY OF FOUNDATION CONCEPTS AND PARADIGMS
• Lethal effects are characterized as acute or chronic although the distinction is often blurry.
© 2008 by Taylor & Francis Group, LLC
Clements: “3357_c009” — 2007/11/9 — 12:41 — page 158 — #24
158 Ecotoxicology: A Comprehensive Treatment
• It is important to keep in mind that the dynamics by which lethality manifests differ among
modes of action, exposure route, and species. Some exposures display thresholds.
• In addition to death due to conventional toxicant modes of action, diseases of adapta-
tion can result from health-enhancing processes gone awry. Important examples include
processes controlled by syntoxic (e.g., modification of inflammation and consequent
immunocompetence of an individual) and catatoxic (e.g., induction of liver enzymes that
activate toxicants) hormones.
• Size, sex, age, genetic qualities of the individual, and chance can influence the
consequence of lethal exposure.
• The widespread explanation of a log normal variation in individual responses to toxicants
(individual effective dose) should not be assumed true unless shown to be so.
• Hormesis can appear at sublethal or subinhibitory concentrations or doses.
• Antagonism between chemicals in mixture can result from functional, chemical, disposi-
tional, and receptor antagonism.
• The assumption of a log normal (“Probit”) model is the most common approach to quan-
tifying lethal effects for concentration-effect data sets, including those with spontaneous
mortality, a lethal threshold, or hormesis.
• Other models such as the log logistic, Gompertz, or Weibull are also useful for fitting
concentration-effectdata sets. TheSpearman–Karbertechnique isa nonparametric method
for point estimation of LC50. With no partial kills, the binomial method can estimate the
LC50.
• Mixture lethal effects canbe estimated using modelsbasedon independent (Equation 9.13)
or similar (Equation 9.18) action.
• Survival time methods allow optimal inclusion of exposure duration into predictions of
lethal effects. Relative to conventional test methods, they also have higher statistical
power and capacity to include characteristics associated with individual organisms. They
include nonparametric, semiparametric, and fully parametric techniques.
• Molecular structural and physiochemical qualities of organic compounds determine their
partitioning and reactivities. QSAR for lethal potency within classes of organic poisons
can be formulated based on these qualities.
• QICAR can be used to predict relative lethal potency of metals based on metal–ligand
binding theory (e.g., HSAB theory).
REFERENCES
Altenburger, R., Schmitt, H., and Schürmann, G., Algal toxicity of nitrobenzenes: Combined effect analysis
as a pharmacological probe from similar modes of interaction, Environ. Toxicol. Chem., 24, 324–333,
2005.
Anderson, P.D. and Spear, P.A., Copper pharmacokinetics in fish gills—I. Kinetics in pumpkinseed sunfish,
Lepomis gibbosus, of different body sizes, Water Res., 14, 1101–1105, 1980.
Anderson, P.D. and Weber, L.J., Toxic response as a quantitative function of body size, Toxicol. Appl.
Pharmacol., 33, 471–483, 1975.
Babich, H., Puerner, J.A., and Borenfreund, E., In vitro cytotoxicity of metals to bluegill (BF-2) cells,
Arch. Environ. Contam. Toxicol., 15, 31–37, 1986a.
Babich, H., Shopsis, C., and Borenfreund, E., In vitro cytotoxicity testing of aquatic pollutants (cadmium,
copper, zinc, nickel) using established fish cell lines, Ecotoxicol. Environ. Saf., 11, 91–99, 1986b.
Bailer, A.J. and Oris, J.T., Assessing toxicity of pollutants in aquatic systems, In Case Studies in Biometry,
Lange, N., Ryan, L., Billard, L., Brillinger, D., Conquest, L., and Greenhouse, J. (eds.), John Wiley &
Sons, New York, 1994, pp. 25–40.
Benguira, S. and Hontela, A., Adrenocorticotropin- and cyclic adenosine 3
,5
-monophosphate-stimulated
cortisol secretion in interrenal tissue of rainbow trout exposed in vitro to DDT compounds, Environ.
Toxicol. Chem., 19, 374–381, 2001.
© 2008 by Taylor & Francis Group, LLC
Clements: “3357_c009” — 2007/11/9 — 12:41 — page 159 — #25
Lethal Effects 159
Berkson, J., Why I prefer logits to probits, Biometrics, 7, 327–339, 1951.
Biesinger, K.E. and Christensen, G.M., Effects of various metals on survival, growth, reproduction, and
metabolism of Daphnia magna, Can. J. Fish. Aquat. Sci., 29, 1691–1700, 1972.
Binet, M.P., Sur la toxicité comparée des métaux alcalins et alcalino-terreux, C.R. Acad. Sci. Paris, 115,
225–253, 1940.
Bliss, C.I., The calculation of the dosage-mortality curve, Ann. Appl. Biol., 22, 134–307, 1935.
Bliss, C.I., The size factor in the action of arsenic upon silkworm larvae, Exp. Biol., 13, 95–110, 1936.
Bliss, C.I. and Cattell, M., Biological assay, Ann. Rev. Physiol., 5, 479–539, 1943.
Bradbury, S.P., Russom, C.L., Ankley, G.T., Schultz, T.W., and Walker, J.D., Overview of data and conceptual
approaches for derivation of quantitative structure–activity relationships for ecotoxicological effects
of organic chemicals, Environ. Toxicol. Chem., 22, 1789–1798, 2003.
Buikema, A.L., Jr., Niederlehner, B.R., and Cairns, J., Jr., Biological monitoring. Part IV—Toxicity testing,
Water Res., 16, 239–262, 1982.
Cairns, J., Jr., The threshold problem in ecotoxicology, Ecotoxicology, 1, 3–16, 1992.
Calabrese, E. and Baldwin, L.A., Ageneral classification of U-shaped dose-response relationships in toxicology
and their mechanistic foundations, Hum. Exp. Toxicol., 17, 353–364, 1998.
Calabrese, E.J. and Baldwin, L.A., U-shaped dose-responses in biology, toxicology, and public health,
Annu. Rev. Public Health, 22, 15–33, 2001.
Calabrese, E.J., McCarthy, M.E., and Kenyon, E., The occurrence of chemically induced hormesis,
Health Physics, 52, 531–541, 1987.
Cantor, R.S., Breaking the Meyer–Overton rule: Predicted effects of varying stiffness and interfacial activity
on the intrinsic potency of anesthetics, Biophys. J., 80, 2284–2297, 2001.
Chen, D.,Yin, C., Wang, X., andWang, L., Holographic QSARof selectedesters, Chemosphere, 57, 1739–1745,
2004.
Christensen, E.R., Dose–response functions in aquatic toxicity testing and the Weibull model, Water Res., 18,
213–221, 1984.
Christensen, E.R. and Nyholm, N., Ecotoxicological assays with algae: Weibull dose–response curves, Environ.
Sci. Technol., 18, 713–718, 1984.
Cox, C., Threshold dose-response models in toxicology, Biometrics, 43, 511–523, 1987.
Cox, D.R. and Oakes, D., Analysis of Survival Data, Chapman & Hall, London, 1984.
Crane, M., Newman, M.C., Chapman, P.F., and Fenlon, J., Risk Assessment with Time to Event Models, CRC
Press/Lewis Publishers, Boca Raton, FL, 2002.
Duboudin, C., Ciffroy, P., and Magaud, H., Acute-to-chronic species sensitivity distribution extrapolation,
Environ. Toxicol. Chem., 23, 1774–1785, 2004.
Ellersieck, M.R., Asfaw, A., Mayer, F.L., Krause, G.F., Sun, K., and Lee, G., Acute-to-Chronic Estimation
(ACE v 2.0) with Time-Concentration-Effect Models, EPA/600/R-03/107, December 2003. US EPA
Office of Research Development, Washington, D.C., 2003.
EPA, Methods for Measuring the Toxicity and Bioaccumulation of Sediment-associated Contaminants with
Freshwater Invertebrates, 2nd ed., EPA/600/R-99/064, March 2000. NTIS, Washington, D.C.,
2000.
EPA, Short-Term Methods for Estimating the Acute Toxicity of Effluents and Receiving Water to Freshwater and
Marine Organisms, 5th ed., EPA/821/R-02/012, October 2002. NTIS, Washington, D.C., 2002a.
EPA, Short-Term Methods for Estimating the Chronic Toxicity of Effluents and Receiving Waters to Freshwater
Organisms, 4th ed., EPA821/R-02/013, October 2002. NTIS, Washington, D.C., 2002b.
Finney, D.J., Probit Analysis. A Statistical Treatment of the Sigmoid Response Curve, Cambridge University
Press, Cambridge, UK, 1947, p. 256.
Fraústo da Silva, J.J.R. and Williams, R.J.P., The Biological Chemistry of the Elements, Oxford University
Press, Oxford, UK, 1991.
Friedman, E.M. and Lawrence, D.A., Environmental stress mediates changes in neuroimmunological
interactions, Toxicol. Sci., 67, 4–10, 2002.
Gaddum, J.H., Reportson biological standards. III.Methodsof biological assaydepending on aquantal response,
Br. Med. Res. Council Special Report Series, 183, A2–85, 1933.
Gaddum, J.H., Bioassays and mathematics, Pharmacol. Rev., 5, 87–134, 1953.
Gendron, A.D., Bishop, C.A., Fortin, R., and Hontela, A., In vivo testing of the functional integrity of the
corticosterone-producing axis in mudpuppy (Amphibia) exposed to chlorinated hydrocarbons in the
wild, Environ. Toxicol. Chem., 16, 1694–1706, 1997.
© 2008 by Taylor & Francis Group, LLC