ECOTOXICOLOGY: A Comprehensive Treatment - Chapter 17 potx
Bạn đang xem bản rút gọn của tài liệu. Xem và tải ngay bản đầy đủ của tài liệu tại đây (444.74 KB, 26 trang )
Clements: “3357_c017” — 2007/11/9 — 18:42 — page 305 — #1
17
Population Genetics:
Damage and Stochastic
Dynamics of
the Germ Line
Because they offer neither advantage nor liability, neutral mutations are either lost or fixed by stochastic
changes in allele frequency from generation to generation. Thus the evolutionary dynamics of neutral
mutations are adequately described by equations employing population size, N, effective population
size, N
e
, neutral mutation rate, u, and migration rate, m. Neutral theory has had a tremendous impact
on population genetics, and many empirical patterns are consistent with predictions arising from neutral
theory.
(Mitton 1997)
17.1 OVERVIEW
This chapter describes key processes in population genetics other than adaptation and natural
selection. Initial discussion outlines briefly how toxicants can damage DNA and then stochastic
dynamics of population genetics are described. Understanding toxicant effects on stochastic
processes is as important as understanding toxicant-driven natural selection.
Qualities of toxicant-exposed populations can be directly influenced by stochastic or neutral pro-
cesses. “Neutral” is used here only to indicate genetic processes or phenomena not involving natural
selection. Ecotoxicologists often focus on adaptation via natural selection and pay less attention
than warranted to neutral processes. At best, neutral processes are invoked as null hypotheses during
testing for selection. Current applications of such hypothesis tests by ecotoxicologists are prone to
neglect experimentwiseTypeI errors, that is, proneto inappropriately favorthe “statistical detection”
of selection and to reject the neutral theory-based null hypothesis. In the lead chapter of Genetics
and Ecotoxicology (Forbes 1999), Forbes states, “The ten contributions to this volume address a
number of key issues that, taken together, summarize our current understanding of the relationship
between genetics and ecotoxicology.” Despite the clear value of Forbes’s book, this statement is
dismaying. Aside from one chapter discussing genotoxic effects, no chapter focuses primarily on
neutral processes. Several chapters (e.g., Chapter 4) do present discussion of neutral processes but
most retain a predominant theme of selection. In contrast, basic textbooks of population genetics
(e.g., Ayala 1982, Crow and Kimura 1970, Hartl and Clark 1989) contain nearly as much discussion
of neutral processes as adaptation and selection.
This preoccupation of ecotoxicologists biases the early literature by frequent neglect of obvious
alternate explanations for observed changes in exposed populations. To counter this bias and appro-
priately balance discussion of neutral and selection-based processes, discussion of adaptation and
selection will be put off until Chapter 18. Processes leading to a change in the genome, including
genotoxicity, will be discussed and then followed by anticipated changes in allele and genotype
composition in populations owing to genetic drift, population size, isolation, and population struc-
ture. Finally, genetic diversity and the potential influence of toxicants are discussed in the context of
305
© 2008 by Taylor & Francis Group, LLC
Clements: “3357_c017” — 2007/11/9 — 18:42 — page 306 — #2
306 Ecotoxicology: A Comprehensive Treatment
long-term population viability. Genetic diversity and heterozygosity discussions create a conceptual
bridge to selection-based topics in Chapter 18.
17.2 DIRECT DAMAGE TO THE GERM LINE
Spontaneous and toxicant-induced changes in DNA(mutations) have diverse consequences (see also
Section 4.3in Chapter 4). Consequencesof mutationrange frominnocuous to minimalto catastrophic
relative to individual fitness. Temporal scales of impact on the species population can be immediate
(e.g., nonviable offspring from afflicted individuals) or long term (e.g., evolutionary). Effects may
be primarily to the soma, as in the case of carcinogenesis, or to the germ line. In this chapter, effects
to the soma will be ignored and discussions will focus on those to the germ line.
17.2.1 GENOTOXICITY
Genotoxicity, damage to genetic materials by a physical or chemical agent, occurs by several mech-
anisms, but at the heart of most genotoxic events is a chemical alteration of the DNA. This alteration
may be associated with free radical formation near the DNA molecule (e.g., radiation damage) or
direct reaction of a chemical agent with the DNA. The result is a modified DNA molecule that might
not be repaired with absolute fidelity (e.g., base pair changes). DNA damage could result in a single-
or double-strand break. Some instances of chromosome damage can even lead to chromosomal
aberrations, aneuploidy, or polyploidy. The consequence to the germ line is often an adverse genetic
change.
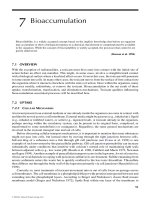
Genotoxicants modify DNA by several mechanisms (Burdon 1999). Some toxicants alkylate
the DNA molecule (Figure 17.1). The locations most prone to react with electrophilic alkylating
groups are position 2, 3, and 7 nitrogens and position 6 oxygen of guanine; position 1, 3, 6, and 7
nitrogens of adenine; position 3 and 4 nitrogens and position 2 oxygen of cytosine; and position 3
nitrogen and positions 2 and 4 oxygens of thymine (Burdon 1999). Monofunctional alkylating agents
(e.g., ethyl methane sulfonate in Figure 17.1 or ethylnitrosourea) bind covalently to only one site.
Bifunctional alkylating agents (e.g., sulfur mustards) or the antitumor agent, cis-[PtCl
2
(NH
3
)
2
] bind
to two sites, potentially crosslinking the two DNA strands. Metabolites of other xenobiotics can
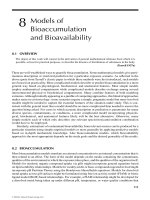
also bind to DNA to form adducts, covalently bound chemical additions to the DNA (Figure 17.2).
For example, benzo[a]pyrene is rendered more water soluble by a series of Phase I detoxification
transformations, but some products of Phase I detoxification (e.g., diol epoxide) readily bind with
the nitrogenous bases of the DNA molecule.
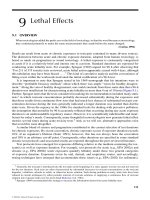
Chemicals and ionizing radiation that produce free radicals (Figure 17.3) can modify both the
bases and deoxyribose of the DNA molecule. Depending on the nature of the compound or radiation,
the result might be a single- or double-strand break in the DNA. As illustrated in Figure 17.3, the
reaction with deoxyribose results in a DNA single-strand break. Some forms of radiation can release
large amounts of energy in short ionization tracks as they pass through tissue and interact with water
molecules. This results in high local concentrations of free radicals and consequent high levels of
breakage in a local region. This increases the chances of a double-strand break. Class b metals
such as bismuth, cadmium, gold, lead, mercury, and platinum also bind covalently to N groups in
the DNA molecule (Fraústo da Silva and Williams 1993). This binding and associated DNA damage
enables the medical use of bismuth, gold, and platinum as antitumor agents. The Pt(NH
3
)
2+
2
of the
antitumor agent, cis-[PtCl
2
(NH
3
)
2
] avidly binds to DNA by forming two covalent bonds with bases
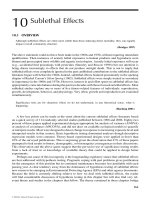
within and between the DNA strands (Fraústo da Silva and Williams 1993). Metals also influence
the hydrogen bonding between DNA strands (Figure 17.4) and, because this hydrogen bonding is
crucial to proper pairing of complementary bases, can either enhance or reduce the accuracy of
base pairings. Metals can also generate free radicals from molecular oxygen via redox cycling and
© 2008 by Taylor & Francis Group, LLC
Clements: “3357_c017” — 2007/11/9 — 18:42 — page 307 — #3
Population Genetics: Damage and Stochastic Dynamics of the Germ Line 307
1
7
3
N
C
C
C
HN
C
N
O
6
N
H
CH
H
2
N
H
2
N
H
2
Guanine
N
C
C
C
HN
C
N
O
N
H
CH
O-6-ethylguanine
C
CH
3
O
O
H
3
C
C
H
2
O
S
CH
3
Ethyl methane sufonate
Pyrimidine
Pyrimidine
P
S
B
P
S
B
P
S
P
S
B
Purine
P
S
B
P
S
B
Pyrimidine
P
S
B
P
S
B
P
S
B
P
S
B
Pyrimidine
P
S
P
S
B
Purine
Single strand
of DNA
8
2
4
5
6
9
FIGURE 17.1 The modification of the purine base, guanine, by the alkylating agent, ethyl methane sulfonate.
The DNA molecule (left shaded box: P=phosphate, S =deoxyribose sugar, B =purine or pyrimidine base) is
modified at the nitrogenous base by such alkylating agents. Here guanine is covalently linked to an alkylating
compound with only one site for potential binding. Guanine alkylated at the position 6 oxygen as shown here
often mispairs with thymine and leads to a G:T→A:T transition sequence (Hoffman 1996). (With a transition,
one purine is replaced by another or one pyrimidine is replaced by another.) DNA alkylation can also lead to
base loss. For example, an alkyl adduct at position 7 nitrogen of guanine weakens the bond between the base
and deoxyribose, and promotes base loss.
can interfere with transcription of DNA to RNA by binding to associated molecules. All of these
mechanisms result in varying degrees and types of DNA damage. Although cells have several DNA
repair mechanisms, some damage is more readily repaired than others. Mutations not repaired are
perpetuated via the DNA replication process. The result is a wide range of potential modifications
to the germ line.
17.2.2 REPAIR OF GENOTOXIC DAMAGE
Several mechanisms for DNA repair and damage tolerance have been described. For example,
pyrimidine dimers formed during exposure to ultraviolet (UV) light may be enzymatically repaired.
Photolyase cleaves these dimers and returns the DNA to its original state. A damage tolerance
mechanism for these dimers allows the replication process to skip over the dimer and proceed
normally in its presence. A gap is created in the new DNA strand that is filled later by repair
mechanisms. This process also allows replication and subsequent repair in the presence of damage
in the presence of DNA adducts.
Alkyltransferases are capable of removing alkyl groups from modified bases (e.g., the ethyl group
attached to guanine atposition 6 oxygen in Figure17.1). Burdon (1999) indicates that, because alkyl-
transferase is inactivated by binding of the alkyl group to cysteine, cells have finite repair capacities.
Repair is overwhelmed beyond a certain level of exposure and alkylation damage accumulates.
Examples of repair by excision (Bootma and Hoeijmakers 1994) have been described for coping
with larger adducts: damaged bases are removed and proper bases are inserted back into the DNA.
© 2008 by Taylor & Francis Group, LLC
Clements: “3357_c017” — 2007/11/9 — 18:42 — page 308 — #4
308 Ecotoxicology: A Comprehensive Treatment
N
C
C
C
HN
C
N
O
N
H
HC
H
2
N
Guanine
HO
C
C
C
C
C
C
C
C
C
C
C
C
C
C
C
C
C
C
C
C
O
HO
C
C
C
C
C
C
C
C
C
C
C
C
C
C
C
C
C
C
C
C
Benzo[a]pyrene
Diol epoxide
N
C
C
C
HN
C
N
O
N
H
HC
HN
C
C
O
H
C
C
C
C
C
C
C
C
C
C
C
C
C
C
C
C
C
C
HO
Adduct to guanine
Detoxification
Transformations
FIGURE 17.2 Cytochrome P450 monooxygenase-mediated conversion of the polynuclear aromatic hydro-
carbon, benzo[a]pyrene, to a diol epoxide (7b,8a-diol-9a,10a-epoxy-7,8,9,10-tetrahydrobenzo[a]pyrene) that
forms anadduct by covalently binding to the purine base, guanine. (Modified from Figure2.5 inBurdon (1999).)
HO
·
+
N
C
C
C
HN
C
N
O
N
H
CH
H
2
N
C
C
C
HN
C
N
O
N
N
H
C—OH
H
2
N
Guanine
8-Hydroxyguanine
+
HO
·
2-Deoxypentose-4-ulose
P
OH
C
OCH
2
C
C
C
O
O
Deoxyribose
P
P
O
C
HOCH
2
C
C
C
O
O
5
4
3
2
1
FIGURE 17.3 Interaction of the hydroxyl radical with base (guanine) and sugar (deoxyribose) components
of the DNAmolecule. Notice that the reaction shown with the deoxyribose results in a break in the DNAstrand.
(Modified from Figures 2.8 and 2.10 in Burdon (1999).)
Also, DNA ligase can insert bases into breaks in strands. Mismatched bases can be corrected via
a mismatch repair process. Hoffman (1996) gives an example of mismatch repair that occurs with
deamination of 5-methylcytosine.
These examples should illustrate that diverse types of DNA damage occur and that a variety of
mechanisms exist for coping with the damage. Differences in types of damage and repair fidelities
produce differences in genotoxicity among chemicals. For example, DNA damage due to chromium
© 2008 by Taylor & Francis Group, LLC
Clements: “3357_c017” — 2007/11/9 — 18:42 — page 309 — #5
Population Genetics: Damage and Stochastic Dynamics of the Germ Line 309
0.5 µM DNA
+ no metals
0.5 µM DNA
+ 0.1 mM Cu
2+
1.4
1.3
1.2
1.1
1.0
1.4
1.3
1.2
1.1
1.0
30
40 50
60
70 80
90
Temperature (°C)
1.4
1.3
1.2
1.1
1.0
Absorbance
0.5 µM DNA
+ 0.1 mM Mg
2+
FIGURE 17.4 The influence of divalent metals on DNA stability is evidenced by changes in double-/single-
stranded DNA composition of DNA solutions that are slowly heated and then cooled. Optical absorbance is
low when most of the DNA is present in the double-stranded state and slowly increases as more and more
DNA becomes single stranded. DNA begins to convert to predominantly single-stranded DNA (unwinding) as
it is heated without metals to temperatures above circa 50
◦
C. It remains as single-stranded DNA as it cools to
temperatures below 40
◦
C (bottom panel). The DNA double-stranded structure is stabilized by Mg
2+
. In the
presence of Mg
2+
, the DNA unwinding occurs at a higher temperature and more DNA reverts to the double-
stranded state during cooling. In contrast, the presence of Cu
2+
results in unwinding at lower temperatures and
reversion to double-stranded DNA during cooling is inhibited. The Cu
2+
clearly interferes with proper base
pairing between the strands of the DNA molecule. (Modified from Figure 6.10 in Eichhorn (1974).)
(as chromate)has lower repairfidelity thanthat frommercury. Mercury tendsto producesingle-strand
breaks whereaschromate produces moreprotein–DNAcrosslinking. Chromiumis morecarcinogenic
of the two metals because single-strand breaks are repaired with higher fidelity than protein–DNA
crosslink (Robison et al. 1984). Similarly, DNA single-strand breaks caused by thallium are repaired
less effectively than those from mercury (Zasukhina et al. 1983). Imperfect repair can result in
mutations within the germ line as well as cancers of the soma. Chronic exposure of male rats to
thallium resulted in elevated prevalence of dominant lethal mutations among the embryos they sired
(Zasukhina et al. 1983). In contrast, epidemiological studies have found male-mediated genotoxicity
associated with Hiroshima atomic bomb survivors to be insignificant (Stone 1992). Indeed, mutation
risk is believed to be minor relative to cancer risk in assessing radiation effects to humans (NCRP
1993).
17.2.3 MUTATION RATES AND ACCUMULATION
The natural rate at which mutations appear varies among genes and species. Rates for bacteriophage,
bacteria, and vertebrate species range from 4 ×10
−10
to 1 ×10
−4
mutations per gene per generation
© 2008 by Taylor & Francis Group, LLC
Clements: “3357_c017” — 2007/11/9 — 18:42 — page 310 — #6
310 Ecotoxicology: A Comprehensive Treatment
(Table1.4inAyala (1982)). Mutation ratesforhumans range from4.7×10
−6
to 1×10
−4
mutations per
gene per generation (Table 13.2 in Spiess (1977)). Microbes that have no distinct somatic and
germ cell lines have mutation rates generally lower than those of metazoans, that is, approximately
10
−9
to 10
−6
mutations per cell per replication (Wilson and Bossert 1971).
Interestingly, Hoffmann and Parsons (1997) report that some species respond to increased stress
by increasing mutation rates. For example, abrupt upward or downward changes in temperature
increase mutation rates of Drosophila melanogaster. Jablonka and Lamb (1995) suggest that stress-
induced increases in mutation rates may be adaptive because more genetically variable offspring are
produced: The likelihood increases for producing an individual better fit to the extreme environment.
However, this is envisioned as a desperate response to extreme conditions since the likelihood
of an adverse mutation increases very quickly, too. Here, we will ignore such a response and
focus only on increased mutation rate due to DNA damage. Such damage might involve direct
genotoxic action orindirect damage, perhaps throughincreased oxidativestresscausedby toxicantsor
stressors.
Stressors can clearly influence mutation rate in the laboratory and this influence is often dose
dependent (Figure 17.5). However, fielddemonstrationsofstressor-relatedincreases inmutation rates
are much less common. On the basis of sampling of field populations, Baker et al. (1996) reported
extraordinary base-pair substitution rates for the mitochondrial cytochrome b gene (2.3 to 2.7×10
−4
versus the anticipated 10
−6
to 10
−8
mutations per year) in a species of vole, but later retracted their
conclusions based on a lapse in quality control (Baker et al. 1997). Convincing evidence from field
studies has been reported for increased damage (aneuploidy) in slider turtles (Trachemys scripta)
Mutation rate (10
−6
)
Generations
20
15
010
5
2
4
6
No caffeine
Caffeine added to chemostat
Resistance to
bacteriophage T5
Mutation rate (10
−10
)
Dose of x-rays (Roentgens, log scale)
8.5
4320
270
1
10
100
Ability to synthesize
methionine
FIGURE 17.5 Genotoxic action of caffeine and x-ray irradiation on bacterial mutation rate. Bacteria main-
tained in a chemostat displayed an abrupt shift in their resistance to bacteriophage T5 after the addition of
caffeine to the media (upper panel, modified from Figure 7 in Hartl and Clark (1989)). Such shifts in mutation
rates are often concentration-dependent as evidenced by mutation rates for E. coli exposed to increasing doses
of x-ray irradiation (lower panel, modified from Figure 2 in Wilson and Bossert (1971)).
© 2008 by Taylor & Francis Group, LLC
Clements: “3357_c017” — 2007/11/9 — 18:42 — page 311 — #7
Population Genetics: Damage and Stochastic Dynamics of the Germ Line 311
exposed to radioactive contaminants (Lamb et al. 1991) and DNA strand breakage for mos-
quitofish (Gambusia affinis) inhabiting radionuclide-contaminated ponds (Theodorakis and Shugart
1999).
17.3 INDIRECT CHANGE TO THE GERM LINE
17.3.1 S
TOCHASTIC PROCESSES
Stochastic processes can have a strong influence on the genetic composition of a species population.
Key stochastic determinants are effective population size, the spatial distribution of individuals
within the population, mutation rate, and migration rate. Population size, specifically effective
population size (N
e
), determines how many individuals are available to carry a particular allele into
the next generation. Small populations carry the increased risk of a random loss of an allele if too few
individuals are contributing to allele transfer into future generations. Mutation rates, although very
low, can influence the long-term genetic diversity of populations. Migration among subpopulations
can dramatically influence the risk of allele loss or fixation. These population genetic parameters
are explored below in a quantitative manner. However, before doing this, protein and DNA methods
applied in the following studies are described briefly in Box 17.1.
Box 17.1 Methods Applied in Ecotoxicology to Define Genetic Qualities of Individuals
Advances in molecular genetic techniques have made the collection of genetic data for
toxicological studies relatively easy and cost effective. A variety of molecular genetic
markers (protein and DNA) provide powerful tools to investigate population demographic
patterns, genetic variability in natural populations, gene flow, and ecological and evolutionary
processes.
Environmental toxicologists are often interested in physiological or biochemical pheno-
types, e.g., susceptibility, resistance, or tolerance to toxicants that are not readily assessed at
the population level because they may be under the complex control of many genes and may be
subject to environmental perturbation. Molecular genetic markers reflect simple genetic under-
pinnings. Markers may be chosen that behave as neutral markers of population processes or
markers thoughtto betargets for selection can be examined in detailor monitoredin populations.
Numerous methods for acquisition of molecular genetic markers are available. Investigators
must select from among them the technique that provides the requisite genetic information or
variation to address each question (Table 17.1).
TABLE 17.1
A Summary of Molecular Genetic Markers and Data
Provided for Uses in Ecotoxicology
Method Number of Loci Number of Individuals
Protein electrophoresis Many Many
RFLP Few Many
RAPD Many Many
Microsatellites Few to many Few to many
DNA sequencing Few Few
© 2008 by Taylor & Francis Group, LLC
Clements: “3357_c017” — 2007/11/9 — 18:42 — page 312 — #8
312 Ecotoxicology: A Comprehensive Treatment
Protein Electrophoresis
Protein electrophoresis has been used to evaluate population genetic processes in field studies
of toxicant impact and in laboratory toxicity studies. Proteins are separated on or in a support-
ing medium (e.g., starch, polyacrylamide, or cellulose acetate) using an electric field. Specific
enzymes or proteins are visualized using histochemical stains. Differences in mobility are asso-
ciated with charge differences among the proteins. A basic assumption of this method is that
these charge differences reflect changes in the DNA sequence encoding the amino acids of the
proteins. The bands of activity seen on gels following staining may be isozymes (functionally
similar products of different gene loci, e.g., Gpi-1 and Gpi-2) or allozymes (allelic variants of
specific loci, e.g., Gpi-2
100
and Gpi-2
165
). Banding patterns are interpreted to be genetically
based, heritable, and co-dominant. Interpretation of banding patterns is well established and
follows Mendelian inheritance rules.
Protein electrophoresis is a convenient and cost effective method to obtain information for
many loci for many individuals or populations. Detailed descriptions of electrophoretic methods
can be found in Richardson et al. (1986) and Hillis et al. (1996).
DNA Analysis
Nuclear, mitochondrial, or chloroplast genomes may be studied using DNA methods. DNA
may be extracted from fresh, frozen, ethanol-preserved, or dried specimens. Gene sequences
are routinely obtained by taking advantage of the polymerase chain reaction (PCR). Thermally
stable DNA polymerases amplify DNA sequences from small quantities of template DNA. PCR
requires short-DNAfragment primers to initiate DNAsynthesis. Primers can be random or gene
specific.
Restriction fragment length polymorphisms (RFLP) are determined when whole organelle
genomes or amplified DNAproducts aredigested with restriction enzymes. Restriction enzymes
recognize andcleave double-strandedDNAat specific sites. Thesesites usuallyconsist of four to
six DNAbase pairs. Followingdigestion ofDNAwith a series of restrictionenzymes, the sample
is subjected to electrophoresis on agarose gels. The DNAfragments are separated based on their
size (number of base pairs). Data consist of the number and size of the resulting fragments.
Variation arises from base pair substitutions, insertions, deletions, sequence rearrangements
(which may result in the gain or loss of a restriction enzyme cutting site), or differences in
overall size of the DNA fragment.
Williams et al. (1990) described a method to amplify random, anonymous DNA sequences
using PCR. Random amplification of polymorphic DNA (RAPD) uses a single, short primer
(approximately 10 bp) for the PCR. PCR products are DNA fragments flanked by sequences
complementary to the primer. PCR products are separated by size on agarose or polyacrylamide
gels. Data consist of scores of present or absent for the size-separated fragments and, therefore,
display a dominant-recessive genetic pattern. Commercially available primer kits make screen-
ing for informative markers relatively easy. The RAPD approach is most useful for intraspecific
studies.
Microsatellite DNAanalysiscan providehighly polymorphic multilocusgenotype datacom-
parable with thatobtainedwith protein electrophoresis. Microsatellite locibehaveas codominant
Mendelian markers and are useful to evaluate genetic variation within and among conspe-
cific populations. Microsatellite loci are identified by tandem repeats of short (2–4 bp) DNA
sequences (e.g., CA
n
or CTG
n
, where n = number of tandem repeats). Changes in the num-
ber of repeat units give rise to the scored polymorphism. The PCR technique is used to obtain
microsatellites. Microsatellite products are separated by size on agarose or polyacrylamide gels.
Difficulties encountered with this technique include the need to screen for polymorphic loci and
to develop highly specific primer pairs for the PCRs.
© 2008 by Taylor & Francis Group, LLC
Clements: “3357_c017” — 2007/11/9 — 18:42 — page 313 — #9
Population Genetics: Damage and Stochastic Dynamics of the Germ Line 313
Each of the molecular genetic approaches discussed above provides indirect (protein elec-
trophoresis) or incomplete (RFLP) assessment of genetic characteristics. Direct assessment of
genetic traits may be obtained with DNAsequencing. The widespread availability of PCR meth-
ods and automated DNA sequencers has made this technique increasingly cost effective. DNA
sequencing usually involves larger (20–30 bp) specific primers to amplify target sequences.
DNA fragments of different lengths are generated using ddNTPs in the PCR for chain termina-
tion. Polyacrylamide gels are used to separate the fragments and the base sequence of DNA is
determined.
17.3.2 HARDY–WEINBERG EXPECTATIONS
The Hardy–Weinberg principle states that the frequencies of genotypes within populations remain
stable through time if (1) the population is a large (effectively infinite) one of a randomly mating,
diploid species with overlapping generations, (2) no natural selection is occurring, (3) mutation
rates are negligible, and (4) migration rates are negligible. For a locus with two alleles (e.g., alleles
designated as100and 165)with allelefrequenciesof pfor 100andq for 165, the genotypefrequencies
will be p
2
for 100/100, 2pq for 165/100, and q
2
for 165/165. For a three allele locus (e.g., 66, 100,
and 165), the genotype frequencies will be r
2
for 66/66, 2rp for 66/100, 2rq for 66/165, p
2
for
100/100, 2pq for 100/165, and q
2
for 165/165. Such a polynomial relationship can be visualized
with a De Finetti diagram (De Finetti 1926) (Figure 17.6).
A χ
2
test can be used to test for significant deviation from Hardy–Weinberg expectations,
χ
2
=
n
i=1
(Observed
i
−Expected
i
)
2
Expected
i
, (17.1)
where n = the number of possible genotypes (e.g., 3 for a two allele locus or 6 for a three allele
locus), Observed
i
= observed number of individuals of the ith genotype, and Expected
i
= number
of individuals of the ith genotype and expected based on the allele frequencies and the Hardy–
Weinberg model. The degrees of freedom for the test is the number of possible genotypes minus the
number of alleles (e.g., 3 −2 = 1 for a two allele locus).
100/165
100/100
165/165
p for 100
1 = p
2
+ 2pq + q
2
q for 165
p
2
2pq
q
2
FIGURE 17.6 De Finetti diagram illustrating the Hardy–Weinberg principle. Conformity to Hardy–Weinberg
expectations for any combination of allele frequencies (e.g., for alleles designated 100 and 165) are indicated
by genotype combinations laying on the arc within the 100/100, 165/165, and 100/165 triangle. Points off
this arc reflect deviations from expectations. The statistical significance of such a deviation can be tested
with a χ
2
test.
© 2008 by Taylor & Francis Group, LLC
Clements: “3357_c017” — 2007/11/9 — 18:42 — page 314 — #10
314 Ecotoxicology: A Comprehensive Treatment
If the χ
2
test with adequate statistical power failed to reject the null hypothesis, the conclusion
is made that there is no evidence that the conditions for Hardy–Weinberg equilibrium were not
met. If the null hypothesis was rejected, one or more of the assumptions was violated. As a word
of warning, too often ecotoxicologists assume that rejection of the null hypothesis indicates that
selection is occurring and ignore the other assumptions on which the Hardy–Weinberg relationship
is based. Such studies must be read with caution.
17.3.3 GENETIC DRIFT
Genotype frequencies do change in populations because of finite population size, population struc-
ture, migration, and nonrandom mating. An oft-observed consequence of toxicant exposure is a
decrease in population size. Population migration rates or direction of migration can be influenced
by toxicant avoidance increasing emigration or increased immigration after the toxicant removes
a portion of the endemic population and presents vacant habitat to migrating individuals. Population
structure can be influenced as toxicants create barriers, impediments, or disincentives to move-
ment; e.g., patches of highly contaminated sediment or a large contaminant plume in a river or
stream.
17.3.3.1 Effective Population Size
Genetic drift occurs in all finite populations. Drift can be continuous if the population is always small
or intermittent if the population size fluctuates widely. Intermittent drift can produce genetic bottle-
necks during times of small population sizes. Due to sampling error, a small population producing
future generations will likely carry only a subset of the total genetic variability present in the large
parent population.
Genetic driftwill accelerateas the number of individuals contributing genesto thenext generation
(effective population size, N
e
) decreases. This fact can be illustrated with a simple, random sampling
experiment. Assume that a bowl is filled with 5000 red and 5000 blue marbles. We take 5000 marbles
randomly from the bowl to produce the “next generation.” We do this random sampling experiment
1000 times and get an average red:blue ratio each time. With these large numbers, a frequency
of red marbles of 0.50 is expected with a modest amount of variation among the 1000 trials. Our
sample size is so large that sampling error will be minimal. However, if we sampled only 10 marbles
each time, the variation around 0.50 would be much wider than when we sampled 5000 marbles.
In fact, in many more cases, the frequency will shift drastically to produce a “next generation” with
a very different frequency of red or blue marbles than that of the parent generation. Indeed, there
would be many more cases in which only red or blue marbles were available to produce the next
generation. Drift in frequency of marble color through generations could be simulated by using
the new “generational” frequency from 10 marbles to fill the bowl again with 10,000 red and blue
marbles, and repeating the experiment for many generations. Clearly, the sampling error associated
with taking only 10 marbles each “generation” would result in a drift in frequency away from that
for the original bowl of marbles. In some cases, blue marbles might be lost completely with fixation
occurring for “red.” The opposite with fixation for “blue” would occur in other cases. Further, as
the frequency of one allele (e.g., frequency of red marbles in the bowl) decreases, the risk of that
allele (color) being lost from the population also increases. With intermittent drift and associated
bottlenecks, populations can experience founder effects (a population started by a small number of
individuals will differ genetically from the parent population due to high sampling error). Small
populations bring to future generations a subset of the alleles present in a parent population and
allele frequencies vary stochastically from those of the parent population.
The effective population size (N
e
) is often smaller than the actual or census population size
because all individuals do not contribute to the next generation. How many contribute to the next
© 2008 by Taylor & Francis Group, LLC
Clements: “3357_c017” — 2007/11/9 — 18:42 — page 315 — #11
Population Genetics: Damage and Stochastic Dynamics of the Germ Line 315
generation isacomplex functionof demographic andlife historyqualities. Ingeneral, N
e
for apopula-
tion withnonoverlappinggenerations isestimated astheharmonic meanof population sizesmeasured
at a series of times (N
i
) and the number of generations over which the population measurements
were made (t) (Hartl and Clark 1989).
1
N
e
=
1
t
1
N
1
+
1
N
2
+···+
1
N
t
. (17.2)
The advantage of this estimate of N
e
is that it weights generations with small population sizes
more heavily than those with larger populations sizes. Genetic drift accelerates in a nonlinear manner
as population size decreases so this heavy weighting of smaller population sizes is appropriate.
Effective population size is also influenced by sex ratio.As isevident fromthe useof theharmonic
mean againin Equation17.3, the sex present in thelowest numberhas themost influenceon theestim-
ated N
e
. If the number offemales and males were not equal in the population, the effective population
size can be estimated with Equations 17.3 or 17.4 which is a rearrangement of Equation 17.3 (Crow
and Kimura 1970).
1
N
e
=
1
4N
Males
+
1
4N
Females
, (17.3)
N
e
=
4N
Males
N
Females
N
Males
+N
Females
. (17.4)
The
1
4
values in Equation 17.3 come from the fact that “the probability that two genes in different
individuals in generation t are both from a male [or female] in generation t − 1is
1
4
; and that they
come from the same male [or female] is 1/4N
male
[or 1/4N
female
]” (Crow and Kimura 1970).
If generations are overlapping in time, the assumption N
e
≈ N/2 can be made or the following
equation can be applied:
N
e
=
4N
a
L
σ
2
n
+2
, (17.5)
where N
a
= the natality over a period of time, L = the mean generation time, and σ
2
n
= the brood
size variance.
Genetic drift would eventually lead to loss or fixation of an allele in the absence of an effectively
infinite population. How quickly or slowly this occurs is a function of N
e
and the initial frequency of
the allele in question. Equations 17.6 and 17.7 estimate the average number of generations needed
to reach allele fixation (p → 1) or loss (p → 0), respectively. Wilson and Bossert (1971) grossly
estimate that allelesare lostat a rateof 0.1 to0.01 perlocusper generationifN
e
is 10 to100, 0.0001 per
locus pergeneration if N
e
is approximately10,000, and that loss is trivialif N
e
is greaterthan 100,000.
Ayala (1982) suggeststhat randomdrift is unlikely to determineallele frequenciesif 4Nx is very much
smaller than 1 (x = rate of mutation (u), rate of migration (m), or the selection coefficient (s)). (The
m is estimated as the number of individuals migrating/total number of individuals that potentially
could migrate; the rate of mutation is defined as the number of mutations expected per gamete per
generation; the selection coefficient will be defined in Chapter 18.) Values of 4Nx > 1 implied
that mutation, migration, and/or selection will dominate changes in allele frequencies. Regardless,
excluding times in which the allele is lost, the average number of generations to fixation (p → 1)
for an allele is the following:
¯
t
1
=−
1
p
[4N
e
(1 −p)ln (1 −p)]. (17.6)
© 2008 by Taylor & Francis Group, LLC
Clements: “3357_c017” — 2007/11/9 — 18:42 — page 316 — #12
316 Ecotoxicology: A Comprehensive Treatment
Alternatively, excluding the times when the allele becomes fixed, the average number of
generations to allele loss (p → 0) is the following:
¯
t
0
=−4N
e
[p/(1 −p)]ln p. (17.7)
Crow and Kimura (1970) extend these equations to consider the case of a (neutral) mutation that
appears in an individual within a population. (The allele frequency, p, is set to 1/(2N) to derive
these relationships.) Equations 17.6 and 17.7 become Equations 17.8 and 17.9, respectively. The
probability of a neutral allele becoming established in the population increases as N
e
decreases.
Excluding cases in which it is lost from the population, a neutral mutant takes about 4N
e
generations
to reach fixation:
¯
t
1
≈ 4N
e
, (17.8)
¯
t
0
≈ 2(N
e
/N)ln (2N). (17.9)
Why are the above details important to population ecotoxicology? First, the genetic composition
of a population can be strongly impacted by a toxicant’s influence on the effective population size.
The toxicant can influence N
e
by decreasing the total population size (Equation 17.2) through time,
affecting the numbers of each sex present at any time (Equations 17.3 and 17.4), or modifying
generation time or variance in brood size (Equation 17.5). Accelerated drift, genetic bottlenecks,
and founder effects can result in loss of genetic information and produce strong shifts in genetic
composition of populations (Equations 17.6 and 17.7). If a mutation appears in an individual in a
population, its chance of fixation increases as N
e
decreases. It might be helpful to re-emphasize at
this point in our discussions that natural selection has nothing to do with these potential changes in
the germ line. Nevertheless, toxicant exposure can lead to microevolution because allele frequencies
have changed.
17.3.3.2 Genetic Bottlenecks
Drastically reduced population or subpopulation size due to toxicant exposure can result in a genetic
bottleneck and consequent founder effect (Gillespie and Guttman 1999, Newman 1995, 1998). An
acute toxic exposure, such as that associated with pesticide spraying and subsequent very high
mortality, is the most straightforward example of an ecotoxicological event that could result in a
bottleneck. Low levels of genetic variation among cheetah (O’Brien et al. 1987), Florida panther
(Facemire et al. 1995), Lake Erie yellow perch (Strittholt et al. 1988), and Great Lakes brown
bullhead (Murdoch and Hebert 1994) have been attributed to genetic bottlenecks. The last three
examples putatively involved toxicant exposures. The underlying concern associated with bottle-
necks is thepotential loss ofgenetic information. Genetic variationinthe shortterm may beassociated
with physiological or biochemical flexibility and, in the long term, with evolutionary potential
and persistence in a changing environment. As an example, conservation biologists are concerned
about the ability of the remaining wild cheetahs to cope with feline distemper, a serious infectious
disease.
There is a lower, but finite, chance that a population experiencing a bottleneck will emerge
with more genetic variation than the parent population because the variation among bottlenecked
populations increases as N
e
decreases. Whether the genetic variation increases or decreases simply
depends on which individuals happen to make it through the bottleneck. However, the chances of
a decrease are greater than those of an increase, especially with repeated or periodic bottlenecks,
as might be associated with occasional or accidental release of toxicants. Gillespie and Guttman
(1999) discussed this possibility of an increase in genetic variation following toxicant exposure
© 2008 by Taylor & Francis Group, LLC
Clements: “3357_c017” — 2007/11/9 — 18:42 — page 317 — #13
Population Genetics: Damage and Stochastic Dynamics of the Germ Line 317
but cautioned that maladaptive combinations of rare alleles have a higher chance of occurring in
such cases.
17.3.3.3 Balancing Drift and Mutation
From our discussions to this point, the question might arise why genetic drift does not result in
a gradual trend toward genetic uniformity. That would be the eventual fate of populations in the
absence of mutation. Let us examine the balance between drift and mutation rates by assuming that
the relevant genes are neutral. In Chapter 18, we will add details associated with differences in fitness
among genotypes.
As mentioned above, the rate of change in a population of N diploid individuals owing to
a mutation is 2Nu and that associated with drift is defined by Equations 17.6 through 17.9 and
the associated text. The number of novel mutant alleles (M) that appear during each generation,
eventually to become fixed, is defined by Spiess (1977),
M = (2N ¯u/2N) =¯u, (17.10)
where ¯u = the average of the mutation rates for all alleles. Mutation rate (u) balanced against
loss owing to genetic drift (1/(2N)) results in a steady-state level of genetic variation. Again, this
explanation for the maintenance of genetic variation is conditional on neutrality of alleles. Crow
and Kimura (1970) and Mitton (1997) indicate that effective population size (N
e
) and mutation
rate (u) determine the average heterozygosity of a population at equilibrium relative to the influences
of genetic drift and mutation rate:
¯
H ≈ (4N
e
u)/(4N
e
u + 1). Here,
¯
H is the average of the 2pq
proportions for all scored loci where p and q are the allele frequencies for two allele loci. Obviously,
the calculation is modified to include loci with more than two alleles. Populations should be expected
to differ in their levels of heterozygosity. Some differences could reflect the influence of toxicant
exposure on N
e
, and perhaps, u.
17.3.4 POPULATION STRUCTURE
What are the genetic consequences of population structure? Generally, an uneven distribution of
individuals suggests nonrandom mating; therefore, N
e
will be influenced by population structure.
Hartl and Clark (1989) indicate that the density of breeding individuals in an area (δ) and the amount
of dispersion between an individual’s location of birth and that of the birth of its progeny (σ
2
)
influence N
e
,
N
e
= 4πδσ
2
. (17.11)
Clearly, a quality as basic as N
e
is strongly influenced by population structure. Other important
qualities are discussed in detail below as they often are neglected in ecotoxicological studies.
17.3.4.1 The Wahlund Effect
The Wahlund effect occurs after mixing of populations, each with distinct allele frequencies and in
Hardy–Weinbergequilibrium. Mixing may occurduring samplingifpopulation structurewas cryptic,
i.e., individuals were unintentionally taken from two subpopulations and then pooled for analysis.
Mixing may occur naturally if migration were taking place between subpopulations previously
isolated by a barrier to movement. The frequency of the heterozygote in the mixed sample will be
lower than predicted under the assumption that the sample came from a single, randomly mating
population. For example, assume that equal numbers of individuals are mixed together from two
© 2008 by Taylor & Francis Group, LLC
Clements: “3357_c017” — 2007/11/9 — 18:42 — page 318 — #14
318 Ecotoxicology: A Comprehensive Treatment
populations with allele (100, 165) frequencies of p
1
= 0.9, q
1
= 0.1 and p
2
= 0.1, q
2
= 0.9. In
Hardy–Weinberg equilibrium, the frequencies of the 100/100, 100/165, and 165/165 genotypes in
these two populations would be the following:
Population 1: p
2
1
= 0.81 2p
1
q
1
= 0.18 q
2
1
= 0.01
Population 2: p
2
2
= 0.01 2p
2
q
2
= 0.18 q
2
2
= 0.81
Let us assume that 100 individuals from each population were mixed into a pooled sample.
From population 1, there would be eighty-one 100/100 individuals, eighteen 100/165 individuals,
and one 165/165 individual. From population 2, there would be one 100/100 individual, eighteen
100/165 individuals, and eighty-one 165/165 individuals. Therefore, the number of individuals of
each genotype in the pooled sample would be the following: 100/100 = 82 individuals, 100/165 =
36 individuals, and 165/165 = 82 individuals. In the pooled sample, p( ¯p) and q(¯q) values are
0.5 each. The expected number of each genotype predicted from the Hardy–Weinberg principle
(1 = p
2
+2pq+q
2
) would be thefollowing: 100/100 = 50 individuals, 100/165 = 100 individuals,
and 165/165 = 50 individuals. There is an apparent excess of both homozygotes or, stated another
way, an apparent deficit of heterozygous genotypes. Figure 17.7 is a modified De Finetti diagram
that visually illustrates this principle.
These same consequences arise if more than two populations were involved. Under conditions
giving rise to the Wahlund effect (mixing of individuals from several populations and sampling
before reproduction), the average frequency of heterozygotes can be generally described based on
the ¯p and ¯q for a mixed sample involving k populations (Cavalli-Sforza and Bodmer 1971). (Assume
equal numbers of individuals being contributed by each of the k populations to the sample.)
¯
H = 2¯p¯q[1 −(σ
2
/¯p¯q)], (17.12)
where σ
2
is the variance in gene frequencies among k populations:
σ
2
=
p
2
i
/k
−¯p
2
. (17.13)
100/165
165/165 100/100
Population1
Population 2
“Average”
FIGURE 17.7 De Finetti diagram illustrating the Wahlund principle. In this example, equal numbers of
individuals from two populations are mixed, resulting in an “average” for the genotype frequencies, 100/100,
100/165, and 165/165. The position defined by these genotype frequencies is off the arc representing all
possible solutions to the Hardy–Weinberg polynomial, 1 = p
2
+ pq +q
2
. The point on the arc immediately
above the average reflects the expected frequencies of the three genotypes. On the basis of these expectations,
there is an apparent deficiency of heterozygotes. (Modified from Hartl and Clark (1989).)
© 2008 by Taylor & Francis Group, LLC
Clements: “3357_c017” — 2007/11/9 — 18:42 — page 319 — #15
Population Genetics: Damage and Stochastic Dynamics of the Germ Line 319
The deficiency of heterozygotes will be roughly twice the σ
2
(Cavalli-Sforza and Bodmer 1971).
Selander’s D (1981)is astraightforwardmeasure ofthedeviation fromexpectations. Selander’s D
is equal to the H
obs
− H
exp
where H
obs
is the observed proportion of heterozygotes in the sample
and H
exp
is the expected proportion of heterozygotes in the sample based on Hardy–Weinberg
expectations. A negative D indicates a deficit of heterozygotes.
Samples produced by pooling individuals from several groups of a cryptically structured popu-
lation might lead the unwary ecotoxicologist to conclude that the heterozygote was less fit than
the two homozygotes and underrepresented in the sampled population due to selection associated
with toxicant exposure. Such a conclusion must be considered conditional until the possibility of a
Wahlund effect was explored carefully.
Box 17.2 Midges, Mercury, and Too Many Missing Heterozygotes: Evidence of a
Wahlund Effect
Woodwardetal. (1996) examinedallozymefrequencies inmidge (Chironomusplumosus) larvae
from Clear Lake (California). Midges of this species emerge as adults to form mating swarms
over the lake. Masses containing hundreds of eggs each are deposited on the lake surface by
females and the hatched larvae drop to the bottom to become deposit feeders.
Samples of larvae were taken along a transect beginning at the Sulfur Bank Mercury Mine
where mine tailings had been deposited in the lake for many decades. Six sites on the transect
were sampled by boat using an Eckman dredge. Dredge samples were taken at each site until
ample numbers of larvae were collected. Forty midges were deemed an adequate sample for an
allozyme survey. On average, chironomids from approximately 10 dredge hauls were pooled
to obtain the sample size of 40 midges per site.
Twelve polymorphic loci were examined by starch gel electrophoresis (see Figure 17.8
for an illustration) at the six sites; therefore, 72 χ
2
tests for deviation from Hardy–Weinberg
FIGURE 17.8 A starch gel stained to score allozymes, allelic variants of enzymes. Supernatants from
tissue homogenates are loaded into slots in the gel. Many lanes can be loaded in each gel so that several
individuals can be scored on a single gel. After protein separation in an electric field, gels are stained for
specific enzyme activities and presumptive genotypes scored based on the pattern of spots in each lane.
This particular gel is stained for the enzyme isocitrate dehydrogenase (Icd-2 and Icd-2) from the tissue of
14 mosquitofish (Gambusia holbrooki).
© 2008 by Taylor & Francis Group, LLC
Clements: “3357_c017” — 2007/11/9 — 18:42 — page 320 — #16
320 Ecotoxicology: A Comprehensive Treatment
expectations were performed. On the basis of an α of 0.05, only three or four “false” rejec-
tions of the null hypothesis (i.e., Type I errors) would have been expected to occur by chance
alone. A surprisingly high proportion of the tests (18 of 72) resulted in the rejection of the null
hypothesis. One or more assumptions of Hardy–Weinberg equilibrium were being violated.
In 16 cases, Selander’s D values were negative, indicating that rejection was associated with
a lower than expected proportion of heterozygotes. A review of the sampling methods and
egg depositing behavior of the midge suggested a Wahlund effect. Approximately 10 dredge
samples were taken as the anchored boat drifted over the site. Perhaps individuals pooled from
these dredge samples reflected cryptic population structure at each site. Small scale popula-
tion structure could result from nonuniform settling of larvae from egg masses, aggregation
of siblings, differences in settling behavior relative to sediment characteristics, or some other
factor. The alternate explanation of selection at several loci was judged to be less likely than
a Wahlund effect based on Ockham’s razor (i.e., all else being equal, the explanation requir-
ing the fewest assumptions is the most likely) because it requires that selection is occurring
against heterozygotes at 9 of 12 loci. Explanation based on the Wahlund effect requires only
one assumption: the population is structured. In further support of this conclusion, deviations
from Hardy–Weinberg expectations that might suggest the presence of selection was not cor-
related with the level of mercury contamination in site sediments.
Woodward et al.’s study will be explored further (Box 17.3) after discussion of ways to
quantify structuring of populations.
17.3.4.2 Isolated and Semi-Isolated Subpopulations
Violations of the assumption for the Hardy–Weinberg model due to nonrandom mating can lead
to a deficit of heterozygotes, e.g., the Wahlund effect that appears during sampling of structured
populations. Inbreeding can also result in deficits of heterozygotes: an individual’s heterozygosity
measured as the proportion of all scored loci for which the individual is heterozygous will be lower
than its parents if those parents were sibs. The less extreme structuring described to this point is
similar to inbreeding because individuals within the total population are not randomly mating due
to the degree of their isolation by geographic distance. Population structuring will lead to a decrease
in heterozygosity for individuals within a subpopulation relative to that anticipated in the absence
of population structure.
The proportion of all individuals that are heterozygotes for a particular locus can be quanti-
fied at different levels of “pooling” to get an understanding of the nature of population structure.
The assumption is made that, like increased inbreeding, increased structure in populations results in
a decrease in the proportion of individuals that are heterozygotes. Wright’s F statistics (Nei 1973,
Wright 1943, 1951) are based on consideration of heterozygosity at the individual (I), subpopula-
tion (S), and the total population (T) levels. Individuals are sampled from subpopulations of the
total population to generate the associated metrics; for example, fish are sampled from creeks and
tributaries of a large river system. The heterozygosity estimated at the individual level (H
I
)isthe
observed heterozygosity averaged over all sites (i.e., all subpopulations of the population). The
heterozygosity for the subpopulations (H
S
) is estimated under the assumption that individuals in
the subpopulations are mating randomly (i.e., using 2pq estimated for each subpopulation). The total
heterozygosity (H
T
) is that measured after pooling all individuals from all samples, calculating total
p and q values, and estimating the predicted proportion of heterozygotes (i.e., 2pq for the entire
population). Hartl and Clark (1989) give the following formulae to calculate H
I
, H
S
, and H
T
:
H
I
=
k
i=1
H
i
k
, (17.14)
© 2008 by Taylor & Francis Group, LLC
Clements: “3357_c017” — 2007/11/9 — 18:42 — page 321 — #17
Population Genetics: Damage and Stochastic Dynamics of the Germ Line 321
where H
i
= the heterozygosity for subpopulation i and k = the number of subpopulations (e.g.,
sites or sampling locations) from which heterozygosity was estimated.
H
S
= 1 −
k
i=1
p
2
i,s
, (17.15)
where p
i,s
= the proportion for the ith alleles in the s subpopulation. The p
2
values are summed
for the k alleles. The H
S
estimates for all subpopulations can be averaged to get the
¯
H
S
used in
Equations 7.18 and 17.19.
H
T
= 1 −
k
i=1
¯p
2
i
, (17.16)
where p
i
= the frequency of allele i averaged over all of the subpopulations.
Three hierarchical F statistics can be generated from H
I
, H
S
, and H
T
to evaluate the influence
of population structure on the genotype frequencies at a locus. The F statistics scale the estimated
heterozygosity at the levels of individual, subpopulation, and population. Recalling our discussions
linking inbreeding effects and population structuring effects on heterozygosity, it becomes obvious
that several of these metrics are comparable to inbreeding coefficients. The overall inbreeding coef-
ficient, F
IT
, is defined by Equation 17.17 using H
T
and H
I
from Equations 17.16 and 17.14. It is the
“reduction in heterozygosity of an individual relative to the total population” (Hartl and Clark 1989).
It quantifies heterozygosity of the individual (H
I
) relative to that of the entire population (H
T
),
F
IT
= 1 −
H
I
H
T
=
H
T
−H
I
H
T
. (17.17)
Similarly, the reduction in heterozygosity of an individual due to nonrandom mating within its
subpopulation (Equation 17.18) or due to genetic drift (Equation 17.19) can be derived. The F
IS
statistic quantifies the heterozygosity of the individual (H
I
) relative to that of the (average) sub-
population (
¯
H
S
) whereas F
ST
quantifies the heterozygosity of the (average) subpopulation (
¯
H
S
)
relative to that of the total population (H
T
).
F
IS
= 1 −
H
I
¯
H
S
=
¯
H
S
−H
I
¯
H
S
, (17.18)
F
ST
= 1 −
¯
H
S
H
T
=
H
T
−
¯
H
S
H
T
, (17.19)
where
¯
H
S
= the average of the H
S
values from all subpopulations or sites. The F
ST
= 0if
all subpopulations (e.g., sites) were in Hardy–Weinberg equilibrium. In cases where migration
among subpopulations produces deviations from these expectations, F
ST
is approximately equal to
1/(1 +4Nm) (Rousset and Raymond 1997). Therefore, the effective number of migrants per gener-
ation (Nm) can be estimated if F
ST
is known (Bossart and Prowell 1998). (Note that Ouborg et al.
(1999) described Markov Chain Monte Carlo (Beerli 1998), Bayesian (Rannalaand Mountain 1997),
maximum likelihood (Beerli and Felsenstein 1999), and pseudomaximum likelihood (Rannala and
Hartigan 1996) methods that are more effective than this F
ST
-based methods for estimating effective
migration and, in some cases, population structure from molecular genetics data.)
© 2008 by Taylor & Francis Group, LLC
Clements: “3357_c017” — 2007/11/9 — 18:42 — page 322 — #18
322 Ecotoxicology: A Comprehensive Treatment
Box 17.3 More on Midges, Mercury, and Missing Heterozygotes
In Box 17.2, the potential for a Wahlund effect was identified for a survey of midge
allozymes sampled along a gradient of sediment mercury contamination (Woodward et al.
1996). Differences were tentatively assigned to a Wahlund effect for reasons described in
Box 17.2. Wright’s F
IS
, F
IT
, and F
ST
statistics were calculated for 12 loci sampled along the
mercury gradient in order to understand the observed differences in heterozygosity. A sum-
mary for Wright’s F statistics for the following 12 isozymes is provided in Table 17.2:
aspartate aminotransferase(Aat), adenosine deaminase (Ada), esterase (Est), glycylleucine pep-
tidase (gl), hexokinase (Hk), isocitrate dehydrogenase (Icd-I and Icd-2), leucylglycylglycine
peptidase (lgg), malate dehydrogenase (Mdh), malic enzyme (Me), mannose-6-phosphate
isomerase (Mpi), and phosphoglucomutase (Pgm). A quick glance at this table shows that
the deficiencies in heterozygotes for many loci were associated with the site (subpopulation,
F
IS
) level. This supports the explanation thatsampling of cryptically structured populations pro-
duced the apparent deficiency in heterozygotes, that is, a Wahlund effect. Selection remained
an unlikely explanation for reasons discussed in Box 17.2. Inbreeding was another potential
mechanism but the lack of any obvious barriers to adult mating as they swarm above the water
surface does not support this explanation.
To assess this population structure-based hypothesis further, fine scaled sampling was done
at one lake site. Forty larvae were sampled from each of fifteen adjoining, 1 × 1 m quadrats
and scored for nine isozymes (Aat, Ada, Est, gl, Hk, Icd-1, Icd-2, lgg, and Pgm). This transect
of 15 quadrats was constructed in a shallow (5 m) region of the lake to enhance the accuracy of
dredge placement. The length of the transect was chosen to approximate the length of the aver-
age site sampled in the original study (Table 17.2). The results from this fine scaled sampling
TABLE 17.2
F
IS
, F
IT
, and F
ST
Statistics for Chironomid
Larvae Collected at Six Sites along a Sediment-
Associated Mercury Gradient in Clear Lake
(California)
Allozyme
Locus F Statistic
F
IS
F
IT
F
ST
Aat 0.165 0.181 0.019
Ada 0.107 0.114 0.007
Est 0.231 0.248 0.022
Gl 0.078 0.087 0.010
Hk −0.116 −0.099 0.015
Icd-1 0.219 0.225 0.009
Icd-2 0.259 0.275 0.022
Lgg 0.128 0.130 0.003
Mdh −0.059 −0.026 0.031
Me 0.618 0.627 0.023
Mpi 0.142 0.151 0.011
Pgm 0.107 0.116 0.010
Mean 0.125 0.137 0.014
Source: Modified from Table 2 of Woodward et al. (1996).
© 2008 by Taylor & Francis Group, LLC
Clements: “3357_c017” — 2007/11/9 — 18:42 — page 323 — #19
Population Genetics: Damage and Stochastic Dynamics of the Germ Line 323
TABLE 17.3
F
IS
, F
IT
, and F
ST
Statistics for Chironomid
Larvae Collected from 15 Quadrats of
a Transect in Clear Lake (California)
Allozyme
Locus F Statistic
F
IS
F
IT
F
ST
Aat 0.202 0.210 0.010
Ada 0.116 0.138 0.025
Est 0.024 0.247 0.019
Gl 0.250 0.264 0.019
Hk 0.024 0.030 0.006
Icd-1 0.107 0.115 0.009
Icd-2 0.021 0.034 0.014
Lgg 0.102 0.124 0.024
Pgm 0.010 0.020 0.011
Mean 0.134 0.150 0.018
Source: Modified from Table 4 of Woodward et al. (1996).
are given in Table 17.3. Wright’s F
IT
and F
IS
statistics indicated a deficiency in heterozygotes
within the transect and quadrats. This clearly indicated small scale population structure of the
chironomid larvae.
Woodward et al. (1996) concluded that a Wahlund effect, not mercury-related selection or
inbreeding, was the most likely explanation for the deficiencies of heterozygous genotypes.
Their conclusion was based on the following observations and rules of logic:
1. Departures from Hardy–Weinberg expectations involved a deficiency of heterozy-
gotes (Hardy–Weinberg expectations and Selander’s D values).
2. There was no correlation between mercury contamination and genotype frequencies,
i.e., no evidence of a cause–effect relationship or a concentration–effect gradient.
3. Ockham’s razor (principle of parsimony) favors explanations with the fewest
assumptions.
4. Mating swarm and egg mass deposition patterns provide a mechanism for clustering
of genetically distinct larvae as they settle nonrandomly onto the sediments.
5. Wright’s F statistics suggest considerable structure along the mercury gradient and
within the smaller scale transect.
6. There is no obvious obstacle to adult mating that would lead to inbreeding.
The potential for a Wahlund effect should always be kept in mind when interpreting pop-
ulation genetics data for populations exposed to toxicants. Woodward et al. (1996) provide
only one example of the importance of such thoughtfulness, but other examples exist. Lavie
and Nevo (1986) suggested from laboratory testing that one could examine a suite of species
and focus on the proportion of heterozygotes relative to homozygotes in populations. This
conclusion was based on results from five gastropod species lethally exposed to cadmium and
homozygote:heterozygote ratios for the enzyme, glucosephosphate isomerase, in survivors.
They state that there seems to be a relationship for this proportion with pollution intensity and
“[t]his pattern seems to havebeen established by natural selection.” They attribute thedifference
© 2008 by Taylor & Francis Group, LLC
Clements: “3357_c017” — 2007/11/9 — 18:42 — page 324 — #20
324 Ecotoxicology: A Comprehensive Treatment
in survival to thehigher stability of the homodimerthan the heterodimer of this dimeric enzyme:
homozygotes had an enzyme form that was more resistant to inactivation by cadmium. Clearly,
such an approach would be valid only in the demonstrated absence of a Wahlund effect.
Computer intensive methods are now widely available to augment or to eventually replace the
metrics just described for estimating gene flow and population structure. For example, a personal
computer can now quickly produce bootstrap confidence intervals for F
ST
(Rousset and Raymond
1997). Q statistics (Nei 1973) can also be generated for structured populations in a manner analogous
to performing statistical variance component analysis (Bossart and Prowell 1998, Rousset and
Raymond 1997). More involvedcomputermodels incorporatinggeographicaldistances inalgorithms
allow more specific analysis of genetic data. For more information, the interested reader is directed
to Bossart and Prowell (1998), who recently reviewed conventional and new means of assessing
gene flow in structured populations.
17.3.5 MULTIPLE-LOCUS HETEROZYGOSITY AND
INDIVIDUAL FITNESS
At this point, concepts related to neutral theory have been explored with the aim of demonstrating
how toxicants can influence population genetics in the absence of differences in individual fitness.
In the remainder of this chapter, two bridging topics will be mentioned between neutral theory and
selection-based theory. The general consequences of different levels of heterozygosity of individuals
will be discussed relative to overall fitness. Then long-term evolutionary consequences for species
having decreased genetic diversity will be explored briefly.
Numerous studies have demonstrated that an individual’s overall heterozygosity can influence
its fitness. However, a number of publications have shown that it might not (e.g., Koehn et al. 1988).
Multiple-locus heterozygosity refers here to the number of scored loci for which the individual
is heterozygous. Relevant measures of fitness for which heterozygosity did influence fitness vary
widely and include survival (Pemberton et al. 1988, Samallow and Soulé 1983), developmental rate
(Danzmann et al. 1985, 1986, 1988), developmental stability (Ferguson 1986, Mulvey et al. 1994),
metabolic rate (Danzmann et al. 1987, Mitton et al. 1986), metabolic cost (Garton et al. 1984),
and growth rate (Bush et al. 1987, Garton et al. 1984, Koehn and Gaffney 1984, McAndrew et al.
1986). Mitton’s book Selection in Natural Populations (1997) provides extensive discussion of such
correlations between fitness metrics and heterozygosity. Some studies suggest that heterozygosity
can alsoinfluence susceptibility to toxicants (e.g., Nevoet al. 1986). However, carefulanalysis of one
study of mercury toxicity (Diamond et al. 1989) and a similar study of arsenic toxicity (Newman et al.
1989) demonstrated that the observed relationships were artifacts reflecting the sum of individual
locus effects, not an effect of heterozygosity per se (Newman et al. 1989). (Unfortunately, Table 6
of Gillespie and Guttman (1999) incorrectly lists the results of Diamond et al. (1989) and Newman
et al. (1989) as supporting evidence for a relationship between heterozygosity and fitness.)
Why should there be a relationship between fitness and heterozygosity? There are three common
explanations: inbreeding depression, multiple-locus heterosis, and optimal metabolic efficiency.
The inbreeding depression explanation can be understood from our discussions of inbreeding
and heterozygosity. A decrease in heterozygosity can indicate increased inbreeding. Heterozygosity
might simply reflect the degree of inbreeding experienced by individuals. Inbreeding can lead to
lowered fitness (via inbreeding depression) as the probability of an individual being homozygous
for deleterious genes increases. Low heterozygosity for the entire genome was approximated with
scored loci and was correlated with a general inbreeding depression (Smouse 1986). Although
inbreeding is a plausible mechanism, Leary et al. (1987) described one case in which inbreeding was
© 2008 by Taylor & Francis Group, LLC
Clements: “3357_c017” — 2007/11/9 — 18:42 — page 325 — #21
Population Genetics: Damage and Stochastic Dynamics of the Germ Line 325
not the explanation for the relationship between heterozygosity and a measure of individual fitness,
developmental stability.
The multiple heterosis explanation extends the phenomenon of heterosis to include many loci.
Single-locus heterosis is the superior performance of heterozygotes relative to homozygotes. It can
also be defined in terms of hybrids (Zouros and Foltz 1987). The performance of hybrids produced
from two lines is often superior to that of the two parent lines. Multiple heterosis is the sum of
heterotic effects at several loci. Heterozygosity will be positively correlated with hybrid vigor and
can be envisioned as representing the opposite of the negative relationship just described between
heterozygosity-correlated inbreeding and fitness.
Optimal metabolic efficiency may be linked to high fitness (Dykhuizen et al. 1987, Zouros and
Foltz 1987). Individuals heterozygous for major glycolytic and Krebs cycle-related loci (enzymes
typically used in these studies) may be more metabolically efficient or flexible than homozyg-
ous genotypes. Allozymes, allelic variants of enzymes, can differ in their properties, including
kinetic properties (Hines et al. 1983) and resistance to toxicant inactivation (Kramer and Newman
1994). A homozygote at a particular locus will have only one form of the enzyme available, but
the heterozygote will have two (or more for multimeric enzymes) forms available. A homozygote
(e.g., 100/100) for a dimeric enzyme will produce only one protein subunit and only one dimer
will be produced. Heterozygotes (e.g., 100/165) synthesize two proteins (100 and 165) and three
functional dimeric enzymes 100/100, 100/165, and 165/165 will be produced. Individuals with more
heterozygous loci may have more metabolic options available to cope with changing environmental
demands. Relative totheir homozygous counterparts, highly heterozygous individualsmight be more
efficient over a wider range of conditions. If some allozymes are inactivated more readily than others
by metals (Eichhorn 1974, Kramer and Newman 1994, Lavie and Nevo 1982) or are less tolerant
to high temperatures (Zimmerman and Richmond 1981), an individual’s fitness may be enhanced
by having several forms present to catalyze essential reactions. Parsons (1997) provides a general
review of stress and genetic variation.
Box 17.4 Tolerance of Fish to Stressors Increases with
Heterozygosity Sometimes
Studies of allozyme variation by Guttman and coworkers (Kopp et al. 1992, Schlueter et al.
1995) assessed the relationship between effects of stressor exposure and individual hetero-
zygosity. Two of their studies will be used to demonstrate the variation possible in results from
such studies.
Heterozygosity Does Influence Sensitivity
Responses to high metal and low pH conditions were studied in populations of the central
mud minnow (Umbra limi) (Kopp et al. 1992). The concern addressed by this study was the
consequence of acid precipitation on populations of fish endemic to the Adirondack Mountains
(New York, USA). These researchers noted that individuals from water bodies with high alu-
minum and low pH had higher levels of heterozygosity at enzyme-determining loci than those
from reference sites. Slightly more than 200 mud minnows from impacted and reference sites
were exposed in the laboratory to assess whether mud minnows from contrasting sites respon-
ded similarly during acute exposure (96 h) to high aluminum (7.5 mg/L) and low pH (4.5)
conditions. Pooling data for both sexes, Kopp et al. (1992) found that the distribution of fish
among three sensitivity classes (sensitive, intermediate, and tolerant) was positively correlated
with heterozygosity. These data supported the concept that fitness measures tend to increase as
individual heterozygosity increases.
© 2008 by Taylor & Francis Group, LLC
Clements: “3357_c017” — 2007/11/9 — 18:42 — page 326 — #22
326 Ecotoxicology: A Comprehensive Treatment
Heterozygosity Does Not Influence Sensitivity
Astatistically more robust experimental design was applied by Schlueter et al. (1995) to address
the relationship between genetic variation at enzyme-determining loci and differential survival
of more than a thousand fathead minnow (Pimephales promelas) exposed to copper. Survival
time analyses were applied so the gross assignment of fish to sensitive, intermediate, and tol-
erant classes could be avoided. A model predicting survival time based on fish weight and
number of heterozygous loci was produced and null hypotheses of no significant effect of these
two covariates tested with a χ
2
test. Although fish size was significantly (α = .05) and pos-
itively related to survivorship, there was no apparent effect of number of heterozygous loci
on survival of fathead minnows during copper exposure. These data clearly did not support
the premise that measures of fitness tend to increase as individual heterozygosity increases. In
another case, this failure to observe an effect could have been attributed to a lack of statistical
power; however, the experiment involved large numbers of individuals and a powerful analysis
technique.
17.4 GENETIC DIVERSITY AND EVOLUTIONARY
POTENTIAL
Although discussed to this point as an indicator of population state or change, genetic diversity
itself is crucial to the long-term viability of species populations. Mutation rates are extremely low
relative to the rates of toxicant-accelerated drift, and the balance between drift and mutation is
complex as evidencedby ourabovediscussions. Regardless, anemerging concern ofmany population
ecotoxicologists (e.g., Kopp et al. 1992, Mulvey and Diamond 1991) is the ratcheting downward of
genetic diversity due to neutral theory-related consequences of pollution. Because genetic variation
is the raw material on which natural selection works, the evolutionary potential of species might
be lowered by toxicant exposure. Such long-term impacts of toxicant exposure are very difficult to
quantify and are rarely addressed in the development of regulations.
17.5 SUMMARY
Several kinds of mechanisms for DNA damage are described in this chapter, suggesting ample
opportunity for direct mutagenic effects of toxicants on species germ lines. Indirect effects on the
germ lineare discussedbased on neutral population genetic theory. In the absenceof naturalselection,
modified stochastic processes as a consequence of toxicant exposure can have a significant impact
on population genetic characteristics. The dynamics of such changes and tools for identifying them
are described. On the basis of neutral theory, the potential for loss of genetic diversity is discussed.
Ecotoxicology will benefit from incorporation of these concepts into the assessment of toxicant
effects on populations. Natural selection as described in the next chapter could greatly modify these
predictions of toxicant-driven reductions in genetic diversity (Mulvey and Diamond 1991).
17.5.1 SUMMARY OF FOUNDATION CONCEPTS AND PARADIGMS
• Toxicants that are mutagens can influence the germ line directly.
• Stochastic processes can influence the germ line.
• Hardy–Weinbergequilibriumin apopulationof diploid speciesisbased on theassumptions
of an effectively infinite population, no natural selection, and negligible mutation rates
and migration rates. Violations of any of these assumptions can result in deviations from
Hardy–Weinberg expectations.
© 2008 by Taylor & Francis Group, LLC
Clements: “3357_c017” — 2007/11/9 — 18:42 — page 327 — #23
Population Genetics: Damage and Stochastic Dynamics of the Germ Line 327
• Genetic drift can be accelerated by a toxicant-related decrease in the effective population
size. The decrease in effective population can result from toxicant effects on total popu-
lation size, sex ratio, natality, mean generation time, population structure, and brood size
variance.
• In addition to accelerated drift, abrupt decreases in effective population size can lead to
genetic bottlenecks and consequent founder effects.
• Genetic diversity ismaintained by abalance between mutationrate and drift. Inastructured
population, migration also influences genetic diversity.
• Effective population size is influenced by the distribution of individuals within a
population.
• Sampling a cryptically structured populationor the presence of migrationinto a population
can result in an apparent deficit of heterozygotes (i.e., the Wahlund effect).
• Wright’s F statistics can be used to describe population genetic structure.
• Increases in multiple-locus heterozygosity are often, but not always, correlated with
increases in individual fitness, including that associated with toxicant stress.
• Loss of genetic diversity due to toxicant exposure can reduce the evolutionary potential
of a species population.
REFERENCES
Ayala, F.J., Population and Evolutionary Genetics, The Benjamin/Cummings Publishing Co., Menlo Park, CA,
1982.
Baker, R.J., Van den Bussche, R.A., Wright, A.J., Wiggins, L.E., Hamilton, M.J., Reat, E.P., Smith, M.H.,
Lomakin, M.D., and Chesser, R.K., High levels of genetic change in rodents of Chernobyl, Nature,
380, 707–708, 1996.
Baker, R.J., Van den Bussche, R.A., Wright, A.J., Wiggins, L.E., Hamilton, M.J., Reat, E.P., Smith, M.H.,
Lomakin, M.D., and Chesser, R.K., High levels of genetic change in rodents of Chernobyl, Nature,
390, 100, 1997.
Beerli, P., 1998. MIGRATE. />Berrli, P. and Felsenstein, J., Maximum-likelihood estimation of migration rates and effective population
numbers in two populations using a coalescent approach, Genetics, 152, 763–773, 1999.
Bootma, D. and Hoeijmakers, J.H.J., The molecular basis of nucleotide excision repair syndromes, Mutat. Res.,
307, 15–23, 1994.
Bossart, J.L. and Prowell, D.P., Genetic estimates of population structure and gene flow: Limitations, lessons
and new directions, TREE, 13, 202–206, 1998.
Burdon, R.H., Genes and The Environment, Taylor & Francis, Inc., Philadelphia, PA, 1999.
Bush, R.M., Smouse, P.E., and Ledig, F.T., The fitness consequences of multiple-locus heterozygosity: The
relationship between heterozygosity and growth rate in pitch pine (Pinus rigida Mill.), Evolution, 41,
787–798, 1987.
Cavalli-Sforza, L.L. and Bodmer, W.F., The Genetics of Human Populations, W.H. Freeman and Company,
San Francisco, CA, 1971.
Crow, J.F. and Kimura, M., An Introduction to Population Genetics Theory, Harper & Row Publishers,
New York, 1970.
Danzmann, R.G., Ferguson, M.M., and Allendorf, F.W., Does enzyme heterozygosity influence developmental
rate in rainbow trout, Heredity, 56, 417–425, 1985.
Danzmann, R.G., Ferguson, M.M., and Allendorf, F.W., Heterozygosity and oxygen-consumption rate as
predictors of growth and developmental rate in rainbow trout, Physiol. Zool., 60, 211–220, 1987.
Danzmann, R.G., Ferguson, M.M., and Allendorf, F.W., Heterozygosity and components of fitness in a strain
of rainbow trout, Biol. J. Linn. Soc., 33, 219–235, 1988.
Danzmann, R.G., Ferguson, M.M.,Allendorf, F.W., and Knudsen, K.L., Heterozygosity and developmental rate
in a strain of rainbow trout (Salmo gairdneri), Evolution, 40, 86–93, 1986.
De Finetti, B., Considerazioni matematiche sul l’ereditarieta mendeliana, Metron, 6, 1–41, 1926.
© 2008 by Taylor & Francis Group, LLC
Clements: “3357_c017” — 2007/11/9 — 18:42 — page 328 — #24
328 Ecotoxicology: A Comprehensive Treatment
Diamond, S.A., Newman, M.C., Mulvey, M., Dixon, P.M., and Martinson, D., Allozyme genotype and time
to death of mosquitofish, Gambusia affinis (Baird and Girard), during acute exposure to inorganic
mercury, Environ. Toxicol. Chem., 8, 613–622, 1989.
Dykhuizen, D.E., Dean, A.M., and Hartl, D.L., Metabolic flux and fitness, Genetics, 115, 25–31, 1987.
Eichhorn, G.L.,Active sites of biological macromolecules and their interaction with heavy metals, In Ecological
Toxicology Research. Effects of Heavy Metals and Organohalogen Compounds, McIntyre, A.D. and
Mills, C.F. (eds.), Plenum Press, New York, 1974, pp. 123–214.
Facemire, C.F., Gross, T.S., and Guillette, L.J., Jr., Reproductive impairment in the Florida panther: Nature or
nuture? Environ. Health Perspect., 103(Suppl. 4), 79–86, 1995.
Ferguson, M.M., Developmental stability of rainbow trout hybrids: Genomic coadaptation or heterozygosity?
Evolution, 40, 323–330, 1986.
Forbes, V.E., Genetics and Ecotoxicology, Taylor & Francis, Inc., Philadelphia, PA, 1999.
Fraústo da Silva, J.J.R. andWilliams, R.J.P., The Biological Chemistry ofthe Elements. The Inorganic Chemistry
of Life, Clarendon Press, Oxford, UK, 1993.
Garton, D.W., Koehn, R.K., and Scott, T.M., Multiple-locus heterozygosity and the physiological energetics
of growth in the coot clam, Mulinia lateralis, from a natural population, Genetics, 108, 445–455,
1984.
Gillespie, R.B. and Gutmann, S.I., Chemical-induced changes in the genetic structure of populations: Effects
on allozymes, In Genetics and Ecotoxicology, Forbes, V.E. (ed.), Taylor & Francis, Inc., Philadelphia,
PA, 1999, pp. 55–77.
Hartl, D.L. andClark, A.G., Principles of Population Genetics, SinauerAssociates, Inc., Sunderland, MA, 1989.
Hillis, D.M., Mortiz, G., and Mable, B.K., Molecular Systematics, Sinauer Associates, Inc., Sunderland, MA,
1996.
Hines, B.A., Philipp, D.P., Childers, W.F., andWhitt, G.S., Thermal kinetic differences between allelic isozymes
of malate dehydrogenase (Mdh-B locus) of largemouth bass, Micropterus salmoides, Biochem. Genet.,
21, 1143–1151, 1983.
Hoffman, G.R., Genetic toxicology, In Casarett and Doull’s Toxicology. The Basic Science of Poisons, 5th ed.,
Klaassen, C.D. (ed.), McGraw-Hill Health Professions Division, New York, 1996, pp. 269–300.
Hoffmann,A.A. and Parsons, P.A., Extreme EnvironmentalChange and Evolution, Cambridge University Press,
Cambridge, UK, 1997.
Jablonka, E. and Lamb, M., Epigenetic Inheritance and Evolution, Oxford University Press, Oxford, UK, 1995.
Koehn, R.K., Diehl, W.J., and Scott, T.M., The differential contribution by individual enzymes of glycolysis
and protein catabolism to the relationship between heterozygosity and growth rate in the coot clam,
Mulinia lateralis, Genetics, 118, 121–130, 1988.
Koehn, R.K. and Gaffney, P.M., Genetic heterozygosity and growth rate in Mytilus edulis, Mar. Biol., 82, 1–7,
1984.
Kopp, R.L., Guttman, S.I., and Wissing, T.E., Genetic indicators of environmental stress in central mudminnow
(Umbra limi) populations exposed to acid deposition in the Adirondack Mountains, Environ. Toxicol.
Chem., 11, 665–676, 1992.
Kramer, V.J. and Newman, M.C., Inhibition of glucosephosphate isomerase allozymes of the mosquitofish,
Gambusia holbrooki, by mercury, Environ. Toxicol. Chem., 13, 9–14, 1994.
Lamb, T., Bickham, J.W., Gibbons, J.W., Smolen, M.J., and McDowell, S., Genetic damage in a population of
slider turtles (Trachemys scripta) inhabiting a radioactive reservoir, Arch. Environ. Contam. Toxicol.,
20, 138–142, 1991.
Lavie, B. and Nevo, E., Heavy metal selection of phosphoglucose isomerase allozymes in marine gastropods,
Mar. Biol., 71, 17–22, 1982.
Lavie, B. and Nevo, E., Genetic selection of homozygote allozyme genotpyes in marine gastropods exposed to
cadmium pollution, Sci. Total Environ., 57, 91–98, 1986.
Leary, R.B., Allendorf, F.W., and Knudsen, K.L., Differences in inbreeding coefficients do not explain the
association between heterozygosity at allozyme loci and developmental stability in rainbow trout,
Evolution, 41, 1413–1415, 1987.
McAndrew, B.J., Ward, R.D., and Beardmore, J.A., Growth rate and heterozygosity in the plaice, Pleuronectes
platessa, Heredity, 57, 171–180, 1986.
Mitton, J.B., Selection in Natural Populations, Oxford University Press, Oxford, UK, 1997.
© 2008 by Taylor & Francis Group, LLC
Clements: “3357_c017” — 2007/11/9 — 18:42 — page 329 — #25
Population Genetics: Damage and Stochastic Dynamics of the Germ Line 329
Mitton, J.B., Carey, C., and Kocher, T.D., The relation of enzyme heterozygosity to standard and active
oxygen consumption and body size of tiger salamanders, Ambysoma tigrinum, Physiol. Zool., 59,
574–582, 1986.
Mulvey, M. and Diamond, S.A., Genetic factors and tolerance acquisition in populations exposed to metals and
metalloids, In Metal Ecotoxicology. Concepts and Applications, Newman, M.C. and McIntosh, A.W.
(eds.), Lewis Publishers, Chelsea, MI, 1991, pp. 301–321.
Mulvey, M., Keller, G.P., and Meffe, G.K., Single- and multiple-locus genotypes and life-history responses of
Gambusia holbrooki reared at two temperatures, Evolution, 48, 1810–1819, 1994.
Murdoch, M.H. and Hebert, P.D.N., Mitochondrial DNA diversity of brown bullhead from contaminated and
relatively pristine sites in the Great Lakes, Environ. Toxicol. Chem., 8, 1281–1289, 1994.
National Council on Radiation Protection and Measurements, Risk Estimates for Radiation Protection, NCRP
Report 115, NCRP, Bethesda, MD, 1993.
Nei, M.,Analysis of genediversity in subdivided populations, Proc. Natl. Acad. Sci. USA, 70, 3321–3323, 1973.
Nevo, E., Noy, R., Lavie, B., Beiles, A., and Muchtar, S., Genetic diversity and resistance to marine pollution,
Biol. J. Linn. Soc., 29, 139–144, 1986.
Newman, M.C., Quantitative Methods in Aquatic Ecotoxicology, CRC Press/Lewis Publishers, Boca Raton,
FL, 1995.
Newman, M.C., Fundamentals of Ecotoxicology, CRC/Ann Arbor Press, Boca Raton, FL, 1998.
Newman, M.C., Diamond, S.A., Mulvey, M., and Dixon, P., Allozyme genotype and time to death of
mosquitofish, Gambusia affinis (Baird and Girard) during acute toxicant exposure: A comparison of
arsenate and inorganic mercury, Aquat. Toxicol., 15, 141–156, 1989.
O’Brien, S.J., Roelke, M.E., Marker, L., Newman, A., Winkler, C.E., Meltzer, D., Colly, L., Evermann, J.F.,
Bush, M., and Wildt, D.E., Genetic basis for species vulnerability in the cheetah, Science, 227,
1428–1434, 1987.
Ouborg, N.J., Piquot, Y., and van Groenendael, J.M., Population genetics, molecular markers and the study of
dispersal in plants, J. Ecol., 87, 551–568, 1999.
Parsons, P.A., Stress-resistance genotypes, metabolic efficiency and interpreting evolutionary change, In
Environmental Stress, Adaptation and Evolution, Bijlsma, R. and Loeschcke, V. (eds.), Birkhäuser,
Basel, Switzerland, 1997, pp. 291–305.
Pemberton, J.M., Albon, S.D., Guinness, F.E., Clutton-Brock, T.H., and Berry, R.J., Genetic variation and
juvenile survival in red deer, Evolution, 42, 921–934, 1988.
Rannala, B. and Hartigan, J., Estimating gene flow in island populations, Genet. Res., 67, 147–158, 1996.
Rannala, B. and Mountain, J., Detecting immigration by using multilocus genotypes, Proc. Natl. Acad. Sci.
USA, 94, 9197–9201, 1997.
Richardson, B.J., Baverstock, P.R., and Adams, M., Allozyme Electrophoresis: A Handbook for Animal
Systematics and Population Studies, Academic Press, Sydney, Australia, 1986.
Robison, S.H., Cantoni, O., and Costa, M.,Analysis of metal-induced DNAlesions and DNA-repair replication
in mammalian cells, Mutat. Res., 131, 173–181, 1984.
Rousset, F. and Raymond, M., Statistical analyses of population genetic data: New tools, old concepts, TREE,
12, 313–317, 1997.
Samollow, P.B. and Soulé, M.E., A case of stress related heterozygote superiority in nature, Evolution, 37,
646–649, 1983.
Schlueter, M.A., Guttman, S.I., Oris, J.T.,and Bailer,A.J., Survivalof copper-exposed juvenile fathead minnows
(Pimephales promelas) differs among allozyme genotypes, Environ. Toxicol. Chem., 14, 1727–1734,
1995.
Selander, R.K., Behavior and genetic variation in natural populations, Am. Zool., 10, 53–66, 1970.
Smouse, P.E., The fitness consequences of multiple-locus heterozygosity under the multiplicative overdomin-
ance and inbreeding models, Evolution, 40, 946–957, 1986.
Spiess, E.B., Genes in Populations, John Wiley & Sons, New York, 1977.
Stone, R., Can a father’s exposure lead to illness in his children? Science, 258, 31, 1992.
Strittholt, J.R., Guttmann, S.I., and Wissing, T.E., Low levels of genetic variability of yellow perch (Perca
flavescens) in Lake Erie and selected impoundments, In The Biogeography of the Island Region
of Western Lake Erie, Downhower, J.F. (ed.), Ohio State University Press, Columbus, OH, 1988,
pp. 246–257.
© 2008 by Taylor & Francis Group, LLC