ECOTOXICOLOGY: A Comprehensive Treatment - Chapter 18 pptx
Bạn đang xem bản rút gọn của tài liệu. Xem và tải ngay bản đầy đủ của tài liệu tại đây (389.21 KB, 21 trang )
Clements: “3357_c018” — 2007/11/9 — 18:26 — page 331 — #1
18
Population Genetics:
Natural Selection
18.1 OVERVIEW OF NATURAL SELECTION
Natural Selection acts exclusively by the preservation and accumulation of variations, which are beneficial
under the organic and inorganic conditions to which each creature is exposed at all periods of life.
(Darwin 1872)
18.1.1 GENERAL
Natural selection will now be described in order to complete our discussion of pollutant-influenced
evolution. More specifically, natural selection resulting in microevolution will be explored. Micro-
evolution is evolution within a species in contrast to macroevolution that focuses on evolutionary
processes and trends encompassing many species. Emphasis will be placed on microevolution leading
to enhanced resistance.
The terms resistance and tolerance will be used interchangeably as done elsewhere (Forbes and
Forbes 1994, Newman 1991, 1998, Weis and Weis 1989). Some authors object to this synonymy,
reserving resistance to mean the enhanced ability to cope with toxicants because of genetic adapt-
ation and tolerance to mean the enhanced ability to cope with toxicants because of physiological,
biochemical, or some other acclimation.
Natural selection is the change in relative genotype frequencies through generations resulting
from differential fitnesses of the associated phenotypes. Pertinent differences in phenotype fitness
can involve viability (survival) or reproductive aspects of an individual’s life. Natural selection
has the same basic qualities regardless of the life cycle component(s) in which it manifests. It has
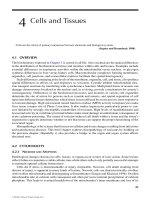
three required conditions and two consequences (Figure 18.1) as summarized by Endler (1986).
The first requisite condition is the existence of variation among individuals relative to some trait.
The second is fitness differences associated with differences in that trait, i.e., differences in survival
or reproductive success among phenotypes. The third condition is inheritance: the trait must be
heritable. Of course, another implied requisite is Thomas Malthus’s that individuals in populations
are capable of producing offspring in numbers exceeding those needed to simply replace themselves.
Excess production of individuals in each generation combined with heritable differences in fitness
among individuals have predictable consequences.
As the first consequence of these conditions, the frequency of a heritable trait will differ among
age or life stage classes of a population. As detailed in Chapter 15, differences in survival and
reproduction among individuals in demographic classes result in differences in the reproductive
value (V
A
) of individuals. This leads to the second consequence. The frequency of the trait from
adult to offspring, i.e., across generations, will change due to trait-related differences in fitness. This
change will be larger than expected due to random drift alone (i.e., due to stochastic processes alone).
The net result is natural selection.
Differences in fitness can manifest in two ways. Differences may be controlled by one locus with
the appearance of distinct fitness classes. Insuch cases of “Mendelian genetics,” one genotype may be
intolerant, another tolerant, and a third intermediate between the two. For example, Yarbrough et al.
(1986) studied cyclodiene pesticide resistance in a population of mosquitofish (Gambusia affinis)
endemic to an agricultural region of Mississippi and found resistance to be determined by a single,
autosomal gene. Three distinct phenotypes were present for resistance. During acute cyclodiene
331
© 2008 by Taylor & Francis Group, LLC
Clements: “3357_c018” — 2007/11/9 — 18:26 — page 332 — #2
332 Ecotoxicology: A Comprehensive Treatment
THEN the consequences in that particular environment will be,
If a population in a particular environment possesses,
Trait
variation
Trait will vary with
age or stage
Trait will vary from
parent to offspring
Fitness
differences
Heritable
trait
Age
Generation
Year 4
Year 3
Year 2
Year 1
X
X
X
X
FIGURE 18.1 Syllogism of natural selection (Endler 1986). If the three conditions of trait variation,
trait-related fitness differences, and trait heritability exist, then the trait frequency will vary in a predictable
manner among age/stage classes and generations of a population.
exposure, resistance of heterozygotes (R/S) was intermediate to that of the sensitive (S/S) or resistant
(R/R) homozygotes. Alternately, phenotype can be determined by several or many genes, resulting
in a continuum of fitness states in a population. Such instances of “quantitative traits” are treated
differently from instances of Mendelian genetics, and the rate of adaptation is different from that
expected for a trait controlled by a single gene, e.g., selection is more rapid for traits under monogenic
control versus those under polygenic control (Mulvey and Diamond 1991). Quantitative genetics
methods for measuring toxicant-induced effects will be applied in Section 18.2.2.
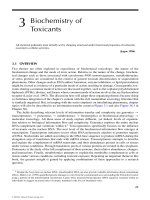
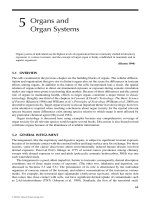
Selection can be directional, stabilizing, or disruptive (Figure 18.2). Directional selection
involves the tendency toward higher fitness at one side of the distribution of phenotypes (quant-
itative trait) or for a particular homozygous phenotype (Mendelian trait). The cyclodiene insecticide
resistance in mosquitofish reported by Yarbrough et al. (1986) would result in directional selection.
Stabilizing selection tends to favor intermediate phenotypes. Disruptive selection would favor the
extreme phenotypes. Changes in the frequency of allozymes in pollution stressed gastropod species
mentioned in Chapter 17 (Lavie and Nevo 1986a) suggested higher fitnesses of homozygotes than
heterozygotes. In such a case, disruptive selection might be anticipated.
Several concepts associated with this overview of natural selection require comment at this point.
(1) Differencesinfitnessarespecifictoa particularenvironmentandtherelativefitnesses of genotypes
can change if the environment changes sufficiently. Natural selection and fitness are specific to the
environmental conditions under which individuals in the population exist, e.g., a species population
that has adapted successfully to an environmental toxicant will not necessarily be optimally adapted
for a clean habitat. (2) Natural selection leading to successful adaptation relative to one environment
or environmental condition does not necessarily result in optimal adaptation for another environment
or environmental condition. For example, adaptation to cope with a particular pollutant may not
necessarily result in a population of individuals well adapted to another or to a natural stressor.
(3) Consistent, environment-specific differences in fitness are needed for natural selection to occur.
Natural selection would not be possible if relative fitnesses of genotypes shifted randomly in direction
and magnitude among generations. Natural selection can involve consistent relative fitnesses of
genotypes or average relative fitness differences among genotypes in a fluctuating environment. The
© 2008 by Taylor & Francis Group, LLC
Clements: “3357_c018” — 2007/11/9 — 18:26 — page 333 — #3
Population Genetics: Natural Selection 333
Directional
Stabilizing
Disruptive
Quantitative trait Mendelian trait
FIGURE 18.2 An illustration of directional, stabilizing, and disruptive selection for quantitative (left-hand
side) and Mendelian (right-hand side) traits. (Modified from Figure 1.3 of Endler (1986) and Figure 2 of Mulvey
and Diamond (1991).)
magnitude of the fitness differences may change somewhat, but the relative fitness of one genotype to
another cannot abruptly and randomly change from one generation to another. (4) Without sufficient
genetic variability, a species population may fail to adapt and will become locally extinct. (5) Because
most environments are temporally and spatially variable, microevolution by natural selection can
involve a population genome that shifts from one “best obtainable” state to another.
Natural selection for traits or trait complexes within genetic subpopulations (demes) can impart to
individuals within demes temporally and spatially defined optimal fitness, i.e., Wright’s shifting bal-
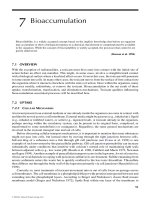
ance theory (Wright 1932, 1982) (Figure 18.3). A species population occupying a landscape through
time might be composed of many demes shifting continually to obtain the highest fitness of associ-
ated individuals. Demes continually climb toward the highest obtainable fitness peak in a changing
“adaptive landscape.” Random genetic drift allows the deme to explore the adaptive landscape and
natural selection then moves the deme to the nearest optimal fitness peak. This process is repeated,
resulting in demes that continually explore the adaptive landscape and establish themselves on obtain-
able adaptive peaks. According to Wright’s shifting balance theory, there may be interdemic selection
within a shifting landscape of environmental factors (Hoffmann and Parsons 1997). However, cau-
tion should be used when applying this last concept of interdemic selection, i.e., group selection
working on competing demes within an adaptive landscape (Coyne et al. 1997, 2000, Hartl and
Clark 1989). Although some studies suggest a certain amount of support (e.g., Ingvarsson 1999 and
references therein), Sewall Wright’s theory of interdemic selection has not been generally supported
by observational or experimental data. Regardless, important and relevant components of the shifting
balance theory are demonstrably accurate (Coyne et al. 1997, 2000). The theory is mentioned here
only to indicate that, through genetic drift and natural selection on individuals, demes tend to shift
continually within an adaptive landscape to occupy local peaks of optimal fitness. These peaks shift
through time as the environment changes and natural selection working on individuals moves the
deme toward a new optimal fitness peak. Genetic drift allows exploration of nearby regions from
© 2008 by Taylor & Francis Group, LLC
Clements: “3357_c018” — 2007/11/9 — 18:26 — page 334 — #4
334 Ecotoxicology: A Comprehensive Treatment
C
A
B
A*
C*
High
Low
Fitness
A
C
B
A*
C*
C*
B*
B*
FIGURE 18.3 Shifting balance theory (Wright 1932). The three phases of this theory combine genetic drift
and natural selection to produce interdeme selection (i.e., group selection). Demes undergo genetic drift
(upper panel), which allows them to move from one adaptive peak through an adaptive valley to another
peak (Phase I). Then, selection within demes maintains each at an adaptive peak (middle panel, Phase II).
The best adapted deme will increase in size (number of individuals) and displace less well adapted demes
(lower panel, Phase III), i.e., selection of a group (deme). Although Phase III is not supported by obser-
vational or experimental studies, Phases I and II are and can be important processes in natural populations
(Coyne 1997).
a currently occupied fitness peak. Local populations under continual environmental pressure survive
or even grow larger because of the increase in frequency of the fittest genotypes. It follows that demes
will fail to adjust to changing environmental conditions unless they possess a certain level of genetic
variation.
18.1.2 VIABILITY SELECTION
Perhaps the most conspicuous and commonly studied type of selection by toxicants is that associ-
ated with differential survival, i.e., somatic viability of individuals. Viability selection can occur
throughout the lifetime of an individual and includes fitness differences relative to development of
the zygote, growth after birth, and survival to a sexual adult. For example, winter survival of juvenile
red deer (Cervus elaphus) was correlated with allozyme genotype at several enzyme loci. Selection
was implied from the observed fitness differences (Pemberton et al. 1988). A well-studied example
involving pollution is the industrial melanism described in Chapter 12.
Differential survival is the most habitually studied quality in studies of pollutant-related viability.
Many early studies involved the acquisition of tolerance to poisons in target and some nontarget
species populations. Much of this work demonstrated rapid change of pest populations to chemicals
applied to control them. Carson’s Silent Spring (1962) includes many pages that discuss the rapid
increase in survival of individuals in insect populations due to natural selection. Webb and Horsfall
(1967) described the rapid decrease in pine mouse (Pitymys pinetorum) mortality after several years
© 2008 by Taylor & Francis Group, LLC
Clements: “3357_c018” — 2007/11/9 — 18:26 — page 335 — #5
Population Genetics: Natural Selection 335
of control with endrin. Whitten et al. (1980) studied survival of insecticide-adapted sheep blowflies
and Partridge (1980) described rodenticide (Warfarin) resistance in rats. Given this initial focus on
the lose of pesticide efficacy, it is not surprising that survival came to dominate studies of adaptation
to toxicants.
Much recent work with differential survival applied allozyme methods to identify tolerant or
sensitive genotypes. Beardmore, Battaglia, and coworkers (Battaglia et al. 1980, Beardmore 1980,
Beardmore et al. 1980) and Nevo, Lavie, and coworkers (Lavie and Nevo 1982, 1986a,b, Nevo
et al. 1981) were among the first to apply these methods for exploring the genetic consequences of
toxicant exposure for natural populations. In typical studies, field surveys were done to correlate
allozyme genotype frequencies with degree of toxicant contamination. To augment these observa-
tions, individuals differing in allozyme genotypes were subjected to acutely toxic concentrations of
toxicants in laboratory tests. The distribution of genotypes among survivors and dead individuals
after exposure was used to imply differential fitness for the putative genotypes. The results would
then be used to speculate about potential consequences to field populations exposed to much lower
concentrations for longer periods of time. Speculation was normally based on the assumption that
viability selection was the sole or dominant component of selection and that differences noted at
high concentrations reflect differences at low concentrations.
These allozyme-based experiments continue because allozyme genotypes are relatively easy to
determine and provide genetic markers for population processes. In North America, Chagnon and
Guttman (1989) and Gillespie and Guttman (1989) used this approach and suggested differential
survival of mosquitofish (Gambusia holbrooki) and central stonerollers (Campostoma anomalum)
of specific allozyme genotypes during acute exposure to metals. Results were compared with or used
to imply a mechanism for changes in field populations. Similar studies also indicated differential
fitness among acutely exposed, allozyme genotypes (e.g., Keklak et al. 1994, Morga and Tanguy
2000, Schlueter et al. 1995, 2000); however, the more powerful survival analysis methods introduced
by Diamond et al. (1989) and Newman et al. (1989) were applied (see Chapter 13). Newman (1995)
and Newman and Dixon (1996) provide details for analyzing such allozyme-survival time data.
Mulvey and Diamond (1991) and Gillespie and Guttman (1999) provide reviews of studies relating
allozyme genotype and toxicant exposure.
Box 18.1 Mercury, Mosquitofish, Metabolic Allozyme Genotype, and Survival
Chagnon and Guttman (1989) suggested a relationship between survival of acute metal
exposure and allozyme genotype, but many crucial facets of this relationship remained
unexplored. Studies of mosquitofish and mercury were undertaken to provide an in-depth
study of allozyme genotype-related fitness effects during metal exposure and to examine
the major qualities of such a relationship. In the first study (Diamond et al. 1989), nearly
a thousand mosquitofish (G. holbrooki) were exposed to 0 mg/L or 1 mg/L inorganic mercury,
and times-to-death were noted at 3- to 4-h intervals for 10 days. The sex and wet weight of
each fish were noted at death and individual fish were frozen for later allozyme analysis. In
contrast to the negligible mortality in the reference tanks, 548 of 711 (77%) fish died in the
mercury exposure tanks. Survival time methods were used to fit data to multivariate models
(ln of time-to-death (TTD) = f (fish wet weight, sex, genotypes at 8 isozyme loci)) and to
test for significant effect (α = 0.05) of the covariates on time-to-death. Not surprisingly,
fish sex and size had significant influences on time-to-death: survival time was shorter for
males than females and shortened as fish weight decreased. But a remarkable three of the
eight isozyme loci (isocitrate dehydrogenase-1, Icd-1; malate dehydrogenase-1, Mdh-1; and
glucosephosphate isomerase-2, Gpi-2 = Pgi-2) had statistically significant effects on time-to-
death. The first two of these enzymes were Krebs cycle enzymes and the last was a glycolytic
enzyme.
© 2008 by Taylor & Francis Group, LLC
Clements: “3357_c018” — 2007/11/9 — 18:26 — page 336 — #6
336 Ecotoxicology: A Comprehensive Treatment
A common explanation for relationships between allozyme genotypes and survival is
that different genetically determined forms of the enzymes (e.g., different allozymes of
GPI-2) differ in their capacity to bind metals and, consequently, to have their catalytic
activities affected by metals. However, other studies (e.g., Watt et al. 1985) suggest that,
due to the crucial roles of these enzymes in metabolism, it was equally plausible that the
different allozymes produced differences in metabolic efficiencies for stressed mosquitofish.
Some genotypes might be metabolically more fit under stress than others. To assess these
competing hypotheses, the experiment was repeated with a different toxicant (arsenate) that
had a distinct mode-of-action (i.e., interference with oxidative phosphorylation). The binding
of the oxyanion, arsenate, to enzymes would be quite different than that of the mercury cation.
If binding with consequent enzyme dysfunction were the mechanism for the differential
effect of mercury on Gpi-2 genotypes, the trend noted for mercury-exposed fish would not be
predicted for arsenate-exposed fish.
In addition, it was possible that sampling of the fish from the source population uninten-
tionally resulted in subsampling a structured population with lineages differing in tolerance
and having more or less of one particular genotype by chance alone. Allozyme genotypes
could merely be correlated with lineages that differed in their tolerances for one or more
reasons (see Section 18.2.2). This possibility was reinforced by mosquitofish reproductive and
ecological characteristics combined with the highly structured pond from which the fish were
taken. Another exposure study was done several months after the first during another annual
reproductive pulse, allowing the source population time to grow and change structuring via
lineages.
The results (Newman et al. 1989) indicated that the Gpi-2 effect on TTD was present for
arsenate as well as mercury exposure. The most sensitive genotype (Gpi
38/38
) was the same for
both toxicants. This suggested that the enzyme inactivation hypothesis was incorrect for the
Gpi-2 effect on survival. The relationships involving the other two loci were not seen again,
suggesting that sampling artifacts from a structured source population likely produced these
last two relationships. (See Lee et al. (1992) below (Box 18.4) for supporting justification for
this conclusion.)
Heagler et al. (1993) found this Gpi-2 effect on TTD during mercury exposure to be
consistent through time. Similar results were obtained when the mercury exposure was
repeated several years after the Diamond et al. (1989) and Newman et al. (1989) studies. Her
work further supported the premise that the Gpi-2 effect was not an artifact associated with
ephemeral population structuring. During the 1993 testing, groups of fish from the same source
population were exposed to several mercury concentrations. Although GPI-2 did influence
TTD at most concentrations, differences in allozyme fitness were obscured above a certain
mercury concentration.
Kramer and Newman (1994) further tested the assumption that differential fitness of
allozyme genotypes resulted from metal inactivation of the enzymes. Mosquitofish GPI-2
allozymes were partially purified and subjected in vitro to a series of mercury concentrations.
The degree of inactivation of these Gpi-2 allozymes was not correlated with the differential
survival of the Gpi-2 genotypes, suggesting again that inactivation was not the mechanism
for the observed differential survival. Kramer et al. (1992a,b) also examined glycolysis and
Krebs cycle metabolites in fish with different Gpi-2 genotypes and found that the sensitive
genotype (Gpi-2
38/38
) displayed shifts in metabolism during exposure to mercury that were
distinct from the other Gpi-2 genotypes. These differences in allozyme genotype sensitivity
were a function of metabolic differences under toxicant stress, not differences in metal binding
to and inactivation of allozymes.
The results suggested that Gpi-2 genotype frequencies might be useful as a marker of
population level response to stressors. However, potential effects of population structure,
© 2008 by Taylor & Francis Group, LLC
Clements: “3357_c018” — 2007/11/9 — 18:26 — page 337 — #7
Population Genetics: Natural Selection 337
toxicant concentration, and intensity of other stressors must also be understood and controlled
in any such exercise. As will be discussed in the next section, the potential for selection also
occurring for reproductive traits could complicate prediction based solely on differences in
survival.
18.1.3 SELECTION COMPONENTS ASSOCIATED WITH
REPRODUCTION
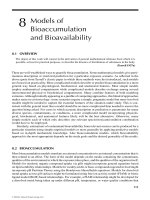
Selection can occur at other equally important components of an organism’s life cycle (Figure 18.4).
This was evident from the very first elucidation of the concept of natural selection as evidenced by
Charles Darwin’s phrase “at all periods of life” in the opening quote of this chapter. The first selection
component (viability selection, SC1) involves survival differences and other fitness differences from
zygote formation to sexual maturity. Viability selection could be measured for different age classes
(e.g., Christiansen et al. 1974). There might be differences in development from zygote to a mature
adult. These differences might involve survival or growth rates as discussed briefly in Chapter 16.
Obviously, any increase in the probability of an individual reaching sexual maturity and surviving
for a long period as a sexually active adult will also enhance reproductive success.
Selection component SC2 (sexual selection) in Figure 18.4 involves differential success of adults
in finding, attracting, or retaining mates. For example, Watt et al. (1985) found differential mating
success in Colias butterflies that differed in genotype at a phosphoglucose isomerase (Gpi) locus. Like
Kramer et al. (1992a,b) above, they attributed these differences in fitness to metabolic differences
among Gpi genotypes. Sexual selection can occur for males (male sexual selection) or females
(female sexual selection). Sexual selection might also involve differential success of mating pairs.
Some genotype pairs may have a higher probability than others of being successful mates.
Three additional selection components involve the processes of gamete production and success-
ful zygote formation. Meiotic drive (SC3) involves the differential production of the possible gamete
types by heterozygotes. Sperm or ova may be produced with unequal allele representation by het-
erozygous individuals, leading to a higher probability of production of certain offspring genotypes.
Gametic selection (SC4) can occur if certain gametes produced by heterozygotes have a higher prob-
ability of being involved in fertilization than others. Fecundity selection (SC5) can occur if pairs of
certain genotypes have more offspring than others.
Endler (1986) makes the important observation that several selection components often co-occur
and it is essential to understand the balance between fitnesses at these different components. Acareful
Adult
Male/female
pair
Zygote
Gamete
SC4 gametic
selection
SC5 fecundity
selection
SC2 sexual
selection
SC3 meiotic
drive
SC1 viability
selection
FIGURE 18.4 Selection components in the life cycle of individuals (see text for details).
© 2008 by Taylor & Francis Group, LLC
Clements: “3357_c018” — 2007/11/9 — 18:26 — page 338 — #8
338 Ecotoxicology: A Comprehensive Treatment
re-examination of Box 12.1 will show that a preoccupation at one point (adult predation by visual
predators) distracted researchers for some time from selection at other life cycle stages (pre-adult
survival). Prediction from one component (e.g., viability during acute toxicant exposure) can lead to
inaccurate conclusions regarding selection consequences. In fact, there are indications that selection
for reproductive components may be much more common than viability selection (Clegg et al. 1978,
Nadeau and Baccus 1981).
Selection components analysis is possible for many species (e.g., Bungaard and Christiansen
1972, Christiansen and Frydenberg 1973, Christiansen et al. 1973, Nadeau et al. 1981, Siegismund
and Christiansen 1985, Williams et al. 1990). The analysis requires known parent–offspring combin-
ations and scoring of genotypes for a series of demographic classes (e.g., mother–offspring pairs),
adult females (gravid or nongravid), and adult males. The sequence of hypotheses (Table 18.1) are
tested for these data with χ
2
statistics. The hypotheses in selection component analysis are tested
sequentially and testing stops after a hypothesis is rejected. Each hypothesis test in the sequence is
based on the assumption that the previously tested hypotheses were not “false,” i.e., not rejected in
a statistical test.
TABLE 18.1
Sequential Hypotheses Tested in Selection Component Analysis
Sequence Hypothesis
First Half of the offspring of heterozygous females are heterozygous (implying that there is no selection among
female’s gametes). Rejection implies gametic selection.
Second The frequency of transmitted male’s gametes is independent of the genotype of a female. Rejection of this
hypothesis implies nonrandom mating with female sexual selection.
Third The frequency of transmitted male gametes is equal to the frequency in adult males. Rejection implies
differential male mating success and gametic selection in males.
Fourth The genotype frequencies are equal among gravid and nongravid adult females. Rejection implies differential
female mating success.
Fifth Genotype frequencies are equal for male and female adults. Rejection implies that zygotic (viability) selection
is not the same for males and females.
Sixth The adult genotype frequency is the same as that estimated for the zygotic population. Rejection implies
zygotic (viability) selection.
Source: From Table IV of Christiansen and Frydenberg’s (1973) as modified by Newman (1995).
Box 18.2 Selection Components for Mercury-Exposed Mosquitofish
Most studies of natural selection contain three major faults: (1) no estimates of lifetime fitness;
(2) consideration of only a few traits; and (3) unknown or poorly known trait function.
(Endler 1986)
Our studies of mercury-exposed mosquitofish attempt to avoid the shortcomings described
above by Endler. The glycolytic differences noted in mercury-exposed mosquitofish genotypes
define a Gpi-2 trait function potentially resulting in fitness differences. Points 1 and 2 will now
be addressed.
The work of Mulvey et al. (1995) (Box 16.1) was used to illustrate the concepts of reaction
norms and energy allocation trade-offs. Unsatisfied with predictions from the viability differ-
ences described in Box 18.1, Mulvey et al. (1995) used selection component analysis to explore
the possibility of reproduction-related fitness differences in populations chronically exposed to
© 2008 by Taylor & Francis Group, LLC
Clements: “3357_c018” — 2007/11/9 — 18:26 — page 339 — #9
Population Genetics: Natural Selection 339
TABLE 18.2
Results of Selection Component Analysis for the Gpi-2
Locus of Mercury-Exposed Mosquitofish
P Values from χ
2
Test for
Each Replicate Mesocosm
Control Mercury-Spiked
Hypothesis Mesocosms Mesocosms
Female gametic selection? 0.54 0.64 0.07 0.71
Random mating? 0.76 0.96 0.51 0.91
Male reproductive selection? 0.70 0.88 0.07 0.73
Female sexual selection? 0.55 0.52 0.01 0.09
Zygotic selection equal in sexes? 0.54 0.18 0.009 0.26
Zygotic selection? 0.68 0.19 0.42 0.58
Note: Boldfaced P values are judged to indicate selection.
Source: Modified from Table 4 in Mulvey et al. (1995).
mercury. This was possible because the mosquitofish is a prolific, live-bearing species amen-
able to mesocosm study and selection components analysis. Two mesocosm populations were
grown with weekly additions of 18 µg/L of inorganic mercury and two mesocosm popula-
tions were grown in untreated water. After 111 days, all fish were collected and their sex,
size, reproductive status (gravid/nongravid), and number of late stage embryos per gravid
female determined. Selection components analysis as just described was performed for several
allozyme loci; however, only Gpi-2 results are relevant here. The methods of Christiansen et al.
(1973) as implemented with the FORTRAN program listed in Appendix 29 of Newman (1995)
were used to test a series of hypotheses like those in Table 18.2. As described in Box 16.1, rare
Gpi-2 alleles were combined in the analyses. An analysis of covariance (ANCOVA) was then
applied to the number of late stage embryos carried by each gravid female to assess whether
fecundity selection was occurring.
Female sexual selection was suggested from the results of the selection component analysis
(Table 18.2). For the two control mesocosms, P values from the hypothesis testing (SC2) were
.55 and .52. This suggested no female sexual selection was occurring under control conditions.
However, the P values for the mercury-spiked mesocosms were .01 and .09. These low P values
were taken to indicate female sexual selection and no further hypotheses were evaluated.
Whether a mature female was gravid or not was dependent on its Gpi-2 genotype. Approx-
imately 68–71% of females were gravid for all genotypes and treatments, with one important
exception. Only 43% of Gpi-2
100/100
homozygous females were gravid in the mercury-spiked
mesocosms. ANCOVA also indicated (P = .01) that, if gravid, a Gpi-2
100/100
female carried
fewer developing embryos than the other genotypes.
These results indicating a reproductive disadvantage for Gpi-2
100/100
genotypes are partic-
ularly important because the genotype least likely to survive acute mercury exposure was the
Gpi-2
38/38
homozygote. The potential exists for balancing selection components, that is, viab-
ility selection balanced against female sexual and fecundity selection. Under some conditions,
one component might outweigh another in determining the selection-driven changes in allele
frequencies of a population. The results allowed a complete description of fitness differentials
for several selection components, avoiding the second shortcoming listed above by Endler for
studies of natural selection.
Aware that balancing selection was possible and that wild populations of mosquitofish exper-
ience wide variation in effective population size and migration, Newman and Jagoe (1998)
conducted simulations of Gpi-2 allele frequency changes in mosquitofish populations exposed
© 2008 by Taylor & Francis Group, LLC
Clements: “3357_c018” — 2007/11/9 — 18:26 — page 340 — #10
340 Ecotoxicology: A Comprehensive Treatment
acutely and chronically to mercury for many generations. In this way, overall fitness con-
sequences (Endler’s fault 1 above) could be defined more fully under different conditions.
Results indicated that Gpi-2 allele frequencies did change in predictable ways despite the
potentially confounding effects of balancing selection, accelerated genetic drift, and migra-
tion. In general, viability selection seemed to overshadow reproductive selection components
and toxicity-related acceleration of genetic drift. These results supported field studies by Heagler
et al. (1993) suggesting that cautious use of Gpi-2 as a marker of population-level effects was
possible.
18.2 ESTIMATING DIFFERENTIAL FITNESS AND
NATURAL SELECTION
To understand natural selection, and for predictive purposes, it is not sufficient merely to demonstrate
that selection occurs; we need to know its rate, at least in the populations under study. Rates are estimated
and predicted for selection coefficients and differentials.
(Endler 1986)
18.2.1 FITNESS,RELATIVE FITNESS, AND SELECTION COEFFICIENTS
How are differences in fitness quantified? The conventional presentation of methods (Ayala 1982,
Gillespie 1998) begins with a trait determined by one locus with two alleles (i.e.,A
1
andA
2
). Under the
assumptions of the Hardy–Weinberg relationship, the A
1
A
1
,A
1
A
2
, and A
2
A
2
genotype frequencies
are predicted by 1 = q
2
+ 2pq + p
2
where q = the A
1
allele frequency and p = the A
2
allele
frequency. However, Equation 18.1 depicts the expected genotype frequencies if there are relative
fitnesses to be considered for the three genotypes, w
11
, w
12
, w
22
. Assume, for example, that fitness
differences in viability are determined using the frequencies of A
1
A
1
,A
1
A
2
, and A
2
A
2
genotype for
neonates and then again for adults. The relationship among the genotypes for the neonates would
be 1 = q
2
+ 2pq + p
2
. However, prediction of genotype frequencies for adults would involve an
additional factor—differential fitnesses.
w = p
2
w
11
+2pqw
12
+q
2
w
22
, (18.1)
where
w = the average fitness for all genotypes. Equation 18.1 can be rearranged to normalize
fitness to the average fitness:
1 = p
2
w
11
w
+2pq
w
12
w
+q
2
w
22
w
. (18.2)
Now, the frequencies of the three genotypes are predicted as a function of Hardy–Weinberg
expectations (e.g., p
2
) adjusted for the normalized fitness values (e.g., (w
11
/w)) of each genotype.
Predicted frequencies of allelesA
1
and A
2
after such selection are defined by the following equations
(Ayala 1982, Gillespie 1998):
p
1
= p
2
w
11
w
+pq
w
12
w
, (18.3)
q
1
= pq
w
12
w
+q
2
w
22
w
. (18.4)
© 2008 by Taylor & Francis Group, LLC
Clements: “3357_c018” — 2007/11/9 — 18:26 — page 341 — #11
Population Genetics: Natural Selection 341
The change in p (
p
= p
1
− p) and q (
q
= q
1
− q) frequencies per generation are predicted
from the following equations (Ayala 1982, Gillespie 1998, Spiess 1977):
p
=
pq [p(w
11
−w
12
) +q(w
12
−w
22
)]
w
, (18.5)
q
=
pq [p(w
12
−w
11
) +q(w
22
−w
12
)]
w
. (18.6)
The change in the average fitness can be estimated iteratively over many generations to visualize
the changes due to selection in the population. According to Fisher’s theorem of natural selec-
tion (Fisher 1930), higher levels of variation in fitness in populations will result in higher rates
of change in average fitness. Conversely, low variation results in slow or minimal selection. (See
Hartl and Clark (1989) for details and equations for applying the above approach to multiple allele
genes.)
Relative fitnesses can also be estimated for genotypes. The quotient of w for each genotype
can be used with the w in the denominator being that for the most fit genotype, for example, w
11
/w
11
,
w
12
/w
11
, and w
22
/w
11
whereA
1
A
1
is assumed to have the highest fitness. These relative fitness values
can also be expressed in terms of a selection coefficient (s = 1 − w where w is the relative fitness
value):
Genotype Fitness (w)
Relative
Fitness
Selection
Coefficient (s)
A
1
A
1
w
11
w
11
/w
11
= 11−(w
11
/w
11
) = 0
A
1
A
2
w
12
w
12
/w
11
1 −(w
12
/w
11
)
A
2
A
2
w
22
w
22
/w
11
1 −(w
22
/w
11
)
As an example, selection against a recessive gene with a w
22
= 0.5 would produce the following
values:
Genotype Fitness (w) Relative Fitness Selection Coefficient (s)
A
1
A
1
w
11
= 1 w
11
/w
11
= 11−(w
11
/w
11
) = 1 −1 = 0
A
1
A
2
w
12
= 1 w
12
/w
11
= 11−(w
12
/w
11
) = 1 −1 = 0
A
2
A
2
w
22
= 0.5 w
22
/w
11
= 0.5/1 = 0.5 1 − (w
22
/w
11
) = 1 −0.5 = 0.5
Gillespie (1998) expresses selection by including a heterozyous effect (h). The relative fitness
values for A
1
A
1
,A
1
A
2
, and A
2
A
2
become w
11
/w
11
= 1, w
12
/w
11
= 1 −hs, and w
22
/w
11
= 1 −s.
The h is0ifA
1
is completely dominant, 1 if A
1
is completely recessive, or between 0 and 1 if A
1
is partially recessive. Relationships described in Equations 18.5 and 18.6 can be defined in terms of
selection coefficients (i.e., Endler 1986, Spiess 1977). For example, if A
2
is recessive, h = 0, and
selection is occurring for A
2
, Equation 18.7 (Endler 1986) is relevant:
p
=
spq
2
1 −sq
2
. (18.7)
© 2008 by Taylor & Francis Group, LLC
Clements: “3357_c018” — 2007/11/9 — 18:26 — page 342 — #12
342 Ecotoxicology: A Comprehensive Treatment
Box 18.3 Relative Fitness of Mosquitofish Genotypes Exposed to Mercury
After completing the studies described in Boxes 18.1 and 18.2, Newman and Jagoe (1998)
developed computer models to assess the potential use of Gpi-2 allele frequency changes as
markers of population level effects. They explored shifts in allele frequencies under different
exposure scenarios. Many of the scenarios involved differential survival during acute mercury
exposure and estimates of relative fitness for exposed fish were needed for modeling. The
approach of Newman (1995) was used to convert survival time model results to relative fitness
values. The original TTD data were fit to a proportional hazard model (see Section 13.1.3.1 of
Chapter 13) that included effects of fish sex, wet weight, and Gpi-2 genotype. The following
equation describes the resulting model in terms of median TTD:
MTTD = e
4.134
e
0.358
∗
Sex
e
3.157
∗
Weight
e
β
∗
Genotype
e
−0.188
,
where sex is 1 for females and 0 for males, weight is expressed in grams of wet weight,
and genotype = 0 for Gpi-2
38/38
and 1 for all other genotypes. The last term (e
−0.188
) was
estimated from the model’s estimated scale factor (σ ) of 0.514 and the parameter for the
median of a Weibull distribution (−0.36651), that is, e
(0.514
∗
−0.36651)
. This allowed prediction
of the median TTD. The β values (Table 18.3) were estimated for each genotype and reflect
the sensitivity of each genotype relative to an arbitrary reference genotype (Gpi-2
38/38
).
The above model is a proportional hazard model: the hazard to each genotype was constant
through time and the relative hazards of one genotype to any other remain constant. This
allows the expression of the β coefficients as relative risks: relative risk = e
β/σ
. These relative
risks are estimates of genotype fitness that can be transformed to relative fitness values by
simply dividing the relative risk of the most tolerant genotype by the relative risk of each
genotype. The Gpi-2
66/100
was the most tolerant genotype as its relative risk was the smallest
of all genotypes, so 0.402 is divided by all genotypes’ relative risks to estimate relative fitness
values (w) for each genotype. These differences in w and s values were quite large. Hartl and
Clark (1989) indicate that selection coefficients with as small a difference as 1% can have very
significant influence on allele frequencies in a population.
These calculations allowed the results of the toxicity trial to be included in conventional
genetic models to predict changes in allele frequencies under selection. The further inclusion of
reproductive differences in fitness during chronic exposures (i.e., Box 18.2) allowed predictions
based on the combination of viability selection during acute exposure and female sexual and
fecundity selection during chronic exposure to mercury.
TABLE 18.3
Estimation of Relative Fitness Values for Mosquitofish Gpi-2 Genotypes
Genotype β Relative Risk
Relative
Fitness (w)
Selection
Coefficient (s)
100/100 0.370 e
−0.3700/0.514
= 0.487 0.402/0.487 = 0.82 1 −0.82 = 0.18
100/66 0.468 e
−0.468/0.514
= 0.402 0.402/0.402 = 1.00 1 −1 = 0.00
100/38 0.362 e
−0.362/0.514
= 0.494 0.402/0.494 = 0.81 1 −0.81 = 0.19
66/66 0.389 e
−0.389/0.514
= 0.469 0.402/0.469 = 0.86 1 −0.86 = 0.14
66/38 0.339 e
−0.339/0.514
= 0.517 0.402/0.517 = 0.78 1 −0.78 = 0.22
38/38 0 e
−0/0.514
= 1.000 0.402/1.000 = 0.40 1 −0.40 = 0.40
Source: Modified from Example 18 in Newman (1995).
© 2008 by Taylor & Francis Group, LLC
Clements: “3357_c018” — 2007/11/9 — 18:26 — page 343 — #13
Population Genetics: Natural Selection 343
= +
2222
pge
=
222
pg
=
22
pg
e
g × e
σσ
σσ+
σσσσ
+
σ
FIGURE 18.5 The components contributing the variance in a phenotypic trait (see text for details).
18.2.2 HERITABILITY
Heritability of polygenetic traits can be quantified under the assumption that variation in the
phenotypes expressed among individuals results from a combination of genetic variation, envir-
onmental variation, and perhaps the interaction or covariation of genetic and environmental factors
(Figure 18.5).
σ
2
p
= σ
2
g
+σ
2
e
+σ
2
g×e
, (18.8)
where σ
2
p
= the phenotypic variance, σ
2
g
= the genetic variance, σ
2
e
= the environment-related
variance, and σ
2
g×e
= the variance due to the genetic × environment interaction. This last com-
ponent is the covariance between genetic and environmental factors. The environmental component
(σ
2
e
) includes differences among phenotypes due to diverse environmental factors such as nutri-
tion, microhabitat, and developmental conditions. The genetic component (σ
2
g
) of the phenotypic
variance can be separated into the additive variance arising from genetic factors (σ
2
a
), a dominance
component accounting for the influence of differences in gene dominances (σ
2
d
), and epistatic vari-
ance (σ
2
i
). The additive component is simply the sum of the effects of each of the individual genes
contributing to the phenotype. The dominance component includes the influence of gene dominance
on phenotypic expression. Potential epistatic interactions among relevant genes are included in σ
2
i
,
σ
2
p
= σ
2
a
+σ
2
d
+σ
2
i
+σ
2
e
+σ
2
g×e
· (18.9)
Three simplifying assumptions are applied initially in many studies of heritability: (1) quantitative
traits are often normally distributed (Ayala 1982, Gillespie 1998), (2) gene × environment covari-
ance can be ignored initially, and (3) only additive effects need be considered (i.e., Equation 18.10).
Notice that the first assumption of a normally distributed, quantitative trait is inconsistent with the
individual effective dose or individual tolerance hypothesis described in Box 12.2, which assumes
a lognormal distribution for toxicant tolerance. Notice also that, because the dominance compon-
ent (σ
2
d
) of the total phenotype variance is not subject to individual selection, it is not necessary to
© 2008 by Taylor & Francis Group, LLC
Clements: “3357_c018” — 2007/11/9 — 18:26 — page 344 — #14
344 Ecotoxicology: A Comprehensive Treatment
include it below (Equation 18.11) in estimating heritability.
σ
2
p
= σ
2
a
+σ
2
e
· (18.10)
In such a case, the narrow sense heritability (h
2
) is simply the additive variance divided by the
phenotypic variance:
h
2
=
σ
2
a
σ
2
p
· (18.11)
Narrow sense heritability can be estimated using linear regression of the measured trait of off-
spring (dependent variable) versus that of a parent who shares half of its genes (independent variable).
For example, the quantitative trait of interest (e.g., TTD in an acute toxicity test) is measured for
the mother and also for her offspring. This is done for many parent–offspring pairs and a regression
slope (b) calculated using least squares regression. The regression slope (b) is used to estimate h
2
because b = h
2
/2. Division by 2 is required here because only half of the genes in the offspring are
shared with its mother.
Heritability can also be estimated using experiments designed around twins and sibs (Ayala 1982,
Spiess 1977). Alternately, the mean of a trait for both parents (“midparent trait”) can be compared
to that of offspring (Spiess 1977). Although these methods are infrequently applied in ecotoxico-
logy, Klerks and Levinton (1989) estimated the heritability of metal tolerance for the oligochaete
(Limnodrilus hoffmeisteri) using regression of the log of the midparent survival time versus the log
of the mean offspring survival time. Heritability estimates indicated high levels of heritable vari-
ation for metal tolerance. McNeilly and Bradshaw (1968) provide a similar example of estimating
heritability for plants species exposed to heavy metals. Posthuma et al. (1993) estimated heritab-
ility of metal tolerance for a soil springtail (Orchesella cincta) by employing a variety of these
methods.
The qualifier “narrow sense” is applied above to heritability without any explanation. This phrase
is added to distinguish it from the more inclusive, broad sense heritability. Broad sense heritability
(H
2
) includes the other components defined in Equation 18.9:
H
2
=
σ
2
g
σ
2
p
=
σ
2
a
+σ
2
d
+σ
2
i
σ
2
p
. (18.12)
Being the proportion of the total phenotypic variation attributable to all genetic components,
broad sense heritability simply indicates the amount of genetic influence on the trait (Spiess 1977).
Box 18.4 Phenotype Variance and Heritability of Mosquitofish Exposed to Mercury
In studying allozyme effects on TTD of mosquitofish (G. holbrooki) acutely exposed to mer-
cury, Newman, Mulvey, and coworkers became concerned about the amount of phenotypic
variation (TTD) due to environmental, genetic, and genetic × environment interactions (see
Boxes 18.1 through 18.3 for details). The wild caught fish used for these experiments were
collected from an abandoned farm pond with dense masses of submerged vegetation. Because
adult mosquitofish readily consume newborn mosquitofish, clutches of newly born mosquitofish
tend to remain hidden in nearby vegetation until they are large enough not to be readily eaten.
This clustering of broods in vegetation clumps could create discrete lineages that are captured in
a biased manner with dip netting. If high frequencies of some allozyme genotypes are correlated
with specific broods, spurious correlations may occur between allozyme genotypes and TTD.
© 2008 by Taylor & Francis Group, LLC
Clements: “3357_c018” — 2007/11/9 — 18:26 — page 345 — #15
Population Genetics: Natural Selection 345
Perhaps environmental or genetic × environmental interactions produce lineages that differ in
phenotype, not allozyme genotype. Earlier correlations between time-to-death and genotypes
at two allozyme loci (Diamond et al. 1989, Newman et al. 1989) were found to be temporally
inconsistent (Heagler et al. 1993). To address this possibility of spurious correlations due to
temporally variable lineages, Lee et al. (1992) did the following experiment with fish from
the reference population. Central to the analysis of the results are the concepts of sources of
phenotypic variation and heritability.
Gravid females were dip netted from the reference pond and placed into 40 L tanks. They
were allowed to give birth to young that were transferred to 120 L plastic pools. Each pool
contained one brood (sibship) and all pools were situated adjacent to one another outdoors. This
isolation of broods in adjacent pools simulated the spatial isolation occurring in the reference
pond.
The mothers were placed into separate, perforated containers suspended in an exposure tank
3 weeks after producing their broods. Each female’s TTD was then recorded during exposure
to 1 µg/L of mercury. These TTDs were later compared to those of their offspring.
Offspring were reared as described above until they reached sexual maturity. Females from
each brood were exposed as just described for their mothers and the average brood TTD calcu-
lated for each sibship. Males were omitted from exposures and later comparison to their mothers
because previous studies (Diamond et al. 1989, Newman et al. 1989) showed that TTD differed
between males and females.
Narrow sense heritability was estimated by linear regression of mother versus average daugh-
ter TTD (i.e., b = h
2
/2). The slope of the resulting regression line was not significantly different
from 0, i.e., no narrow sense heritability was detected.
The environmental effects associated with sibship isolation during development was also
assessed by applying ANCOVA to TTD data for daughters. Included in the model were sibship
(“Brood”) and mean wet weight of exposed daughters in each sibship. There was a highly sig-
nificant effect of sibship (P = .004) on TTD of the daughters. (The F test for significant effect
of wet weight on TTD resulted in a P = .070.)
These analyses indicate that sharing of a mother and a common habitat during maturation
influenced phenotype (TTD), but there was no evidence of an additive genetic component to
this variation. The concerns of Lee et al. (1992) regarding the potential influence of lineage on
correlations between TTD and allozyme genotypes were quite justified.
18.3 ECOTOXICOLOGY’S TRADITION OF TOLERANCE
it was the advent of DDT and all its many relatives that ushered in the true Age of Resistance.
(Rachel Carson 1962)
Populations exposed to toxicants and not eliminated outright may eventually display increased tol-
erance given sufficient fitness differences, selection pressure, and time. Tolerance may be gauged
with one or more phenotypic traits such as enhanced survival, development, growth, or reproduction.
However, enhanced tolerance will not emerge and local population will become extinct in the absence
of sufficient genetic variation relative to tolerance, consistent selection pressure for tolerance, and
sufficient time.
Key factors influencing the process of tolerance acquisition are summarized in Table 18.4 (modi-
fied from Table1 in Mulvey and Diamond (1991)). Genetic qualities influencing tolerance acquisition
include initial allele frequencies, dominance, number of genes involved in determining the tolerance
phenotype, and the magnitude of the fitness differences among genotypes. Tolerance acquisition will
be slower if it involves a rare allele instead of a more common allele. In addition, there is a higher
© 2008 by Taylor & Francis Group, LLC
Clements: “3357_c018” — 2007/11/9 — 18:26 — page 346 — #16
346 Ecotoxicology: A Comprehensive Treatment
TABLE 18.4
Factors Influencing the Rate at Which Tolerance Is Acquired in Populations
Quality Description of Influence
Genetic qualities
Allele frequency Tolerance will increase more rapidly if the tolerance allele is common, not rare, in the
population before selection begins.
Gene dominance Tolerance increases more rapidly in early generations if the tolerance allele is dominant.
Monogenic or polygenic Tolerance will increase more rapidly if controlled by one gene versus many genes.
Fitness differences Tolerance will increase more rapidly if differences in fitness among genotypes are large
(versus small).
Selection components Selection at different components of a life cycle can negate directional selection for one
tolerance trait by counterbalancing selection for another trait, or accelerate the rate of
selection for tolerance traits by reinforcing the advantage of a particular genotype.
Cotolerance Preadaptation to a toxicant can result in elevated tolerance in a population if adaptation
took place in the past for a related toxicant, e.g., a plant population adapted to one
herbicide is later exposed to a similar herbicide.
Reproductive qualities
Generation time Tolerance will increase more rapidly for species with short generation times versus long
generation species.
Intrinsic rate of increase Tolerance will increase more rapidly for populations with high intrinsic rates of increase
versus populations with low intrinsic rates of increase.
Size of population (N
e
) Genetic variation decreases with a decrease in N
e
. Consequently, large populations will
have more variation in tolerance and the possibility of tolerance increasing is higher for
large populations versus small populations.
Ecological qualities
Migration Influx of nontolerant genotypes due to immigration can slow the rate of tolerance
acquisition: increased levels of migration will slow tolerance acquisition.
Refugia The presence of refugia, i.e., uncontaminated habitat, allows intolerant individuals to
remain in the population and can slow the rate of tolerance acquisition.
Life stage sensitivity Selection effectiveness can be influenced by the most sensitive life stage.
risk of allele loss if the allele is initially rare in a population experiencing high levels of mortality
as can be the case in toxicant-exposed populations. If the tolerance gene is dominant, tolerance will
emerge rapidly relative to the case in which it is associated with a recessive gene. As an example,
Yarbrough and colleagues (Chambers and Yarbrough 1979, Wise et al. 1986, Yarbrough et al. 1986)
demonstrated enhanced pesticide tolerance of mosquitofish (G. affinis) in agricultural areas. Pesti-
cide resistance in mosquitofish was defined by one dominant gene. In another example, Martínez and
Levinton (1996) found rapid metal tolerance acquisition controlled by a single gene in an oligochaete
population.
Consistent with Fisher’s theorem of natural selection (see Section 18.2.1), the rate of change in
the average tolerance of the population increases as the genetic variability of the tolerance trait in
the initial population increases (e.g., Equations 18.5 and 18.6). The larger the difference in fitness
among the genotypes, the faster the increase in average population tolerance will occur. The industrial
melanism of the peppered moth (Box 12.1) is a clear example of rapid microevolution due to the
large fitness differences among color morphs and dominance of dark over light color morphs. As
described in Sections 18.1.2 and 18.1.3, selection can occur at different stages of an organism’s
life cycle. Selection at one component of an organism’s life cycle can counterbalance selection for
a tolerance trait associated with another component of the organism’s life cycle. Previous discussion
of longevity (i.e., antagonistic pleiotropy in Chapter 16) illustrates the importance of life cycle
stage on favoring or disfavoring a particular trait. On the other hand, if tolerance traits at different
© 2008 by Taylor & Francis Group, LLC
Clements: “3357_c018” — 2007/11/9 — 18:26 — page 347 — #17
Population Genetics: Natural Selection 347
selection components disfavor the same genotypes, tolerance acquisition can be accelerated due to
the reinforcing of the genotype disadvantage by several tolerance traits. Therefore, it is critical to
understand all selection components before making predictions about tolerance acquisition. Finally,
a previous adaptation to one toxicant can result in cross-resistance or co-tolerance. This co-tolerance
can result in very rapid accommodation to a novel toxicant. For example, plants tolerant to a particular
s-triazine herbicide produce a herbicide-binding protein that can impart an elevated level of tolerance
if these adapted plants are later exposed to a novel s-triazine herbicide (Erickson et al. 1985). Isopod
tolerance to copper imparts a cotolerance to lead (Brown 1978).
Factors other than genetics influence tolerance acquisition. Short generation time and rapid
population growth rates increase the rate of tolerance acquisition. Effective population size and
the associated changes in population genetic variability influence selection for tolerance. All else
being equal, larger populations generally possess more genetic variability than smaller ones and,
consequently, the chance of enhanced tolerance emerging and the rate of tolerance change will be
higher for larger than for smaller populations. Relative to metapopulation considerations, an increase
in migration into an exposed population will slow the rate at which the average population tolerance
increases (e.g., Newman and Jagoe 1998). The presence of refugia or source demes of nontolerant
genotypes will also slow the rate at which average tolerance level increases in the exposed population.
A rich literature describes toxicant-related tolerance in natural populations. Those focused on
plants are particularly thorough (e.g.,Antonovics et al. 1971, Baker and Walker 1989, Nacnair 1997,
Pitelka 1988, Wilson 1988). Good reviews exist for the topic relative to insect resistance to pesticides
(e.g., Mallet 1989) and animal tolerance to pollutants (e.g., Forbes and Calow 1997, Klerks 1990,
Klerks and Weis 1987, Mulvey and Diamond 1991).
18.4 SUMMARY
In this brief chapter, the characteristics and dynamics of microevolution were described relative to
natural selection and tolerance acquisition. The conditions giving rise to and the consequences of
natural selection were defined. The genetic dynamics of demes are explored using parts of Wright’s
shifting balance theory, especially the complementary exploration of the adaptive landscape afforded
by genetic drift and the shift onto adaptive peaks due to natural selection. Selection components were
described and the importance of exploring all relevant selection components emphasized. Metrics of
differential fitness and selection coefficients were explored as where those for narrow and broad sense
heritability. Finally, tolerance acquisition was described relative to fundamental factors influencing
rates of increase for average population tolerance.
18.4.1 SUMMARY OF FOUNDATION CONCEPTS AND PARADIGMS
• Genetic drift and natural selection are complementary processes giving rise to evolutionary
change.
• Natural selection is the change in relative genotype frequencies through generations due
to differential fitnesses of the associated phenotypes. Pertinent differences in phenotype
fitness can involve viability or reproductive aspects of an individual’s life.
• Four required conditions for natural selection are the following: (1) the existence of
variation among individuals relative to some trait, (2) fitness differences associated with
differences in that trait, (3) heritability of that trait, and (4) the Malthusian premise that
individuals in populations can produce excess offspring.
• There are two consequences of the four conditions for natural selection. The frequency
of a heritable trait will differ among age or life stage classes. In addition, the frequency
of the trait from adult to offspring (i.e., across generations) will differ due to trait-related
differences in fitness.
© 2008 by Taylor & Francis Group, LLC
Clements: “3357_c018” — 2007/11/9 — 18:26 — page 348 — #18
348 Ecotoxicology: A Comprehensive Treatment
• Fitness differences may be controlled by one locus with the appearance of distinct fitness
classes (Mendelian trait) or by several or many genes, resulting in a continuum of fitness
phenotypes in a population (quantitative trait).
• Natural selection can be directional, disruptive, or normalizing.
• Differences in fitness are specific to a particular environment and the relative fitness of
genotypes can change if the environment changes.
• Consistent, environment-specific differences in fitness are needed for natural selection to
occur.
• Lacking sufficient, appropriate genetic variability, a species population may fail to adapt
and will become locally extinct.
• Wright argued that, through genetic drift and natural selection on individuals, demes tend
to shift continually within an adaptive landscape to occupy local fitness peaks. These
peaks shift through time as the environment changes and natural selection working on
individuals move the deme toward a new optimal fitness peak.
• Selection can occur at several stages of an organism’s life cycle. Selection components
include viability selection, sexual (male and female) selection, meiotic drive, gametic
selection, and fecundity selection.
• Viability selection includes fitness differences in development of the zygote, growth after
birth, and survival.
• Four other selection components involve reproduction. Sexual selection involves differ-
ences in adult success in finding, attracting, or retaining a mate. Meiotic drive involves
the differential production of the possible gamete types by heterozygotes. The gametic
selection occurs if certain gametes produced by heterozygotes have a higher probability
of being involved in fertilization than others. Fecundity selection occurs if pairs of certain
genotypes have more young than others.
• Selection for several selection components often occurs, making it essential to understand
the net balance between fitnesses at these different components. Prediction from one com-
ponent (e.g., viability during acute toxicant exposure) can lead to inaccurate predictions
of selection consequences.
• Differences in fitness can be quantified as fitness (w), relative fitness, or selection
coefficients (s).
• Heritability can be quantified by assuming that phenotypic variation among individu-
als results from a combination of genetic variation (including additive-, epistatic- and
dominance-associated variance), environmental variation and, perhaps, the interaction
between genetic and environmental factors.
• Narrow sense heritability (h
2
) is the additive genetic variance divided by the total pheno-
typic variance and broad sense heritability (H
2
) includes the other variance components
as defined in Equation 18.9.
• The rate of tolerance acquisition in an exposed population is a function of genetic,
ecological, and reproductive factors as summarized in Table 18.4.
REFERENCES
Antonovics, J., Metal tolerance in plants, In Advances in Ecological Research, Vol. 7, Cragg, J.B. (ed.),
Academic Press, New York, 1971, pp. 1–85.
Ayala, F.J., Population and Evolutionary Genetics, Benjamin Cummings, Menlo Park, CA, 1982.
Baker, A.J.M. and Walker, P.L., Physiological responses of plants to heavy metals and the quantification of
tolerance and toxicity, Chem. Spec. Bioavail., 1, 7–18, 1989.
Battaglia, J.A., Bisol, P.M., Fossato, V.U., and Rodino, E., Studies of the genetic effect of pollution in the sea,
Rapp. P-v Reun., Cons. Int. Explor. Mer, 179, 267–274, 1980.
© 2008 by Taylor & Francis Group, LLC
Clements: “3357_c018” — 2007/11/9 — 18:26 — page 349 — #19
Population Genetics: Natural Selection 349
Beardmore, J.A., Genetical considerations in monitoring effects of pollution, Rapp. P-v Reun., Cons. Int.
Explor. Mer, 179, 258–266, 1980.
Beardmore, J.A., Barker, C.J., Battaglia, B., Payne, J.F., and Rosenfeld, A., The use of genetical approaches
to monitoring biological effects of pollution, Rapp. P-v Reun., Cons. Int. Explor. Mer, 179, 299–305,
1980.
Brown, B.E., Lead detoxification by a copper-tolerant isopod, Nature, 276, 388–390, 1978.
Bungaard, J. and Christiansen, F.B., Dynamics of polymorphism, I: Selection components in an experimental
population of Drosophila melanogaster, Genetics, 71, 439–460, 1972.
Carson, R., Silent Spring, Houghton Mifflin Co., New York, 1962.
Chagnon, N.L. and Guttman, S.I., Differential survivorship of allozyme genotypes in mosquitofish populations
exposed to copper or cadmium, Environ. Toxicol. Chem., 8, 319–326, 1989.
Chambers, J.E. and Yarbrough, J.D., A seasonal study of microsomal mixed-function oxidase components
in insecticide-resistant and susceptible mosquitofish, Gambusia affinis, Toxicol. Appl. Pharmacol.,
48, 497–507, 1979.
Christiansen, F.B. and Frydenberg, O., Selection component analysis of natural polymorphisms using
population samples including mother–offspring combinations, Theor. Popul. Biol., 4, 425–445,
1973.
Christiansen, F.B., Frydenberg, O., Gyldenholm, A.O., and Simonsen, V., Genetics of Zoarces populations, VI:
Further evidence based on age group samples, of a heterozygote deficit in the EST III polymorphism,
Hereditas, 77, 225–236, 1974.
Christiansen, F.B., Frydenberg, O., and Simonsen, V., Genetics of Zoarces populations: IV. Selection com-
ponent analysis of an esterase polymorphism using population samples including mother–offspring
combinations, Hereditas, 73, 291–304, 1973.
Clegg, M.T., Kahler,A.L., and Allard, R.W., Estimation of life cycle components of selection in an experimental
plant population, Genetics, 89, 765–792, 1978.
Coyne, J.A., Barton, N.H., and Turelli, M., Perspective: A critique of Sewall Wright’s shifting balance theory
of evolution, Evolution, 51, 643–671, 1997.
Coyne, J.A., Barton, N.H., and Turelli, M., Is Wright’s shifting balance process important in evolution?
Evolution, 54, 306–317, 2000.
Darwin, C., The Origin of Species, Penguin Putnam Inc., New York, 1872.
Diamond, S.A., Newman, M.C., Mulvey, M., Dixon, P.M., and Martinson, D., Allozyme genotype and time
to death of mosquitofish, Gambusia affinis (Baird and Girard), during acute exposure to inorganic
mercury, Environ. Toxicol. Chem., 8, 613–622, 1989.
Endler, J.A., Natural Selection in the Wild, Princeton University Press, Princeton, NJ, 1986.
Erickson, J.M., Rahire, M., and Rochaix, J D., Herbicide resistance and cross-resistance: Changes at three
distinct sites in the herbicide-binding protein, Science, 228, 204–207, 1985.
Fisher, R.A., The Genetical Theory of Natural Selection, Clarendon Press, Oxford, UK, 1930.
Forbes, V.E. and Calow, P., Responses of aquatic organisms to pollutant stress: Theoretical and practical
implications, In Environmental Stress, Adaptation and Evolution, Bijlsma, R. and Loeschcke, V. (eds.),
Birkhäuser Verlag, Basel, Switzerland, 1997, pp. 25–41.
Forbes, V.E. and Forbes, T.L., Ecotoxicology in Theory and Practice, Chapman & Hall, London, UK, 1994.
Gillespie, J.H., Population Genetics. A Concise Guide, The John Hopkins University Press, Baltimore, MD,
1998.
Gillespie, R.B. and Guttman, S.I., Effects of contaminants on the frequencies of allozymes in populations of
the central stoneroller, Environ. Toxicol. Chem., 8, 309–317, 1989.
Gillespie, R.B. and Gutmann, S.I., Chemical-induced changes in the genetic structure of populations: Effects
on allozymes. In Forbes, V.E. (ed.), Genetics and Ecotoxicology, Taylor & Francis, Philadelphia, PA,
1999.
Hartl, D.L. and Clark, A.G., Principles of Population Genetics, Sinauer Associates, Inc., Sunderland, MA, 1999,
pp. 55–77.
Heagler, M.G., Newman, M.C., Mulvey, M., and Dixon, P.M., Allozyme genotype in mosquitofish, Gambusia
holbrooki, during mercury exposure: Temporal stability, concentration effects and field verification,
Environ. Toxicol. Chem., 12, 385–395, 1993.
Hoffmann,A.A. and Parsons, P.A., Extreme Environmental Change and Evolution, Cambridge University Press,
Cambridge, UK, 1997.
© 2008 by Taylor & Francis Group, LLC
Clements: “3357_c018” — 2007/11/9 — 18:26 — page 350 — #20
350 Ecotoxicology: A Comprehensive Treatment
Ingvarsson, P.K., Differential migration from high fitness demes in the shining fungus beetle, Phalacrus
substriatus, Evolution, 54, 297–301, 2000.
Keklak, M.M., Newman, M.C., and Mulvey, M., Enhanced uranium tolerance of an exposed population of the
eastern mosquitofish (Gambusia holbrooki Girard 1859), Arch. Environ. Contam. Toxicol., 27, 20–24,
1994.
Klerks, P.L., Adaptation to metals in animals, In Heavy Metals Tolerance in Plants: Evolutionary Aspects,
Shaw, A.J. (ed.), CRC Press, Boca Raton, FL, 1990, pp. 311–321.
Klerks, P.L. and Levinton, J.S., Rapid evolution of metal resistance in a benthic oligochaete inhabiting
a metal-polluted site, Biol. Bull., 176, 135–141, 1989.
Klerks, P.L. and Weis, J.S., Genetic adaptation to heavy metals in aquatic organisms: A review, Environ. Pollut.,
45, 173–205, 1987.
Kramer, V.J. and Newman, M.C., Inhibition of glucosephosphate isomerase allozymes of the mosquitofish,
Gambusia holbrooki, by mercury, Environ. Toxicol. Chem., 13, 9–14, 1994.
Kramer, V.J., Newman, M.C., Mulvey, M., and Ultsch, G.R., Glycolysis and Krebs cycle metabolites in
mosquitofish, Gambusia holbrooki, Girard 1859, exposed to mercuric chloride: Allozyme genotype
effects, Environ. Toxicol. Chem., 11, 357–364, 1992a.
Kramer, V.J., Newman, M.C., and Ultsch, G.R., Changes in concentrations of glycolysis and Krebs cycle
metabolites in mosquitofish, Gambusia holbrooki, induced by mercuric chloride and starvation,
Environ. Biol. Fish, 34, 315–320, 1992b.
Lavie, B. and Nevo, E., Heavy metal selection of phosphoglucose isomerase allozymes in marine gastropods,
Mar. Biol., 71, 17–22, 1982.
Lavie, B. and Nevo, E., Genetic selection of homozygote allozyme genotypes in marine gastropods exposed to
cadmium pollution, Sci. Total Environ., 57, 91–98, 1986a.
Lavie, B. and Nevo, E., The interactive effects of cadmium and mercury pollution on allozyme polymorphisms
in the marine gastropod, Cerithium scabridum, Mar. Pollut. Bull., 17, 21–23, 1986b.
Lee, C.J., Newman, M.C., and Mulvey, M., Time to death of mosquitofish (Gambusia holbrooki) during
acute inorganic mercury exposure: Population structure effects, Arch. Environ. Contam. Toxicol.,
22, 284–287, 1992.
Macnair, M.R., The evolution of plants in metal-contaminated environments, In Environmental Stress, Adapta-
tion and Evolution, Bijlsma, R. and Loeschcke, V. (eds.), Birkhäuser Verlag, Basel, Switzerland, 1997,
pp. 3–24.
Mallet, J., The evolution of insecticide resistance: Have the insects won? TREE, 4, 336–340, 1989.
Martínez, D.E. and Levinton, J., Adaptation to heavy metals in the aquatic oligochaete Limnodrilus hoffmeisteri:
Evidence for control by one gene, Evolution, 50, 1339–1343, 1996.
McNeilly, T. and Bradshaw, A.D., Evolutionary processes in populations of copper-tolerant Argostis tenuis
Sibth, Evolution, 22, 108–118, 1968.
Moraga, D. and Tanguy, A., Genetic indicators of herbicide stress in the Pacific oyster Crassostrea gigas under
experimental conditions, Environ. Toxicol. Chem., 19, 706–711, 2000.
Mulvey, M. and Diamond, S.A., Genetic factors and tolerance acquisition in populations exposed to
metals and metalloids, In Metal Ecotoxicology. Concepts & Applications, Newman, M.C. and
McIntosh, A.W. (eds.), Lewis Publishers, Chelsea, MI, 1991, pp. 301–321.
Mulvey, M., Newman, M.C., Chazal, A., Keklak, M.M., Heagler, M.G., and Hales, L.S., Jr., Genetic and
demographic responses of mosquitofish (Gambusia holbrooki Girard 1859) populations stressed by
mercury, Environ. Toxicol. Chem., 14, 1411–1418, 1995.
Nadeau, J.H. and Baccus, R., Selection components of four allozymes in natural populations of Peromyscus
maniculatus, Evolution, 35, 11–20, 1981.
Nadeau, J.H., Dietz, K., andTamarin, R.H., Gametic selectionand the selectioncomponent analysis, Genet. Res.,
37, 275–284, 1981.
Nevo, E., Perl, T., Beiles, A., and Wool, D., Mercury selection of allozyme genotypes in shrimps, Experientia,
37, 1152–1154, 1981.
Newman, M.C., Quantitative Methods in Aquatic Ecotoxicology, CRC Press/Lewis Publishers, Boca Raton,
FL, 1995.
Newman, M.C., Fundamentals of Ecotoxicology, CRC Press/Lewis Publishers, Boca Raton, FL,
1998.
© 2008 by Taylor & Francis Group, LLC
Clements: “3357_c018” — 2007/11/9 — 18:26 — page 351 — #21
Population Genetics: Natural Selection 351
Newman, M.C., Diamond, S.A., Mulvey, M., and Dixon, P., Allozyme genotype and time to death of mos-
quitofish, Gambusia affinis (Baird and Girard) during acute toxicant exposure: Acomparison of arsenate
and inorganic mercury, Aquatic Toxicol., 15, 141–156, 1989.
Newman, M.C. and Dixon, P.M., Ecologically meaningful estimates of lethal effect in individuals, In Ecotoxic-
ology. A Hierarchical Treatment, Newman, M.C. and Jagoe, C.H. (eds.), CRC Press/Lewis Publishers,
Boca Raton, FL, 1996, pp. 225–253.
Newman, M.C. and Jagoe, R.H., Allozymes reflect the population-level effect of mercury: Simulations of
mosquitofish (Gambusia holbrooki Girard) GPI-2 response, Ecotoxicology, 7, 141–150, 1998.
Partridge, G.G., Relative fitness of genotypes in a population of Rattus norvegicus polymorphic for Warfarin
resistance, Heredity, 43, 239–246, 1979.
Pemberton, J.M., Albon, S.D., Guinness, F.E., Clutton-Brock, T.H., and Berry, R.J., Genetic variation and
juvenile survival in red deer, Evolution, 42, 921–934, 1988.
Pitelka, L.F., Evolutionary responses of plants to anthropogenic pollutants, TREE, 3, 233–236, 1988.
Posthuma, L., Hogervorst, R.F., Joose, N.G., and van Straalen, N.M., Genetic variation and covariation for
characteristics associated with cadmium tolerance in natural populations of the springtail Orchesella
cincta (L.), Evolution, 47, 619–631, 1993.
Schlueter, M.A., Guttman, S.I., Duan, Y., Oris, J.T., Huang, X., and Burton, G.A., Effects of acute exposure
to fluoranthene-contaminated sediment on the survival and genetic variability of fathead minnows
(Pimephales promelas), Environ. Toxicol. Chem., 19, 1011–1018, 2000.
Schlueter, M.A., Guttman, S.I., Oris, J.T., and Bailer,A.J., Survival of copper-exposed juvenile fatheadminnows
(Pimephales promelas) differs among allozyme genotypes, Environ. Toxicol. Chem., 14, 1727–1734,
1995.
Siegismund, H.R. and Christiansen, F.B., Selection component analysis of natural polymorphisms using pop-
ulation samples including mother–offspring combinations, III, Theor. Popul. Biol., 27, 268–297,
1985.
Spiess, E.B., Genes in Populations, John Wiley & Sons, New York, 1997.
Walker, C.H., Hopkin, S.P., Sibly, R.M., and Peakall, D.B., Principles of Ecotoxicology, Taylor & Francis,
London, UK, 1996.
Watt, W.B., Carter, P.A., and Blower, S.M., Adaptation at specific loci. IV. Differential mating success among
glycolytic allozyme genotypes of Colias butterflies, Genetics, 109, 157–175, 1985.
Webb, R.E. and Horsfall, F., Jr., Endrin resistance in the pine mouse, Science, 156, 1762, 1967.
Weis, J.S. and Weis, P., Tolerance and stress in a polluted environment: The case of the mummichog, BioScience,
39, 89–95, 1989.
Whitten, M.J., Dearn, J.M., and McKenzie, J.A., Field studies on insecticide resistance in the Australian sheep
blowfly, Lucilia cuprina, Aust. J. Biol. Sci., 33, 725–735, 1980.
Williams, C.J., Anderson, W.W., and Arnold, J., Generalized linear modeling methods for selection component
experiments, Theor. Popul. Biol., 37, 389–423, 1990.
Wilson, J.B., The cost of heavy-metal tolerance: An example, Evolution, 42, 408–413, 1988.
Wise, D., Yarbrough, J.D., and Roush, T.R., Chromosomal analysis of insecticide resistant and susceptible
mosquitofish, J. Hered., 77, 345–348, 1986.
Wright, S., The roles of mutation, inbreeding, crossbreeding and selection in evolution, Proc. 6th Int.
Cong. Genet., 1, 356–366, 1932.
Wright, S., The shifting balance theory and macroevolution, Ann. Rev. Genet., 16, 1–19, 1982.
Yarbrough, J.D., Roush, R.T., Bonner, J.C., and Wise, D.A., Monogenic inheritance of cyclodiene resistance in
mosquitofish, Gambusia affinis, Experientia, 42, 851–853, 1986.
© 2008 by Taylor & Francis Group, LLC