ECOTOXICOLOGY: A Comprehensive Treatment - Chapter 34 pdf
Bạn đang xem bản rút gọn của tài liệu. Xem và tải ngay bản đầy đủ của tài liệu tại đây (439.03 KB, 33 trang )
Clements: “3357_c034” — 2007/11/9 — 12:39 — page 737 — #1
34
Fate and Transport of
Contaminants in
Ecosystems
34.1 INTRODUCTION
Food web investigations have a relatively long history in ecotoxicological research. Rachel Carson’s
Silent Spring (1962) placed bald eagles and other birds of prey at the top of Elton’s trophic pyramid
and introduced the lay public to the important, but often misunderstood, concept of biomagnifica-
tion. Since the publication of Carson’s influential book, literally hundreds of studies have reported
concentrations of contaminants across trophic levels and attempted to relate trophic position to bio-
magnification. The goal of this chapter is not to provide a comprehensive review of these studies,
which have been adequately described in several recent publications (Barber 2003, Borgå et al.
2004, Fisher and Wang 1998, Iannuzzi et al. 1996, Zaranko et al. 1997). Instead, the primary goal of
this section is to characterize the ecological factors that influence transport of contaminants through
ecosystems. Because of the difficulty developing reliable food web models, researchers are keenly
aware that predicting food chain transport requires more than an understanding of the physicochem-
ical properties of contaminants. Quantification of feeding habits of organisms, especially those with
mixed diets or that show ontogenetic changes, is often challenging. The structure of food webs and
the dynamics of energy and contaminant flow also vary greatly among locations. Consequently,
predictive models have become increasingly sophisticated as investigators attempt to quantify the
influence of ecological factors, such as feeding habits, food chain length, and habitat characterist-
ics, on contaminant transport and biomagnification. The inclusion of these ecological factors into
transport models represents a major improvement in our understanding of how contaminants are
distributed in ecosystems. However, knowing the concentration of contaminants in a particular spe-
cies or trophic level tells very little about the consequences of exposure. The next logical step in the
refinement of food web models is to relate predicted tissue concentrations to ecologically significant
effects (Cain et al. 2004, Toll et al. 2005).
34.2 BIOCONCENTRATION, BIOACCUMULATION,
BIOMAGNIFICATION, AND FOOD CHAIN
TRANSFER
The traditional application of food web ecology to ecotoxicological research has been to quantify
uptake and transport of contaminants between biotic and abiotic compartments. Inconsistent usage
of terms such as bioconcentration, bioaccumulation, and biomagnification has caused some con-
fusion in the literature, especially in aquatic communities (Dallinger et al. 1987). Here, we define
bioconcentration as the uptake of contaminants directly from water. Thus, bioconcentration factors
(BCFs) are calculated as the ratio of chemical concentration in the organism to the concentration
in water. Bioaccumulation is defined as the uptake of chemicals from either biotic (food) or abi-
otic (sediment) compartments, and bioaccumulation factors (BAFs) are calculated as the ratio of
the concentration in organisms to the concentration in these compartments. Biomagnification refers
specifically to the increase in contaminant concentration with trophic level (often after adjusting
for lipid content of the organism). If biomagnification occurs, we would expect that lipid-based
737
© 2008 by Taylor & Francis Group, LLC
Clements: “3357_c034” — 2007/11/9 — 12:39 — page 738 — #2
738 Ecotoxicology: A Comprehensive Treatment
concentrations of lipophilic contaminants should increase with trophic level. Although the highest
levels of contaminants such as polychlorinated biphenyls (PCBs) and other lipophilic chemicals
are frequently measured in top predators, biomagnification is a complex phenomenon influenced
by many physicochemical, physiological, and ecological factors (Moriarty et al. 1984, Mori-
arty and Walker 1987). In addition to feeding habits, factors such as metabolism, growth rates,
and habitat preferences of predators and prey may regulate contaminant transfer to higher trophic
levels.
Bioaccumulation and bioconcentration of chemical substances are widely recognized as useful
indicators of biological effects. BCFs and BAFs have been employed to predict hazard of hydrophobic
organic chemicals to aquatic organisms. Persistent organic compounds with relatively large BCF or
BAF values are generally considered to be of greater environmental concern than less recalcitrant
materials. The application of these concepts to predict effects of other compounds, especially metals
and other inorganic substances, is problematic. Physicochemical differences between hydrophobic
organic chemicals and heavy metals limit the applicability of the BCF/BAF approach for heavy
metals. Furthermore, manyaquatic organismsare capable of regulatinginternalmetal concentrations,
especially essential metals such as Cu and Zn, through a variety of physiological processes. McGeer
et al. (2003) observed extreme variability in BCF/BAF values for several metals and an inverse
relationship between BCF/BAF and exposure concentrations. Assuming that high values should
be indicative of greater hazard, the observed inverse relationship between BCF/BAF values and
exposure concentration is inconsistent with known toxicological data. These results indicate that
application of BCF and BAF values to assess hazard is inappropriate for metals (McGeer et al. 2003)
and possibly other classes of contaminants.
Criticism of the use of BCFs and BAFs in hazard assessment highlights a more fundamental issue
concerning the significance of contaminant bioaccumulation. Although observing elevated levels of
a contaminant in organisms is a reasonable indicator of exposure, few studies have attempted to
quantify the ecological effects of bioaccumulation. This is a particularly important issue for heavy
metals and other classes of contaminants that are regulated. What is often lacking is a fundamental
understanding of the mechanisms associated with bioaccumulation and a direct link to biological
effects. Studies conducted by Cain et al. (2004) and Buchwalter and Luoma (2005) have provided
important insight into the mechanisms of metal bioaccumulation in invertebrates and attempted to
explain differential sensitivity among species based on these mechanisms. These researchers related
interspecific variation in morphological characteristics of aquatic insects to heavy metal uptake and
sensitivity. Cain et al. (2004) quantified interspecific variation in subcellular distributions of heavy
metals between metal-sensitive and detoxified compartments in aquatic insects. These differences
were then related to observed distributions of sensitive and tolerant invertebrate species in the
field. Longitudinal distributions of most species were explained by partitioning of metals between
metal-sensitive and detoxified fractions. These two studies represent important steps in improving
our understanding of the relationship between metal bioaccumulation and ecological effects. They
also demonstrate that important insights can be achieved by linking mechanistic-based studies of
physiology and toxicology to ecological investigations conducted at higher levels of biological
organization.
34.2.1 LIPIDS INFLUENCE THE PATTERNS OF CONTAMINANT
DISTRIBUTION AMONG TROPHIC LEVELS
The positive relationship between the concentration of lipophilic chemicals and trophic level is
a consistent pattern reported in the literature. However, the precise mechanistic explanation for this
phenomenon is not well understood. The high concentration of contaminants often observed in upper
trophic levels may simply be explained by the greater levels of lipids in these organisms. Kiriluk
et al. (1995) reported a significant positive relationship between lipid content and trophic position
in a pelagic food web. Similar results were reported by Rasmussen et al. (1990) for lake trout.
© 2008 by Taylor & Francis Group, LLC
Clements: “3357_c034” — 2007/11/9 — 12:39 — page 739 — #3
Fate and Transport of Contaminants in Ecosystems 739
The observation that organisms representing higher trophic levels often have greater levels of lipids
complicates assessments of biomagnification and requires that lipid content be considered. If lipids
increase with trophic level, the greater concentration of hydrophobic contaminants observed in top
predators reported by many studies may simply be a result of equilibrium partitioning. One altern-
ative is to measure lipid content in different compartments and then simply express all contaminant
concentrations on a lipid basis. Using this approach, our definition of biomagnification is restricted
only to those instances where lipid-based concentrations increase with trophic level. However, if
the concentration of a chemical does not vary in direct proportion with lipids, this approach can
provide biased results (Hebert and Keenleyside 1995). Various statistical approaches, such as ana-
lysis of covariance (ANCOVA), have been employed to estimate the influence of lipid content and
food chain length on organochlorine concentrations in fish (Bentzen et al. 1996). Kidd et al. (1998)
observed a strong positive relationship between food chain length and organochlorine concentra-
tion after accounting for lipid content in fish from subarctic lakes. The strength of the relationship
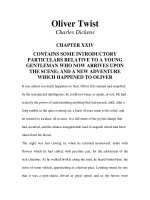
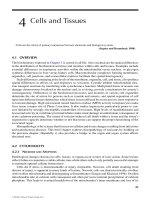
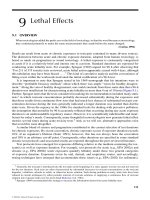
between contaminant concentration and trophic position willalso be influenced by lipophilicityof the
chemicals (Figure 34.1). In general, more lipophilic chemicals show stronger relationships between
concentration and trophic level (Kiriluk et al. 1995).
Physicochemical characteristics, such as that reflected by the octanol–water partition coefficient
(K
ow
), greatly influence uptake and transport of contaminants through food webs. There is consid-
erable evidence that the molecular configuration of PCBs, particularly the number and arrangement
of chlorine molecules, significantly influences uptake (Oliver and Niemi 1988). Trowbridge and
Swackhamer (2002) observed preferential biomagnification of dioxin-like PCB congeners in a Lake
Michigan food web. Because of preferential uptake, the ratio of these highly toxic PCBs to total
PCBs increased with trophic level. Because of this relationship, ecological risk assessments based
on food web models using total PCBs may underestimate potential effects on higher trophic levels.
Russell et al. (1999) examined the roles of chemical partitioning and ecological factors in determ-
ining transfer of organic contaminants in the Detroit River. Biomagnification of high-K
ow
organic
chemicals (log
10
K
ow
> 6.3) was observed in this food web, but simple equilibrium partitioning
between lipids and water explained patterns for low-K
ow
chemicals (log
10
K
ow
< 5.5). Principal
component analysis (PCA) based on chemical concentrations in organisms showed greater similarity
to the observed diets of these organisms than assigned trophic positions. Similar results were repor-
ted by Kucklick et al. (1996) for a pelagic food web in Lake Baikal. BAFs, defined as the ratio of
lipid-corrected PCB concentrations in predators to those in prey, increased with log
10
K
ow
for both
predatory zooplankton and fish.
High lipophilic compound
Less lipophilic compound
46810
15
N ( )
12 14 16
0.1
0.2
0.5
1
2
5
10
20
50
Concentration (ng/g wet wt.)
FIGURE 34.1 Hypothetical relationship between trophic position (as indicated by stable isotope δ
15
N value)
and organochlorine concentration in fish for highly lipophilic and less lipophilic compounds. It is expected that
highly lipophilic compounds will have a greater potential for biomagnification than less lipophilic chemicals.
© 2008 by Taylor & Francis Group, LLC
Clements: “3357_c034” — 2007/11/9 — 12:39 — page 740 — #4
740 Ecotoxicology: A Comprehensive Treatment
34.2.2 RELATIVE IMPORTANCE OF DIET AND WATER IN
AQUATIC ECOSYSTEMS
Much of the debate regarding the significance of food chain transfer of contaminants in aquatic
systems focuses on the relative importance of food and water pathways. For many lipophilic organic
contaminants, especially PCBs and other organochlorines, accumulation from food is generally con-
sidered the primary route of exposure.Although sophisticated models have been developed to predict
bioconcentration from water, models that ignore aqueous exposure can provide reasonably accur-
ate estimates of contaminant levels in fish (Jackson and Schindler 1996). In contrast, attempts to
predict chemical concentrations in predators based only on physiological features of organisms and
physicochemical characteristics of contaminants are fraught with uncertainty (Owens et al. 1994,
Russell et al. 1999). Failure to account for food chain transport will significantly underestimate
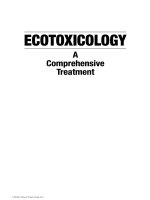
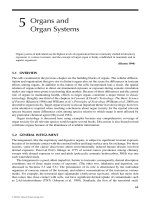
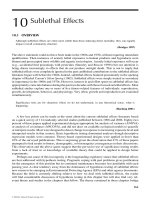
concentrations of organochlorines and other lipophilic chemicals (Zaranko et al. 1997). Indeed, con-
temporary models describing fate and transport of highly lipophilic contaminants generally include
a food chain component and account for input from sediment (Figure 34.2). Comparative studies
of different food webs have been conducted to quantify the relative importance of trophic trans-
fer and passive uptake. Wallberg et al. (2001) compared uptake and food chain transfer of a PCB
(2,2
,4,4
,6,6
-hexachlorobiphenyl) in an autotrophic food web consisting of algae and bacteria and
a heterotrophic food web consisting of bacteria, flagellates, and ciliates. Results showed that trophic
transfer was the dominant pathway in the heterotrophic food web, resulting in significantly elev-
ated concentrations in higher trophic levels. Russell et al. (1999) employed multivariate analyses
to investigate the relationship between trophic level and organochlorine concentrations in a Detroit
River food chain. Lipid-based concentrations of organochlorines increased with trophic level, sup-
porting the hypothesis that these chemicals biomagnified through the food chain. In addition to an
increase in concentration with trophic level, PCA showed that the specific constituents of organo-
chlorines varied among trophic groups. Morrison et al. (1997) developed and field validated a model
to predict transfer of PCBs in a pelagic food chain. Results showed that 95% of the observed con-
centrations in invertebrates and fish were within a factor of two times the predicted concentrations.
The close agreement between measured and predicted concentrations suggests that the model ulti-
mately may be useful for assessing effects of PCBs on aquatic organisms. Mathematical models
Benthic invertebrates
Particulates and
suspended sediment
Water
column
Mountain
whitefish
Longnose
sucker
Pulp
effluents
Sediments
FIGURE 34.2 Food chain model showing transport of contaminants in an aquatic ecosystem. The size of the
arrows indicates the relative importance of each pathway. (Modified from Figure 6 in Owens et al. (1994).)
© 2008 by Taylor & Francis Group, LLC
Clements: “3357_c034” — 2007/11/9 — 12:39 — page 741 — #5
Fate and Transport of Contaminants in Ecosystems 741
developed by Thomann (1981) that quantify the relative importance of exposure from diet and water
are discussed in Section 34.3.2.
Unlike the situation for PCBs and many other lipophilic organic contaminants, therelativeimport-
ance of aqueous and dietary exposure to heavy metals is uncertain. Most of the evidence derived
from laboratory studies indicates that uptake from water is a more important route of exposure than
food, particularly for fish.
1
However, some investigators have suggested that dietary uptake may also
contribute significantly to total body burdens of heavy metals (see review by Dallinger et al. 1987).
For example, Hatakeyama and Yasuno (1987) reported that 90% of cadmium (Cd) accumulation
in the guppy, Poecilia reticulata, was derived from feeding on contaminated chironomids. Simil-
arly, Dallinger and Kautzky (1985) demonstrated that rainbow trout accumulated metals primarily
through the diet, particularly when levels in the water were low. Munger and Hare (1997) meas-
ured the relative importance of diet and water as sources of Cd uptake for the predatory insect
Chaoborus in a laboratory food chain. They reported no significant difference in organisms exposed
to Cd in food alone versus Cd in food and water, indicating that uptake from water was relatively
unimportant.
Although food chain transfer of most metals is probably a less serious issue than for lipophilic
organiccontaminants, dietaryexposureshouldnot be ignored when assessing ecologicalriskofheavy
metals (Hansen et al. 2004). Dietary exposure to heavy metals is especially contentious because
water quality criteria are based exclusively on aqueous exposure and assume no effects from dietary
uptake. Because concentrations of metals in certain biotic and abiotic compartments may be very
high, relatively inefficient transfer of metals through food chains can result in harmful levels. For
example, periphyton and attached algae in streams concentrate metals and other contaminants several
orders of magnitude above aqueous levels. Organisms grazing these materials, such as mayflies and
other benthic macroinvertebrates, are exposed to significantly elevated concentrations. Irving et al.
(2003) compared effects of aqueous and dietary cadmium on grazing mayflies. Organisms were very
tolerant of aqueous exposure (96-h median lethal concentration = 1611 µg/L), whereas exposure to
Cd through the diet significantly inhibited feeding and reduced mayfly growth. Several researchers
have reported that despite low transfer efficiencies for some metals, dietary exposure may have
negative effects on upper trophic levels (Farag et al. 1998, Woodward et al. 1994, Woodward et al.
1995). This point was demonstrated convincingly in a series of laboratory experiments in which
rainbow trout were fed benthicinvertebrates collected from a metal-contaminated stream (Woodward
et al. 1994). Fish consuming metal-contaminated prey showed reduced growth and greater mortality
as compared to fish feeding on organisms collected from an unpolluted stream.
At least part of the controversy surrounding the relative importance of aqueous versus dietary
exposure to metals involves differences in experimental designs used to expose organisms. Some
studies using artificial diets have reported relatively minor effects (Mount et al. 1994), whereas those
using field-collected organisms have observed increased mortality and reduced growth (Woodward
et al. 1994). Although natural diets collected from reference and contaminated sites are more eco-
logically realistic, differences in prey composition between locations confound interpretation of
growth effects because of potential differences in nutritional quality. An alternative experimental
design that addresses this problem is to expose prey species to contaminated media (e.g., periphyton
or sediments) collected from field sites and then feed these prey to fish predators. Hansen et al. (2004)
used this experimental design to assess the effects of dietary exposure to metals on the growth of
rainbow trout. Fish were fed freshwater oligochaetes that had been exposed to reference and metal-
contaminated sediments collected from the Clark Fork River (Montana, USA), a stream receiving
metals from historic mining and mineral processing facilities. Significant reductions in growth of fish
feeding on metal-contaminated prey were attributed to elevated levels of arsenic in tissues. This is
one of the first studies to demonstrate a relationship between contaminated sediments and effects on
1
The notable exception is mercury that, as methylmercury, has a dominant food-linked transfer among species.
© 2008 by Taylor & Francis Group, LLC
Clements: “3357_c034” — 2007/11/9 — 12:39 — page 742 — #6
742 Ecotoxicology: A Comprehensive Treatment
fish through dietary exposure of metals. It is important to note that, from a management perspective,
concerns over differences in prey nutritional quality between reference and metal-contaminated sites
may be relatively unimportant. While differences in community composition of prey may confound
our understanding of mechanisms of toxicity of dietary exposure, effects on fish are ultimately a res-
ult of heavy metals, either through direct dietary exposure or because of metal-induced alterations
in prey nutritional quality.
34.2.3 ENERGY FLOW AND CONTAMINANT TRANSPORT
Quantitative approaches developed to measure energy flow in ecosystems can also be employed
to estimate the movement of contaminants across trophic levels and between biotic and abiotic
compartments. Odum’s (1968) box and arrow diagrams showing energy and material flow among
trophic levels are the predecessors of contemporary contaminant transport models. Although ecotox-
icologists have done a reasonable job quantifying contaminant concentrations in biotic and abiotic
compartments, validation of transport models requires accurate estimates of transfer rates between
trophic levels. Because these estimates are typically obtained from laboratory studies, there is some
uncertainty concerning their relevance to conditions in the field. Jackson and Schindler (1996)
used a long-term monitoring program to estimate transfer efficiencies of PCBs from prey fishes
to salmonids in Lake Michigan. Despite significant temporal changes in concentrations of PCBs
in prey, transfer efficiencies remained relatively constant over the 15-year study. These findings
demonstrate that temporal changes in PCB levels in top predators are determined primarily by con-
centrations in prey species. Thus, the steady decline in PCB levels in Lake Michigan salmonids over
the past 20 years (Stow et al. 1995) is likely a direct result of both reduced inputs and lower PCB
concentrations in prey species.
Alterations in food web structure resulting from anthropogenic perturbations have important
implications for energy flow and trophic dynamics in aquatic ecosystems. Some of the most compre-
hensive examples demonstrating the cascading influences of contaminants on predator populations
and energy flow are from estuaries subjected to hypoxia (Buzzelli et al. 2002, Peterson et al. 2000).
Loss of oysters and other benthic suspension feeders reduces the capacity of estuarine ecosystems
to regulate phytoplankton, making these systems more susceptible to nutrient enrichment. Baird
et al. (2004) used network analysis to quantify the movement of energy through the Neuse River
Estuary (North Carolina, USA), a eutrophic system receiving high levels of N from agricultural,
industrial, and urban sources. By taking advantage of annual variation in the level of hypoxia over
two consecutive summers (1997 and 1998), researchers demonstrated that impairments in water
quality cascaded through several trophic levels and diverted energy from consumers to microbial
pathways. These researchers also speculated that reduced transfer of energy to higher trophic levels
increased the susceptibility of the Neuse River estuary to other stressors.
34.3 MODELING CONTAMINANT MOVEMENT IN
FOOD WEBS
In the pastseveraldecades, there has been significant progressin the development offood web models
to predict contaminant concentrations in aquatic organisms and transport among compartments. The
goal of these models is often to estimate concentrations in organisms at different trophic levels based
on measured concentrations in abiotic compartments such as water or sediments. Alternatively,
researchers often use food web models to predict events outside the range of existing empirical data.
The relatively simple equilibrium partitioning models based on physicochemical characteristics of
organic contaminants (e.g., K
ow
) have been replaced by more sophisticated compartmental, kinetic,
bioenergetic, and physiological models (Landrum et al. 1992). Much of this research has focused on
improving our understanding of factors that contribute to variation among species. In their simplest
© 2008 by Taylor & Francis Group, LLC
Clements: “3357_c034” — 2007/11/9 — 12:39 — page 743 — #7
Fate and Transport of Contaminants in Ecosystems 743
forms, these steady-state models predict that the concentration of contaminants in organisms is
a function of uptake from water and food minus loss due to depuration, growth dilution, metabolism,
and excretion. Recognition of the importance of dietary contributions to total body burdens and the
incorporation of biological factors such as lipid content, reproduction, body size, age, sex, life cycle,
habitat use, feeding ecology, and trophic position into these models represent major improvements
in their predictive capability. However, as with the development of any mathematical model, these
improvements have a cost. Incorporatingtheseadditionalparametersincreasesthecomplexityoffood
web models, thereby reducing their generality and increasing uncertainty of predictions (Borgå et al.
2004). Researchers also recognize that because of the large number of species and potential feeding
interactions in most ecosystems, predicting contaminant concentrations in all species is not practical.
Consequently, it is often necessary toselect representative taxafrom different functional groups when
constructing contaminant transport models (Arnot and Gobas 2004). Finally, comparison of model
results with empirical data is a critical step in this process and is required to give food web models
the necessary environmental realism.
34.3.1 KINETIC FOOD WEB MODELS
Food web models developed by Thomann et al. (1992) and Gobas et al. (1993) have been widely
employed to predict the bioaccumulation and transport of hydrophobic organic compounds (HOCs)
in aquatic ecosystems. The models are similar in the use of lipid-normalized contaminant levels
in organisms and expressing sediment contaminant concentrations based on organic carbon levels.
There are important differences between the models in the treatment of contaminant dynamics in
the benthic and planktonic compartments that may result in different estimates of bioaccumulation.
Using empirical data collected from Lake Ontario, Burkhard (1998) compared the ability of both
models to predict BAFs of HOCs inphytoplankton, zooplankton, macroinvertebrates, and fish. BAFs
were generally similar for most groups; however, BAFs for compounds with log
10
K
ow
values >8.0
divergedsignificantly.AlthoughtheThomannmodelhad greater predictive abilityfor phytoplankton,
zooplankton, and benthic invertebrates, predicted BAFs had lower uncertainty in the Gobas model
(Burkhard 1998).
Although kinetic food web models have been validated using data from several freshwater eco-
systems, especially Lake Ontario, these approaches have received considerably less attention in other
ecosystems. Borgå et al. (2004) conducted an extensive review of biological factors that determined
uptake and food chain transfer of HOCs in Arctic marine food webs. They note that Arctic eco-
systems offer unique advantages for the study of trophic transfer of contaminants because of their
remote location and distance from point sources, relatively simple but long food chains, and high
dependence on lipid levels in most organisms. The relative importance of various biological factors
varied among HOCs and among different species, but diet and trophic levels were the most important
biological factors for seabirds and marine mammals.
Parameters included in most food web models are based on point estimates of organism body
weight, lipid content, ingestion rate, metabolism, growth, and other physiological characteristics that
determine bioaccumulation. However, it is generally recognized that there is considerable variability
in estimates of these exposure factors, even at specific locations. Iannuzzi et al. (1996) conducted
a comprehensive literature review to develop probabilistic distributions for factors that determine
contaminant exposure anduptake. Mechanistic food web modelsdeveloped by Thomann et al. (1992)
and Gobas et al. (1993) were applied to a relatively simple estuarine food web that included poly-
chaetes, benthic forage fish, blue crabs, and stripped bass. Exposure factors were represented by one
of four distributional forms (uniform, triangular, beta, or truncated normal) to derive a probabilistic
food web model. Estimated concentrations of five PCB congers were within an order of magnitude
of measured concentrations, suggesting this probabilistic approach is appropriate for screening level
risk assessment (Iannuzzi et al. 1996).
© 2008 by Taylor & Francis Group, LLC
Clements: “3357_c034” — 2007/11/9 — 12:39 — page 744 — #8
744 Ecotoxicology: A Comprehensive Treatment
Compounds that may be rapidly metabolized by aquatic organisms, such as polycyclic aro-
matic hydrocarbons (PAHs), pose significant challenges to the development of food web models.
Iannuzzi et al. (1996) argue that because metabolites are generally more toxic than parent compounds
and because metabolites are often detected in specific target organs, food web models developed
for these and other compounds are not very effective. Nonetheless, PAHs are widely distributed in
aquatic ecosystems and pose significant risks to many aquatic organisms, especially higher trophic
levels. Thus, some understanding of the potential transfer of these contaminants among trophic
levels is critical for developing ecological risk assessments. Using a similar framework employed
for PCBs, Thomann and Komlos (1999) developed a steady-state food web model for PAHs and
applied this model using data from a small creek in Alabama (USA). Biota-sediment accumulation
factors (BSAF), defined as the ratio of the lipid-normalized concentration of PAHs in the organism
to the organic-carbon normalized concentration in the sediment, were calculated for PAHs over
a range of K
ow
values. Measured concentrations of PAHs in crayfish and fish were considerably less
than in sediments, indicating significant loss due to metabolism of the parent compounds. Model
components to account for this loss of PAHs included organism weight, lipid content, growth rate,
respiration rate, food assimilation efficiency, and food ingestion rate.
Sensitivity analysis of the model showed that metabolism in fish had a large effect on bioac-
cumulation of PAHs with log
10
K
ow
> 4.5. In contrast, relatively low metabolism of the crayfish
resulted in much higher BSAF values. The analysis also showed that relative contributions of food
and water varied with K
ow
values for the unsubstituted PAHs. Water was the predominant route of
exposure for PAHs with log
10
K
ow
values between 4 and 6, and food was the predominant route at
lower and higher values.
Arnot and Gobas (2004) described an innovative bioaccumulation model that represented sig-
nificant improvement in the original kinetic model developed by Gobas et al. (1993). These new
elements included: (1) a new model to predict contaminant partitioning; (2) a new model to predict
contaminant levels in algae and phytoplankton; (3) improved estimates of gill ventilation rates based
on allometric relationships; and (4) a mechanistic model to predict gastrointestinal magnification.
Improvements in the model were evaluated using empirical data collected for 64 chemicals in 35 spe-
cies from three different ecosystems. The modifications in the original model significantly reduced
model bias and improved predictions for each ecosystem. Arnot and Gobas (2004) note that further
improvements in the model will be challenging because of the large amount of variation among
individuals within a population.
34.3.2 MODELS FOR DISCRETE TROPHIC LEVELS
Trophic exchange of contaminants can be defined with a simple model that includes contaminant
concentration, biomass in the trophic level of interest, biomass consumed from the lower trophic
level, contaminant bioavailability, and the fraction of contaminant excreted daily (Ramade 1987) by
organisms in the trophic level of interest. To begin developing such a model, the BAF is defined as
the ratio of the contaminant concentration (C) at trophic level n +1 and the concentration in the next
lowest trophic level, n:
BAF = BAF
n,n+1
=
C
n+1
C
n
. (34.1)
Rearranging this equation, the concentrations in the two trophic levels can be defined,
C
n+1
= BAF
(n,n+1)
C
n
. (34.2)
The BAF for transfer n → n + 1 can be described in more detail by inclusion of the weight
of organisms in Level n + 1(b
n
), the weight of level n organisms consumed (a
n
), the fraction of
© 2008 by Taylor & Francis Group, LLC
Clements: “3357_c034” — 2007/11/9 — 12:39 — page 745 — #9
Fate and Transport of Contaminants in Ecosystems 745
contaminant absorbed from ingested food ( f
n
), and the fraction of accumulated contaminant that is
excreted daily (k
n
):
BAF
n,n+1
=
a
n
f
n
b
n
k
n
. (34.3)
Substituting this more detailed version of BAF
n,n+1
into the relationship between C
n
and C
n+1
given above, the following model is generated:
C
n+1
=
a
n
f
n
b
n
k
n
C
n
. (34.4)
This model can be easily expanded to predict the concentration at Level C
n+2
by adding the
explicit form of BAF
n+1,n+2
into this model.
C
n+2
=
a
n+1
f
n+1
b
n+1
k
n+1
a
n
f
n
b
n
k
n
C
n
. (34.5)
Generalizing this approach, one could theoretically predict the concentration in any trophic
level (r) knowing the contaminant concentration at the lowest level (C
0
) and the variables a
i
, f
i
, b
i
,
and k
i
for each trophic level:
C
r
=
r
i=1
a
i
f
i
b
i
k
i
C
0
. (34.6)
Close inspection of this model reveals a general lack of realism as well as its conceptual parsi-
mony. Considerable information is needed to parameterize this model, but more importantly the
trophic sequence is based on overly simplified exchanges. Species only feed on those prey in the
next lower trophic level and are only consumed by species at the next highest trophic level. This
might be adequate in some situations, but it is inadequate for modeling many food webs.
Thomann (1981) expanded this steady-state approach by including organism growth rate and
uptake of contaminants from water. Organism growth was incorporated because any increase in
body mass has an apparent dilution effect on contaminant concentration. Inclusion of uptake from
water allowed comparison of the relative importance of food and water sources.Afood chain transfer
number ( f ) serves this purpose.
f =
αC
k
+G. (34.7)
In this equation, α = the chemical absorption efficiency ( f
i
in the simple BAF model above),
C = the specific consumption (weight-specific consumption rate in units of mass of prey/(mass of
predator ×day), k = excretion rate (k
i
in the BAF model above), and G = net organism growth rate.
Thomann (1981) generalized that significant food chain transfer was indicated if f > 1, but uptake of
contaminants from water was more important than food sources if f < 1. Applying this rule to PCBs,
239
Pu and
137
Cs data, he concluded that PCB and radiocesium concentrations in top predators were
predominantly determined by food sources but accumulated plutonium came primarily from water
sources. Thomann (1981) also added explicit details to this steady-state model for predicting water
→ phytoplankton, phytoplankton → zooplankton, zooplankton → small fish, and small fish →
large fish transfers of contaminants. Later (Thomann 1989), this approach was focused on predicting
transfer of organic chemicals in food chains by relating relevant model parameters to K
ow
. Trophic
© 2008 by Taylor & Francis Group, LLC
Clements: “3357_c034” — 2007/11/9 — 12:39 — page 746 — #10
746 Ecotoxicology: A Comprehensive Treatment
transfer in simple aquatic systems was predicted to be insignificant if log
10
K
ow
< 5. Food chain
transfer was important for top predators in aquatic systems if log
10
K
ow
was between 5 and 7.
34.3.3 MODELS INCORPORATING OMNIVORY
A major shortcoming of the approaches described above is the assumption that no species feeds on
more than one trophic level. Although unrealistic in many cases, this assumption allows a level of
accuracy in predicting trophic transfer of some contaminants. After noting that such an approach was
insufficient to define trophic transfer in a pelagic food web, Cabana and Rasmussen (1994) expanded
trophic models to include “omnivory.” Here, omnivory means that a species is feeding on food items
coming from several trophic levels. Although the approach is similar to that described above, matrix
formulation accommodates the increased number of trophic exchanges. In this approach, fractions
of the total amount of the ith level’s diet coming from specific trophic levels ( j) are designated ρ
ij
.
Obviously, all ρ
ij
fractions sum to 1 in order to include the entire diet of level i. The total ration to
the ith level (C
i
) is defined as follows:
C
i
=
j
1
ρ
ij
C
j
. (34.8)
The fractions of the ith level’s diet coming from the different sources ( j levels) can be placed
into a matrix with the subdiagonal reflecting the fractions for the simple Level 1 → Level 2,
Level 2 → Level 3, Level 3 → Level 4, and so forth transfers. The fractions entered below the sub-
diagonal are those for the transfers not accommodated in Thomann’s model (e.g., Level 1 → Level 3
and Level 2 → Level 4 transfers). The following relationship describes a vector of the total rations
for all trophic levels i in a trophic scheme with four levels:
C
i
=
C
1
C
2
C
3
C
4
0000
ρ
21
000
ρ
31
ρ
32
00
0 ρ
42
ρ
43
0
. (34.9)
Such a matrix was called an omnivory matrix by Cabana and Rasmussen (1994). The food
chain model reduces to the simple one described by Thomann if fractions for all matrix elements
are 0 except those in the subdiagonal. There are more complex exchanges in the omnivory matrix
illustrated above because neither ρ
31
nor ρ
42
is equal to 0.
Using matrix notation and omitting accumulation for all sources except food, Cabana and
Rasmussen (1994) redefined Thomann’s steady-state model as the following:
B = αC[(K +G)I]
−1
, (34.10)
where, for the different trophic levels, B = a vector of BAFs, α = a vector of assimilation (chemical
absorption) efficiencies, C = a vector of rations, K = a vector of excretion rates, G = a vector
of growth rates, and I = the identity matrix. They expanded this formulation to include exchanges
other than those depicted in the matrix subdiagonal (e.g., ρ
42
and ρ
43
) in the example above. The
following matrix-formulated model predicts a vector of contaminant concentrations (ν) expected for
the i trophic levels in a food web incorporating omnivory:
ν(ρνI)
−1
= αC[(K +G)I]
−1
. (34.11)
In this model, ρ is the omnivory-adjusted mean dietary concentration for each trophic level.
© 2008 by Taylor & Francis Group, LLC
Clements: “3357_c034” — 2007/11/9 — 12:39 — page 747 — #11
Fate and Transport of Contaminants in Ecosystems 747
A major challenge to applying this approach is to obtain estimates of elements in the omnivory
matrix. Some estimates of the trophic position must be obtained that includes the possibility that
species are feeding at various lower levels. In Section 34.4.4, a technique will be described that
can be applied to these estimates.
34.3.4 THE INFLUENCE OF LIFE HISTORY,HABITAT ASSOCIATIONS,
AND
PREY TOLERANCE ON CONTAMINANT TRANSPORT
Species-specific feeding habits, habitat associations, and tolerance of prey will greatly influence food
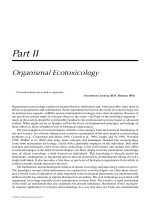
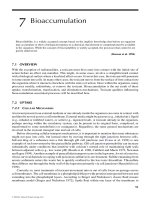
chain transfer and levels of contaminants in top predators. Gewurtz et al. (2000) reported significant
variation inPAH and PCB concentrations among benthic macroinvertebrate taxa collected from Lake
Erie, USA (Figure 34.3). The highest concentrations of both classes of compounds were observed
in the mayfly Hexagenia, organisms that inhabit and consume highly contaminated sediments and
detritus. Because of the importance of Hexagenia in the diet of both aquatic and terrestrial predators,
and because abundance of these organisms is increasing as a result of improvements in water quality
(primarily reduced anoxia), it is likely that greater PAH and PCB exposure to the Lake Erie food
web will occur (Gewurtz et al. 2000). Differences in organochlorine concentrations among water-
fowl species from the Great Lakes were directly related to consumption of zebra mussels (Dreissena
polymorpha), an introduced species that has dramatically altered food chains in this region (Mazak
et al. 1997). Variation in contaminant concentrations within populations were also explained by the
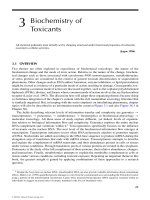
proportion of zebra mussels in the diet. Similarly, differences in feeding habits between populations
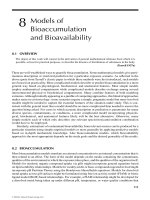
of small mammals also accounted for large variation in Hg bioaccumulation (Figure 34.4). Higher
levels of contamination in prey and greater transfer efficiency resulted in a 20 times higher con-
centrations of Hg in insectivorous mammals (shorttail shrew) compared to omnivorous mammals
(white-footed mouse) (Talmage and Walton 1993). Finally, several investigations have reported that
concentrations of contaminants in aquatic systems are often higher in smallprey organisms compared
to larger individuals (van Hattum et al. 1991, Kiffney and Clements 1993). This phenomenon may be
partially explained by the greater surface area to volume ratio of small individuals. Regardless of
the explanation, predators that select smaller prey species, such as juveniles and early life stages,
may be at greater risk from contaminant exposure (Farag et al. 1998).
Habitat associations of prey species will contribute to variation in contaminant levels among
predators. Contaminated habitats are typically characterized by reduced species diversity and a shift
in community composition from sensitive to tolerant species. Prey species directly associated with
Compound
PAHs PCBs
Concentration (µg/g)
0
5
10
15
20
25
Mayflies
Mussels
Amphipods
Crayfish
FIGURE 34.3 Concentrations (µg/g, lipid basis) of total PAHs and total PCBs measured in benthic
macroinvertebrates collected from Lake Erie, USA. (Data from Table 1 in Gewurtz et al. (2000).)
© 2008 by Taylor & Francis Group, LLC
Clements: “3357_c034” — 2007/11/9 — 12:39 — page 748 — #12
748 Ecotoxicology: A Comprehensive Treatment
Litter
Soil
Vegetation
Herbivorous inverts
Omnivorous mammals
Detritivores
Carnivorous inverts
Insectivorous mammal
0.3
1
3
10
30
100
300
1 000
Trophic level
Concentration (µg/g)
FIGURE 34.4 Hg concentrations (µg/g wet weight) in soil, litter, vegetation, invertebrates, and small mam-
mals (kidney tissue) collected from a terrestrial field site at Oak Ridge National Laboratory. Dietary differences
and variation in transfer coefficients were hypothesized to account for the differences in Hg levels between
omnivorous and insectivorous mammals. (Data from Figure 1 in Talmage and Walton (1993).)
the most contaminated compartments in these systems (e.g., sediments, periphyton) are likely to have
significantly elevated levels of chemicals. Several investigators have shown that feeding habits of
predators at impacted sites may be modified to include these tolerant and highly contaminated prey
species (Clements and Livingston 1983, Jeffree and Williams 1980, Livingston 1984). For example,
Jeffree and Williams (1980) reported that fish switched from pollution-sensitive to pollution-tolerant
prey in streams polluted by mining effluents. As described above, these shifts in feeding habits are
likely to influence contaminant levels in top predators.
Pollution-tolerant species employ a variety of mechanisms to detoxify contaminants, includ-
ing increased excretion, storage, and compartmentalization. The specific method of detoxification
employed by prey species in polluted environments may influence bioavailability and food chain
transfer. In particular, organisms that store or compartmentalize contaminants may pose a signi-
ficant risk to predators. This phenomenon, called the “food chain effect,” has been reported for
species inhabiting metal-polluted environments (Dallinger et al. 1987). In a laboratory study, fish
fed Cd-contaminated mussels accumulated approximately two times higher metal levels than fish fed
Cd-contaminated chironomids, despite greater metal concentrations in the chironomids (Langevoord
et al. 1995). These differences were related to differences in detoxification mechanisms between the
two species. Wallace et al. (1998) showed that metal-tolerant oligochaetes accumulated four times
more Cd than nonresistant organisms when exposed in the laboratory. However, because of dif-
ferences in regulatory mechanisms employed by resistant and nonresistant prey (storage in metal
rich granules vs. metallothionein), metals in nonresistant oligochaetes were more bioavailable to
predators. Cain et al. (2006) noted that rates of Cd uptake by caddisflies were similar in organisms
collected from reference and metal-polluted streams. However, a larger fraction of Cd was associated
with metallothionein-like proteins in caddisflies from the metal-polluted stream.
Finally, variation in life history characteristics of dominant prey species may control contaminant
uptake and transfer to higher trophic levels. Elevated concentrations of persistent organic pollutants
in alpine and subalpine lakes compared to montane lakes have been attributed to greater deposition
by snowfall (Blais et al. 1998). Life history characteristics of dominant prey species in these systems
play an important role in determining uptake and transport of organochlorines. Blais et al. (2003)
measured levels of persistent organic contaminants in amphipods from lakes along a 1300 m eleva-
tion gradient in Alberta, Canada. Concentrations of semivolatile organic compounds in Gammarus
© 2008 by Taylor & Francis Group, LLC
Clements: “3357_c034” — 2007/11/9 — 12:39 — page 749 — #13
Fate and Transport of Contaminants in Ecosystems 749
lacustris increased with elevation. Most of the variation in contaminant accumulation was explained
by the slower growth rates and higher lipid content of amphipods from alpine lakes. Because amphi-
pods are an important component of the food web in these lakes, it is likely that top predators will
also be exposed to higher levels of these persistent contaminants.
34.3.5 TRANSPORT FROM AQUATIC TO TERRESTRIAL COMMUNITIES
While the majority of studies investigating food chain transport of contaminants have focused on
invertebrates and fish, a few researchers have attempted to quantify movement from aquatic systems
to avian and mammalian predators. Export of contaminants from aquatic to terrestrial ecosystems
can be significant in some situations, posing risks to terrestrial predators. By integrating estimates
of secondary production with measures of Cd concentration in emerging insects, Currie et al. (1997)
calculated that 1.3–3.9 g Cd was exported annually by aquatic insects (dipterans, dragonflies, and
mayflies) from Cd-treated Lake 382 in the Experimental Lakes Area, Ontario. Fairchild et al. (1992)
estimated that as much as 2% of 2,3,7,8-tetrachlorodibenzofuran (TCDF) in sediments are exported
annually by emerging insects, posing a significant risk to terrestrial predators (primarily birds and
bats). Froese et al. (1998) measured transport of PCBs from emerging aquatic insects to tree swallows
in Saginaw Bay, Michigan. Relative concentrations of PCB congeners were markedly different
between sediments, benthic invertebrates, and swallows, possibly reflecting metabolic differences
among trophic levels. This relationship between contaminant concentrations in sediments and levels
in terrestrial predators is often complex and will be influenced by trophic relationships and life
history characteristics of emerging aquatic insects. Maul et al. (2006) reported that biomagnification
of PCBs in nestling tree swallows was dependent on feeding habits of adults birds, which were quite
variable. These researchers cautioned that risk assessments based exclusively on a single component
(e.g., contaminant concentrations in emerging insects) that do not consider life history characteristics
of prey species and feeding habits of predators may be biased. Muir et al. (1988) measured PCBs
and other organochlorines in a marine food chain consisting of arctic cod (Boreogadus saida), ringed
seals (Phoca hispida), and polar bears (Ursus maritimus). In addition to increased concentrations
with trophic level, major differences in the constituents of PCBs and chlordane-related compounds
were observed among species. Elevated levels of organochlorines in bald eagles collected from Lake
Superior were attributed to consumption of highly contaminated gulls (Kozie and Anderson 1991),
which feed predominately on fish. Finally, food chain transport and biomagnification of PCBs have
likely contributed to the decline of otter (Lutra lutra) populations in western Europe (Leonards et al.
1997). In addition to significant biomagnification of PCBs, results of multivariate analyses showed
changes in the distribution of PCB congeners among trophic levels and enrichment of the most toxic
constituents in otters (Figure 34.5).
34.3.6 FOOD CHAIN TRANSFER OF CONTAMINANTS FROM
SEDIMENTS
Because sediments are an important sink for contaminants in aquatic ecosystems, models of contam-
inant transport should include a sediment compartment. Concentrations of contaminants in sediments
are often several orders of magnitude greater than in overlying water, and benthic organisms asso-
ciated with sediments may influence the transport of these contaminants. In addition to their role in
food chain transport of contaminants to higher trophic levels, the activities and movements of benthic
organisms may indirectly affect bioconcentration and bioaccumulation. For example, Reynoldson
(1987) reported that 0.2–7.4 g/m
2
/year PCBs are ingested by oligochaete worms in contaminated
sections of the Detroit River. Similarly, Evans et al. (1991) estimated that 30% of the PCBs depos-
ited annually in Lake Michigan sediments are recycled by amphipods. Vertical migration of the
invertebrate planktivore, Mysis relicta, transports sediment contaminants back to the water column
where they are available to higher trophic levels (Bentzen et al. 1996). Bioturbation, defined as the
© 2008 by Taylor & Francis Group, LLC
Clements: “3357_c034” — 2007/11/9 — 12:39 — page 750 — #14
750 Ecotoxicology: A Comprehensive Treatment
0
0.2
0.4
0.6
0.8
1
1.2
0
0.2
0.6
0.8
1
1.2
0
0.2
0.4
0.6
0.8
1
1.2
0
0.2
0.4
0.6
0.8
1
1.2
−6 −4 −20246
−4
−3
−2
−1
0
1
2
3
*
*
*
*
*
*
*
*
*
*
*
*
*
*
*
*
*
*
*
*
*
*
Otters Invertebrates
Fish Zebra mussels
PC 1
PC 3
Increasing
trophic level
Congener type
Congener type
Congener type
Congener type
0.4
FIGURE 34.5 Results ofPCAshowing the relationship between trophic level and patternsofPCB constituents
in an aquatic food web. (Modified from Figure 4 in Leonards et al. (1997).)
Day 18
Day 2
0 50 100 150 200 250 300 350
0
10
20
30
40
50
60
Number of amphipods
Concentration (µg/g)
FIGURE 34.6 The influenceof bioturbation by benthic invertebrates on concentration of fluoranthene in filter-
feeding mussels. The figure shows results after 2- and 18-day exposure. (Modified from Figure 4 in Ciarelli
et al. (1999).)
reworking of sediments resulting from various activities ofbenthic organisms, releases sediment con-
taminants into overlying water where they are bioconcentrated by other organisms and transferred
to higher trophic levels. Ciarelli et al. (1999) observed that activities of amphipods in sediments
resulted in significant transfer of PAHs to filter-feeding mussels (Figure 34.6). Finally, consumption
of contaminated sediments, either directly or incidentally, can result in elevated concentrations in
predators. DiPinto and Coull (1997) estimated the transfer of PCBs in a simple benthic food chain
(sediments → copepods → fish). Approximately 33% of the PCB Aroclor 1254 accumulated by
copepods was transferred to fish. Interestingly, PCB levels in predators foraging on clean prey in
contaminated sediments were five times greater than those in fish feeding on contaminated prey in
clean sediments. These results suggest that incidental ingestion of sediments is a significant route of
exposure in benthic-feeding fish.
Comparative studies of food webs in different ecosystems provide an opportunity to evaluate
the relative importance of sediment and aqueous exposure to contaminants. Morrison et al. (2002)
© 2008 by Taylor & Francis Group, LLC
Clements: “3357_c034” — 2007/11/9 — 12:39 — page 751 — #15
Fate and Transport of Contaminants in Ecosystems 751
compared transport andfate of PCBs inthe eastern and western basins of LakeErie, areasthat differ in
important limnological and geomorphological characteristics related to sediment–water interactions.
Compared to the deeper eastern basin, the western basin of Lake Erie is relatively shallow, highly
productive, and subjected to high winds that result in sediment resuspension. Concentrationsof PCBs
in organisms were much higher in the western basin, and PCBs in water contributed significantly
to these body burdens compared to organisms from the eastern basin. These differences also have
important implications for the responses of organisms to hypothetical decreases in PCBs in water
and sediment. In the eastern basin, fugacity of PCBs in sediment was much greater than fugacity in
water, indicating that organisms accumulate most of their PCBs from sediment. Thus, remediation
efforts to reduce PCB levels in sediments would likely be successful. In contrast, because organisms
from western Lake Erie receive significant amounts of PCBs from water, remediation efforts should
focus on reducing levels of dissolved PCBs.
34.3.7 BIOLOGICAL PUMPS AND CONTAMINANT TRANSFER IN
ECOSYSTEMS
Persistent organic pollutants such as PCBs, HCB, and dichlorodiphenyltrichloroethane (DDT), as
well as Hg are widely distributed by the atmosphere and oceans. The global distribution of these
contaminants is indicated by their elevated levels in food webs of remote arctic and subarctic eco-
systems. Transport of persistent pollutants in remote marine ecosystems is facilitated by migratory
salmon that accumulate contaminants from the ocean and deliver them to their native lakes when
they return to spawn. These migrating organisms act as biological pumps, delivering contaminants
upstream where they may accumulate in aquatic food webs. Krummel et al. (2003) observed a highly
significant relationship (r
2
≥ .9) between the density of spawning sockeye salmon (Oncorhynchus
nerka) and PCB concentrations in lake sediments. Concentrations of PCBs in lakes with spawning
salmon were approximately six times greater than in lakes without fish, and the pattern of PCB
congeners in lake sediments was very similar to those in fish. Persistent pollutants that are pumped
upstream may be accumulated in arctic food webs of receiving systems. Ewald et al. (1998) reported
elevated levels of PCBs and DDT in arctic grayling (Thymallus arcticus) collected from lakes with
returning migratory salmon. Similar transport of marine-derived contaminants has been reported
in arctic seabirds. Blais et al. (2005) collected sediments from ponds at the base of cliffs along
a gradient of petrel (Fulmarus glacialis) use in the Canadian Arctic. Concentrations of Hg, DDT,
and HCB were 10–60 times greater in sediments collected from ponds with high petrel use as a result
of inputs from guano. This research indicates that in some instances biological transport can have
a much greater influence on levels of organic contaminants in arctic and subarctic ecosystems than
atmospheric deposition.
34.4 ECOLOGICAL INFLUENCES ON FOOD CHAIN
TRANSPORT OF CONTAMINANTS
Most studies that describe uptake and food chain transport of contaminants usually do not focus on
the ecology of these systems, but simply report tissue concentrations in biotic and abiotic compart-
ments. More recently, researchers have recognized that ecological characteristics of communities
influence contaminant transfer and the concentrations in upper trophic levels. Because food web
interactions strongly influence energy flow and biogeochemical cycling, understanding the relative
importance of consumer versus resource control is important for predicting chemical transport. For
example, the concentration of lipophilic contaminants in top predators will be influenced by food
web interactions and the relative strength of top-down versus bottom-up controls. The development
of new techniques to quantify feeding preferences, such as stable isotope analyses, allows invest-
igators to better characterize relationships between trophic level and contaminant concentrations.
© 2008 by Taylor & Francis Group, LLC
Clements: “3357_c034” — 2007/11/9 — 12:39 — page 752 — #16
752 Ecotoxicology: A Comprehensive Treatment
In addition, the larger spatial scale of many contemporary food web studies provides an opportunity
to investigate how landscape features influence food chain transport of chemicals. Quantifying the
relative importance of ecological factors on contaminant transport is greatly improved by making
comparisons across communities. For example, studying contaminant levels in systems that lack
point source discharges allows investigators to isolate the relative importance of ecological and
habitat features. The best examples of this research have been conducted in remote systems where
atmospheric deposition is the primary source of contamination (Berglund et al. 1997, Kidd et al.
1995, Kidd et al. 1998, Larsson et al. 1992, Rasmussen et al. 1990). Better integration of ecological
and landscape concepts into kinetic and bioenergetic models will allow for a more comprehensive
understanding of contaminant transport in communities.
34.4.1 FOOD CHAIN LENGTH AND COMPLEXITY
Understanding the relative importance of ecological factors such as food chain length, primary and
secondary productivity, and linkage strength will help explain the large amount of variability in
contaminant concentrations often observed in predators collected from different ecosystems. The
early work by Rasmussen et al. (1990) stimulated a significant amount of interest in the relationship
between food web structure and contaminant transport. These investigators classified lakes into
three types based on the presence of invertebrate planktivores (Mysis) and pelagic forage fish. Trout
collected from lakes with long food chains (i.e., more trophic levels) generally had higher PCB
levels than fish from lakes with simple food chains (Figure 34.7). Similar results were reported by
Kidd et al. (1995) in which elevated levels of toxaphene in fish collected from a subarctic lake were
attributed to an “exceptionally long” food chain.
The influence of food chain length on contaminant levels in top predators may have important
implications for systems where food webs are altered by exotic species. Introduced species that
lengthen food chains may increase levels of persistent chemicals in top predators (Cabana et al. 1994,
Cabana and Rasmussen 1994, Kidd et al. 1995), especially if these species link contaminated benthic
habitats to pelagic consumers. However, results of studies attempting to demonstrate enhanced food
chain transport inecosystems where exotic specieshave invaded are mixed. Rainbowsmelt (Osmerus
mordax) have recently invaded many freshwater ecosystems of North America. Because rainbow
Class 1 Class 2 Class 3
0
200
400
600
800
1 000
1 200
0
5
10
15
20
Trophic classification
Concentration (ng/g wet wt.)
Concentration (ng/g lipid)
FIGURE 34.7 Influence of trophic structure on concentrations of PCBs in lake trout from central Ontario
lakes. Data are shown as total PCBs (solid bars) and after correcting for lipid content (open bars). Class 1 lakes
with short food chains lack Mysis and pelagic forage fish. Class 2 lakes with intermediate length food chains
lack Mysis but have pelagic forage fish. Class 3 lakes with long food chains have both Mysis and pelagic forage
fish. (Data from Table 1 in Rasmussen et al. (1990).)
© 2008 by Taylor & Francis Group, LLC
Clements: “3357_c034” — 2007/11/9 — 12:39 — page 753 — #17
Fate and Transport of Contaminants in Ecosystems 753
smelt are generally more piscivorous than native forage fish, top predators in these systems may be
exposed to higher levels of contaminants. Johnston et al. (2003) reported that the decline in Hg levels
of top predators over time was less in smelt-invaded lakes than in reference lakes; however, these
differences were not statistically significant. Similarly, Swanson et al. (2003) found that despite the
elevated trophic position of rainbow smelt relative to other forage fish, there was little evidence of
increased bioaccumulation of Hg in top predators. These researchers concluded that some predictions
based on food web theory and contaminant transfer among trophic levels may not be applicable to
boreal lakes and that contaminant levels may not be appropriate measures of trophic position in these
systems.
The complexity of food webs and the presence of key species may also influence concentrations
of contaminants in top predators. Wonget al. (1997) attributedhigh rates of Hg transport from benthic
communities to fish in an Ontario lake to the presence of piscivorus fish. These top predators reduced
abundance of benthic-feeding fish, resulting in greater biomass of macroinvertebrates. Presence of
the invertebrate planktivore, Mysis relicta, was found to regulate food chain transport of organic
contaminants (DDT, PCBs) in pelagic food webs (Bentzen et al. 1996). Stemberger and Chen (1998)
observed a negative relationship between metal levels in fish tissue and the number of trophic links.
They speculated that complex food webs may contain a large number of lateral or horizontal links
that do not terminate in top predators, resulting in reduced metal transfer within the community.
Although most studies relatinglevels of contaminants to foodchain length have been conductedin
aquatic habitats, recentevidencesuggeststhattrophiccomplexitywill also influence bioaccumulation
and biomagnification in terrestrial species. Differences in food chain structure may explain why
concentrations of organochlorines and other lipophilic contaminants are often higher in aquatic
mammalian predators (e.g., mink, otters) compared to terrestrial predators. Bremle et al. (1997)
speculated that the shorter food chains typical of terrestrial systems may account for lower levels of
PCBs in pine marten (a forest-dwelling mustelid) compared to those in aquatic predators. Similarly,
the elevated levels of organochlorines and Hg measured in bald eagles from the AleutianArchipelago
supports the hypothesis that food chain length influences bioaccumulation and biomagnification.
Levels of contaminants were greater and reproductive success was lower in eagles that consumed
fish-eating seabirds compared to eagles that fed directly on fish (Anthony et al. 1999).
34.4.2 PRIMARY PRODUCTIVITY AND TROPHIC STATUS
Productivity and trophic status of ecosystems can greatly influence the fate and transport of con-
taminants through food webs. Several researchers have shown that levels of organochlorines in
phytoplankton and the potential transport of these chemicals to higher trophic levels are largely
determined by primary productivity (Hanten et al. 1998, Larsson et al. 1992, Taylor et al. 1991).
Because the flow of some chemicals is closely related to carbon flux, turnover rates and productivity
can affect the transfer of pollutants (Wallberg andAndersson 2000). In general, productive lakes have
higher rates of sedimentation and greater biomass dilution, resulting in lower contaminant transfer.
However, depending on the composition of these dissolved or particulate fractions, movement of
contaminants from sediments back to the water column can be increased. Wallberg and Andersson
(2000) compared transfer of carbon and PCBs through a microbial food web during a rainy season
and a dry season. Net C flux was approximately three times greater during the more productive
rainy season, corresponding to a three times increase in PCBs concentrations in plankton. Larsson
et al. (1992) reported significant variation in concentrations of PCBs and DDE in predatory fish from
61 Scandinavian lakes, despite similar inputs of pollutants. In general, levels of persistent chemicals
decreased with lake productivity and concentration of humic substances. These researchers specu-
lated that lower levels of chemicals in more productive lakes resulted from higher growth rates of
fish (and corresponding growth dilution) and faster turnover of phytoplankton.
Experimental enrichment provides an opportunity to assess effects of productivity on contamin-
ant transfer under controlled conditions. Currie et al. (1998) added N and P to littoral enclosures to
© 2008 by Taylor & Francis Group, LLC
Clements: “3357_c034” — 2007/11/9 — 12:39 — page 754 — #18
754 Ecotoxicology: A Comprehensive Treatment
examine effects of nutrient enrichment on contaminant transfer and uptake by organisms. Increased
productivity was associated with higher Cd concentrations in the water column and greater Cd accu-
mulation by zooplankton and chironomids. Greater uptake in the pelagic and benthic components
of enriched enclosures was attributed to exposure to Cd-enhanced particulate materials (Currie et al.
1998). Using a 2 × 2 factorial design, Ridal et al. (2001) manipulated nutrients and planktivorous
fish in large lake enclosures to examine effects on accumulation and transfer of organochlorine pesti-
cides. Removal of large grazing zooplankton (Daphnia) by planktivorous fish in nutrient-enriched
enclosures resulted in significantly greater biomass of small plankton. Concentrations of pesticides in
zooplankton and fish were reduced in nutrient-treated enclosures because greater amounts of contam-
inants were sorbed by phytoplankton. The observation that concentrations of organochlorines were
greater in low-nutrient mesocosms was consistent with results of studies conducted in oligotrophic
lakes (Ridal et al. 2001).
Although studies of lentic systems have generally shown a negative relationship between pro-
ductivity and contaminant levels in top predators, food chain transfer of contaminants in streams
may be quite different. Streams differ from lakes and large rivers in several important ways, including
major physical structuring forces (flow vs. thermal stratification), sources of energy (allochthonous
vs. autochthonous), major primary producers (periphyton vs. phytoplankton), and factors that con-
trol primary productivity (light vs. nutrients). As a consequence, the ecological factors that regulate
contaminant transport in lotic and lentic communities may be quite different. In contrast to results
observed in lakes, Berglund et al. (1997) reported that levels of organochlorines in brown trout
from streams increased with primary productivity. Differences between lotic and lentic systems
were attributed to spiraling of pollutants, a shift from heterotrophic to autotrophic production, and
the greater influence of watershed area on streams. Hill et al. (2000) reported that Cd sorption by
periphyton increased with biomass. This finding has important implications for the downstream
transport of contaminants in lotic ecosystems, especially in shallow streams where a relatively large
portion of water is in contact with periphyton.
The relationship between phytoplankton biomass and levels of contaminants in higher trophic
levels has important implications for the biomanipulation experiments described in Chapter 27
(Box 27.1). If the introduction of piscivorous fish to lakes results in lower abundance of planktivores
and greater abundance of zooplankton as predicted by the trophic cascade hypothesis (Carpenter and
Kitchell 1993), we may expect organochlorine concentrations in top predators to increase (Taylor
et al. 1991). Other potential conflicts exist between managing fisheries for maximum sustainability
and controlling PCB levels in sport fishes (Figure 34.8). The sport fisheries in the Great Lakes is
an approximately $10 billion per year industry. Thus, understanding the relationship between PCB
levels in top predators and sport fisherymanagement has major socioeconomic implications. Because
of size-selective predation, stocking programs for salmonids and other predators may influence size
structure and growth rates of prey (Jackson 1997). Lower stocking rates of salmonids would most
likely reduce predation pressure and result in older, more contaminated prey species.Although higher
stocking rates would result in less contaminated prey, increased predation pressure would increase
the probability of a prey population crash. Jackson (1997) developed an age-structured model for
Lake Ontario that considered the trade-offs between managing the Great Lakes for a sustainable
fishery and the potential problems associated with elevated PCBs in top predators. Results of this
model showed that small changes in stocking levels had significant effects on PCB concentrations
in predators and the probability of a crash in prey communities.
Trophic status of lakes can control the biogeochemical cycling of contaminants within an eco-
system and the potential export of these materials to other ecosystems. Jeremiason et al. (1999)
used a paired whole-lake experiment to document the effects of nutrient enrichment on mass
budget of PCBs in two lakes receiving the same atmospheric source. Greater productivity in the
nutrient-enriched ecosystem resulted in higher settling rates of particle-associated PCBs, presum-
ably removing some dissolved PCBs from the water column. Because the dissolved concentrations
© 2008 by Taylor & Francis Group, LLC
Clements: “3357_c034” — 2007/11/9 — 12:39 — page 755 — #19
Fate and Transport of Contaminants in Ecosystems 755
Predator stocking
Decreased predation Increased predation
Increased prey
survival
Decreased prey
survival
Increased avaliability
of larger, more
contaminanted prey
Decreased avaliability
of larger, more
contaminanted prey
Size selective
predation
Size selective
predation
Lower probability of
prey crash and higher
predator (PCB)
Higher probability of
prey crash and lower
predator (PCB)
−
+
FIGURE 34.8 Trade-off between managing a sustainable Great Lakes salmon fishery and maintaining PCB
concentrations below the consumption advisory. (Modified from Figure 1 in Jackson, L.J., Ecol. Appl.,
7, 991–1001, 1997. Reproduced by permission of the Ecological Society of America.)
were actually similar between control and nutrient-enriched lakes, these researchers concluded that
the net volatilization was reduced in the eutrophic system.
34.4.3 LANDSCAPE CHARACTERISTICS
Large scale, comparative studies have documented the influence of landscape features such as water-
shed area, land use, and hydrologic characteristics on food web structure and contaminant transport.
In one of the first comprehensive investigations of landscape influences on the distribution of organo-
chlorines, Munn and Gruber (1997) reported that land use determined DDT and PCB concentrations
in fish collected from a 34,000 km
2
study area in Washington and Idaho, USA. The concentrations of
these persistent contaminants in predators will also be influenced by local hydrologic characteristics
and trophic dynamics within a watershed. Macdonald et al. (1993) reported greater bioavailability of
PCBs in shallow lakes compared to deep lakes, and speculated that food web processes were more
important determinants of contaminant transport in these larger systems. Similarly, Hanten et al.
(1998) observed that watershed and hydrological characteristics explained a significant amount of
variation in Hg concentrations in fish from 46 Connecticut (USA) lakes. In contrast, Paterson et al.
(1998) found no relationship between lake size and levels of PCBs in zooplankton and fish. However,
because organic carbon content decreased with lake size, levels of PCBs in sediment expressed on
an organic carbon basis were greater in larger lakes. Chen et al. (2000) examined food webs in 20
lakes across a gradient of metal contamination. Landscape-level characteristics (elevation, lake area,
© 2008 by Taylor & Francis Group, LLC
Clements: “3357_c034” — 2007/11/9 — 12:39 — page 756 — #20
756 Ecotoxicology: A Comprehensive Treatment
Time period
1885–1900 1900–1931 1950–1970 1992–1994
Concentration (µg/g fresh wt.)
0
5
10
15
20
25
Epipelagic species
Mesopelagic species
FIGURE 34.9 Long term increase in mean (+ SE) Hg concentration in epipelagic (Cory’s shearwater) and
mesopelagic (Bulwer’s petrel) seabirds in the North Atlantic. Mesopelagic birds feed on more contaminated
prey. (Data from Table 1 in Monteiro and Furness (1997).)
watershed area, and land use) explained significant amounts of variation in aqueous metal concen-
trations, which were then used to predict sources of metal contamination in higher trophic levels.
Results showed that water was a significant source of Cd and Zn contamination in fish, whereas diet
was a more important source of Hg contamination.
Land use within a watershed may interact with trophic characteristics to influence contamin-
ant transport. Berglund et al. (1997) reported that the percent of land in agriculture was positively
associated with higher levels of nutrients and higher concentrations of organochlorines in top pred-
ators. Evers et al. (1998) attributed variation in Hg concentrations measured in the common loon
(Gavia immer) to large-scale geographic patterns of anthropogenic deposition. However, variation
within a region was explained primarily by geochemical variables and lake morphology. Long-term
(100 year) trends in Hg contamination were documented by comparing concentrations in bird com-
munities collected from the North Atlantic (Monteiro and Furness 1997). Using museum specimens
from the late 1800s, these researchers showed that concentrations of mercury in mesopelagic birds
(those feeding on mesopelagic fish) were generally higher and increased more over the 100-year
period compared to concentrations in epipelagic birds (Figure 34.9). Although increased Hg over
time in epipelagic birds was consistent with increases observed in global Hg concentrations, levels in
mesopelagic birds were considerably greater. Differences between these two groups were attributed
to the greater production of methylmercury in low oxygen, mesopelagic seawater.
A spatially extensive survey of PCB concentrations in herring gull eggs collected from the
Great Lakes showed that levels have declined significantly between 1974 and 1996 (Hebert 1998).
However, concentrations appear to have stabilized through the 1990s (Figure 34.10). Interestingly,
much of theannual variation in PCBconcentrations resulted from theeffects of winterseverity on gull
feeding and migration behavior. Previous studies demonstrated that winter severity influenced PCB
concentrations in gulls by altering the proportion offishinthediet(Hebertet al. 1997). In a subsequent
study, Hebert (1998) speculated that extreme winters forced gulls to migrate farther south where they
fed in morecontaminated locations. Thisstudy illustrates theimportance of accounting forbehavioral
characteristics of animals when assessing long-term patterns in contaminant accumulation.
In addition to the direct effects on food webs and contaminant transport, certain landscape
characteristics can also influence factors that regulate contaminant bioavailability. Variation among
watersheds in pH, water hardness and other factors known to influence metal bioaccumulation is
© 2008 by Taylor & Francis Group, LLC
Clements: “3357_c034” — 2007/11/9 — 12:39 — page 757 — #21
Fate and Transport of Contaminants in Ecosystems 757
1974
1976
1978
1980
1982
1984
1986
1988
1990
1992
1994
1996
0.6
0.8
1
1.2
1.4
1.6
1.8
2
Year
Log concentration (µg/g wet wt.)
FIGURE 34.10 Temporal patterns in PCB concentrations (log
10
) in herring gull eggs collected from Double
Island, Lake Huron, USA. The data show that PCB levels have declined significantly since 1974, but that
concentrations have stabilized around 10 µg/g wet weight. Some of the annual variation resulted from the
effects of winter severity on migration patterns. (Data from Table 4 in Hebert (1998).)
Log
10
discharge (cm)
−2 −10 1 2
Log
10
DOC
−2
−1
0
1
Percent forested area
10 20 30 40 50 60 70 80
Mean DOC (mg/L)
−2
−1
0
1
2
3
4
5
6
DOC
Metal levels in
benthic macroinvertebrates
FIGURE 34.11 The influence of landscape characteristics on dissolved organic carbon (DOC) and metal
bioavailability in benthic macroinvertebrates collected from Rocky Mountain streams, USA. The concentra-
tion of DOC, an important determinant of metal bioavailability in aquatic organisms, is influenced by stream
discharge and the amount of vegetation in a watershed. (Data showing the relationship between forested area
and DOC from Prusha and Clements (2004).)
influenced by geological features (Quinlan et al. 2003, Xie et al. 2005, Young et al. 2005). Prusha and
Clements (2004) measured metal concentrations and landscape characteristics in 16 watersheds loc-
ated in central Colorado (USA). Results showed that metal concentrations in caddisflies (Trichoptera)
were inversely related to concentrations of dissolved organic carbon, which in turn were controlled
by stream discharge and the amount of terrestrial vegetation within a watershed (Figure 34.11).
© 2008 by Taylor & Francis Group, LLC
Clements: “3357_c034” — 2007/11/9 — 12:39 — page 758 — #22
758 Ecotoxicology: A Comprehensive Treatment
34.4.4 APPLICATION OF STABLE ISOTOPES TO STUDY
CONTAMINANT FATE AND EFFECTS
The same problems and limitations associated with characterizing food webs for basic ecological
studies also complicate ecotoxicological investigations. In particular, obtaining reliable estimates of
biomagnification of contaminants is difficult because trophic levels are often poorly defined. Dietary
analyses of consumers only provide a snapshot of feeding habits, and often omit important seasonal
and ontogenetic changes. Indeed much of the variability associated with estimating biomagnification
of different compounds results from uncertainty of assigning organisms to trophic levels. The use of
stable isotopes improves quantitative assessment of food chain transfer of contaminants by treating
trophic position as a continuous variable (Box 34.1). Instead of simply characterizing a predator as
Box 34.1 Stable Isotopes and Contaminant Transport
Food web structure influences the distribution and partitioning of lipophilic chemicals and may
account for significant variation in contaminant concentrations within ecosystems (Rasmussen
et al. 1990). By linking stable isotope analyses with models of contaminant transport, it is
possible to examine the relationship between trophic ecology of a system and movement of
contaminants through food chains. Trophic magnification factors, derived from the slope of the
relationship between contaminant concentration and trophic position (Figure 34.12) may repres-
ent an important application of stable isotopes (Broman et al. 1992). Chemical-specific trophic
magnification factors based on ecologically meaningful trophic relationships offer considerably
more insight into the potential transfer of contaminants through food webs than bioaccumula-
tion or biomagnification factors.
Sediments
Benthic
macroinvertebrates
Phytoplankton
Zooplankton
Benthic-feeding
fish
Planktivorous
fish
Piscivorous
fish
Increasing trophic level
Concentration
15
N (‰)
FIGURE 34.12 Hypothetical relationship between trophic level, as determined by stable isotopes, and
the concentration of contaminants in pelagic (solid line) and benthic (dashed line) food webs. The slope of
the relationship betweentrophic level and contaminant concentration is defined as the trophic magnification
factor. In this example, greater trophic magnification is observed in the pelagic food web compared to the
benthic food web.
© 2008 by Taylor & Francis Group, LLC
Clements: “3357_c034” — 2007/11/9 — 12:39 — page 759 — #23
Fate and Transport of Contaminants in Ecosystems 759
02468101214
0
200
400
600
800
P
S
Z
M
E
H
C
02468101214
10
0
20
30
40
50
Concentration (pg/g dry wt.)
P
Z
M
S
E
H
C
15
N (‰)
FIGURE 34.13 Relationship between trophic position (as indicated by δ
15
N values) and total concen-
tration of 2378-substituted PCDD/Fs (left panel) and toxic content of the 2378-substituted PCDD/Fs (right
panel). P = phytoplankton, S = seston, Z = zooplankton, M = mussels, E = eider ducks, H = herring,
C = cod. (Modified from Figure 3 in Broman et al. (1992).)
Broman et al. (1992) used stable isotopes of C and N to characterize pelagic and littoral
food chains and to estimate biomagnification of polychlorinated dibenzo-p-dioxins (PCDDs).
Levels of δ
15
N in pelagic and littoral food chains increased from phytoplankton → seston →
grazers → top predators, reflecting known trophic differences among these groups. Results
showed that the total concentration of PCDDs and PCDFs decreased, whereas concentrations
of the more toxic constituents increased with trophic level (Figure 34.13). Comparison of the
slopes of the relationship between contaminant concentration and trophic level (as determined
by δ
15
N) for the different PCDD isomers provide an estimate of the biomagnification potential.
Kiriluk et al. (1995) employed a similar approach to assess biomagnification of DDE,
mirex, and PCBs in a pelagic food web. Stable isotope signatures for C and N characterized this
food web and defined lake trout as the top predator in the system. Results showed that δ
15
N
increased with trophic level and was significantly correlated with contaminant concentrations
within the major groups. Similar to results of Broman et al. (1992), these researchers concluded
that the slope of the relationship between δ
15
N and organochlorine concentration (b) was an
indication of biomagnification potential. This study also demonstrated the role of omnivory in
aquatic food chains and showed that omnivory may be important in top predators. Considerable
variation in δ
15
N was measured among individual lake trout, reflecting the opportunistic
feeding habits of these fish.
Quantification offood web structure using stable isotopes may also help clarify relationships
between long-term changes in food webs and contaminant concentrations. Gradual declines in
levels of persistent organochlorines and other contaminants in fish from the Great Lakes have
been observed for the past 20 years (Stow et al. 1995). It is uncertain how much of this decline
reflects reduced levels of contamination versus long-term alterations in food web structure.
Stable isotope analyses may allow researchers to quantify the relative importance of reduced
concentrations of organochlorines and changes in trophic structure (Kiriluk et al. 1995).
a secondary or tertiary consumer, stable isotope analyses provide a quantitative and time-integrated
measure of trophic position. Because δ
15
N values are enriched with trophic position, the relative
degree of omnivory in a predator can also be quantified.
Great advantage has been taken of the fact that stable, naturally occurring nitrogen isotopes are
excreted at different rates by organisms. The heavy isotope (
15
N) is not excreted as readily as the
© 2008 by Taylor & Francis Group, LLC
Clements: “3357_c034” — 2007/11/9 — 12:39 — page 760 — #24
760 Ecotoxicology: A Comprehensive Treatment
lighter
14
N by any species, regardless of its specific excretory biochemistry and physiology. Differ-
ential isotopic excretion leads to differential isotopic retention. A consumer will ingest a source of
nitrogen slightly enriched with
15
N relative to atmospheric N, the ultimate source to all trophic levels.
During the lifetime of that organism,
14
N will be excreted more readily than
15
N, and the enrichment
of
15
N relative to
14
N during an organism’s life will further shift this isotopic ratio in favor of
15
N.
The consequence of this process is a gradual enrichment of
15
N relative to
14
N with each trophic
exchange. Quantifying the degree of
15
N enrichment relative to
14
N produces an index of trophic
status that readily incorporates omnivory.
The δ
15
N metric is the most common way of expressing
15
N enrichment relative to
14
N. The ratio
of
15
N and
14
N in a sample (e.g., fish tissue), is compared to the same ratio in the atmosphere using
the following equation:
δ
15
N = 1000
(
15
N
tissue
)/
14
N
tissue
(
15
N
air
)/(
14
N
air
)
−1
. (34.12)
The units for δ
15
N are parts per thousand (‰ or per mill). The average δ
15
N increase with each
trophic exchange is 3.4‰ (Cabana and Rasmussen 1994, Minawaga and Wada 1984), but it can vary
from 1.3‰ to 5.3‰ (Minawaga and Wada 1984).Aspecies feeding at several trophic levels will have
a δ
15
N value lower than would be predicted if omnivory was not occurring. Cabana and Rasmussen
(1994) related δ
15
Ntoρ
ij
values (the fraction of the ith’s level diet coming from trophic level j) with
lake trout (Salvelinus namaycush) as the apex predator using matrix algebra: δ
15
N −3.4 = ρδ
15
N.
Assuming that the average increase in δ
15
N is 3.4‰ per trophic exchange in these lakes, the realized
δ
15
N for a lake trout feeding at different trophic levels is estimated by accounting for the fraction
of the diet consumed from the different levels.
Numerous studies have related δ
15
N quantitatively to contaminant concentration in various
species occupying different positions in a food web (Broman et al. 1992, Cabana et al. 1994, Hesslein
et al. 1991, Kidd et al. 1995, Rasmussen et al. 1990, Rolff et al. 1993). Instead of relating changes
in δ
15
Ntoρ values, statistical models are constructed relating δ
15
N to contaminant concentration.
These statistical models can be linear (e.g., linear fit of Figure 3 of Cabana and Rasmussen (1994)),
but application of an exponential model is more common:
Concentration = e
a+bδ
15
N
. (34.13)
This model can be fit to data directly with nonlinear regression methods or with linear regression
methods after transformation of concentrations to a log scale:
ln Concentration = a +bδ
15
N. (34.14)
The a and b in the above model are the intercept and slope derived by linear regression. (See
Newman (1993) about the importance of correcting the backtransformation bias that appears while
converting results of linearized exponential models back to the original exponential form.) As a good
example of applying linear regression after concentration transformation, Kidd et al. (1995) related
total toxaphene concentration to δ
15
N in the pristine Laberge Lake (Canada) with the following
model, log
10
of total toxaphene (ng/g wet wt.) = 0.23(δ
15
N per mill) − 0.33. Relative to the same
fish species in lakes nearer to toxaphene sources, trout (S. namaycush), burbot (Lota lota), and
lake whitefish (Coregonus clupeaformis) had very high toxaphene tissue concentrations due to their
more piscivorus habits in Laberge Lake. The δ
15
N and gut content analysis of these species from
several lakes supported this notion. The longer than normal food chain was the only reason for the
relatively elevated toxaphene concentrations in Laberge Lake.
The term b is described by some authors as the trophic magnification factor (Broman et al. 1992,
Rolff et al. 1993). If b > 0, the transfer of a contaminant is more efficient than the trophic transfer of
© 2008 by Taylor & Francis Group, LLC
Clements: “3357_c034” — 2007/11/9 — 12:39 — page 761 — #25
Fate and Transport of Contaminants in Ecosystems 761
biomass and biomagnification of the contaminant will occur. If b < 0, the transfer of a contaminant
is less efficient than the trophic transfer of biomass and contaminant concentrations will decrease
with an increase in trophic position (δ
15
N). Finally, if b = 0, the transfer of a contaminant through
trophic levels is the same as that for biomass and there will be no discernible change in concentration
with increase in δ
15
N. The a in the model is related to the amount of contaminant available at
the base of the food chain (Rolff et al. 1993). However, there will be a bias in this estimate if the
linearizing transformation was used to fit the data to the model and no bias correction was made
(Newman 1993).
34.4.5 THE DEVELOPMENT AND APPLICATION OF BIOENERGETIC
FOOD WEBS IN ECOTOXICOLOGY
Qualitative food web models can illustrate potential links among consumers, but are limited because
the flow of carbon and energy are not quantified. Conversely, quantitative population models allow
researchers to estimate the flow of energy, but data are rarely available for all dominant species in an
ecosystem. There are relatively few examples in the literature where researchers have integrated res-
ults of quantitative food web models with empirical estimates of energy flow to predict contaminant
transport. Carlisle (2000) has proposed a bioenergetic approach for assessing impacts of contamin-
ants on communities that combines population measures of secondary production withenergetic food
webs. Just as growth integrates numerous physiological processes in individual organisms, second-
ary production integrates important population processes and is a useful endpoint in ecotoxicological
investigations. This approach assumes that exposure to contaminants will modify population ener-
getics directly by effects on growth, mortality, production efficiency, and assimilation efficiency.
Indirect effects include alterations in feeding behavior, quality/quantity of resources, and susceptib-
ility to predation (Figure 34.14). Using data collected from Rocky Mountain streams impacted by
heavy metals, Carlisle (2000) measured community-level production in a guild of aquatic insects
Primary consumer
biomass
Consumption
Egestion
Respiration
AE
NPE
Mortality
Secondary consumer
Secondary consumer
biomass
biomass
Secondary consumer
biomass
Consumption
Contaminants
Energy
flow
FIGURE 34.14 Model describing the potential effects of contaminants on bioenergetics. Solid lines show
the flow of energy within and between trophic levels. Dashed lines show the aspects of production that are
most likely to be affected by contaminants. AE = assimilation efficiency; NPE = net production efficiency.
(Modified from Figure 3 in Carlisle (2000).)
© 2008 by Taylor & Francis Group, LLC