ECOTOXICOLOGY: A Comprehensive Treatment - Chapter 35 pdf
Bạn đang xem bản rút gọn của tài liệu. Xem và tải ngay bản đầy đủ của tài liệu tại đây (438.85 KB, 39 trang )
Clements: “3357_c035” — 2007/11/9 — 12:39 — page 771 — #1
35
Effects of Global
Atmospheric Stressors on
Ecosystem Processes
35.1 INTRODUCTION
Global atmospheric stressors create widely distributed physical and chemical perturbations that
impact the structure and function of ecosystems. In addition to their ubiquitous distribution and dif-
fuse sources, global atmospheric stressors are especially problematic because they are not restricted
by geopoliticalboundaries. In Chapter 26, we described the effects ofglobal atmosphericstressors on
abundance, species diversity, community composition, and other structural characteristics. Here we
will focus on descriptive and experimental studies that assess effects of increased CO
2
, N deposition,
acidification, and ultraviolet radiation (UVR) on the function of aquatic and terrestrial ecosystems.
35.2 NITROGEN DEPOSITION AND ACIDIFICATION
In Chapter 30, we described biogeochemical cycles and the important processes that control move-
ment of elements in aquatic and terrestrial ecosystems. Significant increases in the global reservoirs
of C, N, and S as a result of combustion of fossil fuels and agricultural/land use changes disrupt these
natural cycles and have contributed to a variety of local and global environmental concerns. Global
emissions of biologically reactive N compounds (e.g., NH
3
,NH
4
, HNO
3
, and NO
3
) have increased
from about 15 teragrams (Tg) in 1860 to more than 165 Tg in 2000 (Galloway et al. 2003). Although
effects of increased N deposition have not attracted the same attention from scientists and the public
as other global atmospheric stressors such as chlorofluorocarbons (CFCs) and CO
2
, N poses serious
threats to ecosystem processes. Potential negative effects of excess N on forest ecosystems were
first described by Nihlgard (1985). Biologically reactive N compounds that accumulate in the atmo-
sphere are rapidly deposited on the earth’s surface where they can affect net primary productivity
(NPP) (Aber et al. 1995), disrupt N dynamics in soils (Gundersen et al. 1998), and contribute to
eutrophication (Rabalais et al. 2002), acidification (Vitousek 1994), and subsequent loss of biolo-
gical diversity (Stevens et al. 2004). In addition, N
2
O is a potent greenhouse gas that contributes to
global climate change. Because the rates of production of reactive N in the biosphere greatly exceed
rates of removal by denitrification, biologically active N rapidly accumulates in the environment.
Predicting effects of N deposition on aquatic and terrestrial ecosystems is complicated by variation
in regional climate, hydrologic characteristics, vegetation type, and other sources of anthropogenic
disturbance (Aber et al. 2003). Assessing effects of N on ecosystems is also complicated because
deposition often co-occurs with other stressors, such as heavy metals (Gawel et al. 1996). Finally,
input and output of N are not necessarily coupled in all ecosystems, and leaching of nitrate will
depend on nutrient status (Gundersen et al. 1998).
35.2.1 THE NITROGEN CASCADE
Accumulation, transfer, and denitrification of biologically reactive N compounds through the
biosphere and the changes that result have been termed the nitrogen cascade (Table 35.1)
(Galloway et al. 2003). Forests and grassland ecosystems, especially the soil components, are major
771
© 2008 by Taylor & Francis Group, LLC
Clements: “3357_c035” — 2007/11/9 — 12:39 — page 772 — #2
772 Ecotoxicology: A Comprehensive Treatment
TABLE 35.1
Factors That Influence the Nitrogen Cascade in Aquatic and Terrestrial Ecosystems
Ecosystem
Accumulation
Potential
Transfer
Potential
Denitrification
Potential
Biological
Effects
Grasslands and
forests
High Moderate (high in
some places)
Low Biodiversity; NPP; mortality;
groundwater
Freshwater Low; higher in
sediments
Very high Moderate to high Biodiversity; altered community
structure; eutrophication
Coastal marine Low to moderate;
higher in sediments
Moderate High Biodiversity; altered community
structure; algal blooms
Source: Modified from Table 1 in Galloway et al. (2003).
reservoirs for N. Because output of N in undisturbed forest and grassland ecosystems is generally
quite low, residence time can be many years. Forest ecosystems are often N limited, and therefore
N is cycled internally with little export to surface water, groundwater, or the atmosphere. As excess
N deposition increases, other environmental factors will limit NPP and unused N leaches below the
rooting zone, a process known as nitrogen saturation (Aber et al. 1995). Land use changes in forests
and grasslands also have the potential to significantly alter internal N cycling and increase the export
of N to aquatic ecosystems and the atmosphere.
Fertilizers and runoff associated with agricultural and urban areas are the primary contributors of
N to aquatic ecosystems and have been considered in previous chapters. However, nitrogen oxides
(NO
x
) from fossil fuel combustion account for about 25% of the reactive N in the environment.
Although there is relatively little storage of N in overlying water, sediments represent a significant
reservoir of N in aquatic ecosystems. Enrichment of aquatic ecosystems by N deposition can result
in eutrophication, anoxia, and reduced biodiversity. Although natural aquatic ecosystems are highly
retentive of N, this capacity for internal processing can be exceeded, especially in disturbed habitats,
and downstream transport of N can contribute to eutrophication of coastal areas. Transport of N from
rivers to coastal areas is generally regarded as one of the most serious threats to marine ecosystems
(Rabalais et al. 2002). Accumulation potential of N in estuaries is relatively low; however, as with
freshwater ecosystems coastal marine sediments may represent a significant N reservoir. Because
of large amounts of organic material and low concentrations of dissolved oxygen in sediments,
coastal marine ecosystems also have the greatest potential for conversion of reactive N to N
2
by
denitrification, a process that is often enhanced by excess reactive N. In fact, denitrification in rivers
and estuaries greatly reduces the amount of N transported from terrestrial to coastal and offshore
areas (Galloway et al. 2003).
35.2.2 EFFECTS OF NDEPOSITION AND ACIDIFICATION IN
AQUATIC ECOSYSTEMS
Although most of the earlier studies of atmospheric deposition focused on ecosystem effects of sul-
fur (S), attention in North America and Europe has shifted to concerns about effects of atmospheric N
deposition. Atmospheric deposition of S and N from the mid-1980s to the mid-1990s show contrast-
ing temporal patterns in North America (Sirois et al. 2001). While declines of SO
4
in precipitation
were observed, concentrations of NO
3
and NH
4
generally remained constant or increased. These
changes corresponded to decreased emissions of SO
4
and increased emissions of NO
x
over this same
period. As previously N-limited forests became saturated, NO
3
is released to watersheds causing
© 2008 by Taylor & Francis Group, LLC
Clements: “3357_c035” — 2007/11/9 — 12:39 — page 773 — #3
Effects of Global Atmospheric Stressors on Ecosystem Processes 773
eutrophication, acidification and reductions in acid-neutralizing capacity (ANC; defined as the capa-
city of the watershed to withstand strong acid inputs based on the difference between total cations
and total anions). In fact, one of the most consistent indicators of N saturation in ecosystems is
an increase in concentrations of NO
3
in stream water. Detecting these trends in streams requires
access to long-term data that are often unavailable for many watersheds. Much of the research
that describes biogeochemical responses of streams to N deposition has been conducted in Europe
and the northeastern United States. In particular, experimental studies and long-term monitoring
of SO
4
and NO
3
in stream water at Hubbard Brook Experimental Forest documented acidifica-
tion effects on watersheds and significant decreases in base cation concentrations (Likens et al.
1996).
Assuming that ecosystems can only tolerate a certain level of acidification before important
processes become disrupted, defining the threshold point at which the capacity of an ecosystem
to withstand additional inputs is exceeded is an important exercise. The concept of critical soil
acidification load for a watershed is analogous to assimilative capacity in ecotoxicology. The idea
assumes that once the net neutralizing capacity of an ecosystem is reached, additional atmospheric
deposition will result in soil acidification. Critical soil acidification load is determined primarily by
a balance between the weathering of base cations and leaching associated with deposition of SO
4
and NO
x
. Moayeri et al. (2001) developed a model to calculate critical soil acidification loads for a
watershed in Ontario, Canada. Model results showed that soil acidification would occur faster in a
harvested watershed compared to an old-growth watershed.
Even relatively remote areas located away from sources of N can experience effects of N depos-
ition. In general, water quality in alpine and subalpine lakes of the Rocky Mountains is relatively
pristine, with low background concentrations of NO
3
(Williams and Tonnessen 2000). A survey of
44 high-elevation lakes (>3000 m a.s.l.) located on both sides of the continental divide in Color-
ado indicated that higher NO
3
concentration and lower ANC of eastern lakes corresponded with
greater atmospheric N deposition (Baron et al. 2000). Long-term changes in community composi-
tion and productivity of diatoms, as revealed by paleolimnological records of lake sediments, were
consistent with increased eutrophication. These increases in N deposition and shifts in diatom flora
corresponded with increases in urban, agricultural, and industrial development on the Front Range
of Colorado. Williams and Tonnessen (2000) used long-term monitoring data and synoptic surveys
of 91 high-elevation lakes in the central Rocky Mountains to establish critical loads for inorganic
N deposition. Episodic acidification of sensitive headwater catchments in remote Wilderness Areas
has resulted from increased wet deposition of N.
The concept of N saturation, originally developed to describe export of N in forest ecosystems,
may also apply to watersheds. Similar to the acidification effects associated with S emissions,
sensitivity of watersheds to N deposition will be influenced by underlying geology, hydrologic
characteristics, soil type, and vegetation. Alpine and high-elevation watersheds, especially those
located above treeline, may be especially susceptible to N deposition because of their relatively
nonreactive bedrock, short growing season, and limited vegetation (Fenn et al. 1998). Williams et al.
(1996a) reported that N deposition in the catchments of the Colorado Front Range was similar to that
in other well-studied northeastern locations, including Hubbard Brook (New Hampshire) andAcadia
National Park (Maine). A shift in nutrient dynamics from N-limited to N-saturated conditions was
also observed in these high-elevation watersheds as a result of increased anthropogenic N deposition.
Williams et al. (1996a) suggested that N saturation in high-elevation catchments may serve as an
early warning of disruption in N cycling.
Ecosystem responses of oligotrophiclakes to Ndeposition will also dependon nutrient conditions
and the history of NO
3
availability. Nydick et al. (2004) measured effects of NO
3
enrichment in
two alpine lakes with very different background levels of N. Enrichment significantly increased
photosynthetic rate and chlorophyll a in a low N lake, but had no effects on a high N lake. Both NO
3
and PO
4
additions were necessary to increase productivity in the high N lake. Nydick et al. (2004)
also reported that despite relatively little effect on benthic algal biomass, epilithon, surface sediment,
© 2008 by Taylor & Francis Group, LLC
Clements: “3357_c035” — 2007/11/9 — 12:39 — page 774 — #4
774 Ecotoxicology: A Comprehensive Treatment
and subsurface sediment accounted for 57–92% of the NO
3
uptake, indicating the importance of
benthic processes in these lakes.
Ecosystem-level effects of SO
2
and NO
x
deposition on acidification of aquatic ecosystems has
been studied extensively in Europe and North America (Hornung and Reynolds 1995, Likens et al.
1996, Schindler 1988). Much of the research conducted in the Experimental Lakes Area (ELA)
focused on ecosystem processes, especially primary productivity (Schindler 1987, Schindler et al.
1985). Results of these and other studies of acidification showed reduced rates of primary and
secondary production, decomposition, and nutrient cycling. Although the whole lake experimental
studies conducted at Little Rock Lake in northern Wisconsin focused on community responses to
acidification (Gonzalez and Frost 1994), Frost et al. (1999) speculated that loss of sensitive species
and shifts in community composition would diminish the ability of acidified lakes to maintain system
function.
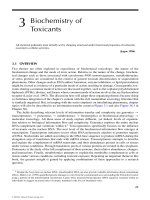
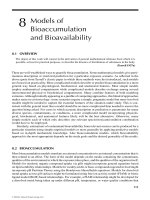
Effects of acidification on organic matter processing have been examined experimentally in
natural and artificial streams. Burton et al. (1985) measured effects of acidification on decom-
position of white birch and sugar maple in experimental stream channels (Figure 35.1). Reduced
decomposition rates in acidified stream channels were attributed to lower density of macroinver-
tebrates, particularly shredder caddisflies and detritivorous isopods. It is interesting to note that
significant effects of acidification were not observed until relatively late in the study (>80 days),
demonstrating the importance of long-term experiments. However, results of long-term experi-
ments do not necessarily demonstrate significant ecological effects. Smock and Gazzera (1996)
Percent dry weight remaining
30
40
50
60
70
80
90
Sugar maple
Time (day)
0 50 100 150 200 250 300
30
40
50
60
70
80
90
100
White birch
FIGURE 35.1 Decomposition rate (as percent dry weight remaining) of sugar maple and white birch in
reference (closed symbols) and acidified (open symbols) stream channels. (Data from Table 2 in Burton et al.
(1985).)
© 2008 by Taylor & Francis Group, LLC
Clements: “3357_c035” — 2007/11/9 — 12:39 — page 775 — #5
Effects of Global Atmospheric Stressors on Ecosystem Processes 775
introduced H
2
SO
4
to a low gradient, blackwater stream in Virginia (USA). Monthly additions over
a 1-year period reduced benthic microbial respiration, but had no effect on processing rates of red
maple leaves or abundance of macroinvertebrates. These results suggest that ecological effects of
acidification on ecosystem processes will likely vary with location. Blackwater streams with nat-
urally high levels of tannins and organic acids that typify this region are relatively insensitive to
acidification.
35.2.3 EFFECTS OF NDEPOSITION AND ACIDIFICATION IN
TERRESTRIAL ECOSYSTEMS
Although negative effects of NO
x
deposition on lakes and streams have been frequently observed,
changes in terrestrial ecosystems, especially forests, have received the most attention. Deposition
rates of N toforest ecosystems range from2 kg N/ha/year inremote reference areas to 40kg N/ha/year
in forests downwind of industrial sources (Aber et al. 1989). A large-scale survey of 68 grassland
ecosystems across Great Britain showed a strong negative relationship between species richness and
N deposition (Stevens et al. 2004). Although this paper focused on changes at the community level,
it served to illustrate the widespread nature of this problem. At the current rate of N deposition in
central Europe (17 kg N/ha/year), these researchers estimated that species richness was reduced by
approximately 23% compared to grassland ecosystems receiving the lowest levels. Similar spatial
gradients in N deposition and ecological effects are also evident in the northeastern United States.
For example, relatively high rates of deposition have been measured in southern New York and
Pennsylvania (12 kg N/ha/year), whereas low rates of deposition are measured in eastern Maine
(<4 kg N/ha/year) (Aber et al. 2003). Although it is well documented that alpine and other high-
elevation ecosystems are at greater risk from N pollution because of higher rates of deposition and
increased sensitivity, other landscape factors that influence N deposition are not well understood.
Direct measurement of wet and dry deposition rates in forest ecosystems is difficult. Weathers et al.
(2000) developed a model to predict the influence of several landscape factors on N deposition in
montane ecosystems. Usingconcentrations of Pb in forest floor soils as an index of N deposition, these
investigators quantified effects of forestedges, elevation, aspect, and vegetation type on N deposition
in montane forests.
Fenn et al. (1998) published a comprehensive review of factors that predispose ecosystems to
N saturation and the general ecosystem responses to N deposition. Because of the intimate linkages
between forests and surrounding watersheds, research describing transport of N in terrestrial ecosys-
tems has important implications for N transport to lakes and streams. For example, export of base
cations, increased acidification, and elevated levels of nitrate and aluminum in streams are likely to
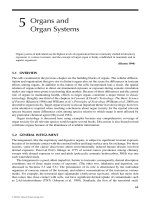
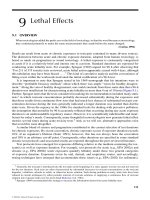
be associated with N deposition in forests. Aber et al. (1989) provided a formal definition of the term
N saturation and developed a hypothesized time course describing responses of forest ecosystems to
N deposition (Figure 35.2). At a critical stage in this sequence of events, forests will likely become
net sources of N rather than sinks. Aber et al. (1989) also described the limited capacity of some
forest ecosystems to assimilate excess N and the potential interactions of N deposition with other
atmospheric stressors such as ozone, sulfate, and heavy metals.
35.2.3.1 The NITREX Project
One of the most comprehensive and spatially extensive experimental assessments of N deposition was
conducted in several coniferous forests in northeastern Europe. The NITREX (nitrogen saturation
experiments) project involved experimental additions of N to sites along a gradient of N pollution
to examine changes in structural and functional characteristics (Emmett et al. 1998). Input rates of
N ranged from 13 to 59 kg/ha/year across sites. Similar to the lotic intersite nitrogen experiment
(LINX) experiments described in Chapter 30, an important objective of the NITREX project was
to compare responses to N addition among sites. Experimental treatments involved both enhanced
© 2008 by Taylor & Francis Group, LLC
Clements: “3357_c035” — 2007/11/9 — 12:39 — page 776 — #6
776 Ecotoxicology: A Comprehensive Treatment
Deposition
begins
Saturation
Decline
NPP
Foliar
biomass
Foliar [N]
Nitrate
assimilation
Relative units
FIGURE 35.2 Predicted time course for changes in NPP, biomass, foliar N concentration, and nitrate (NO
3
)
assimilation in a forest ecosystem in response to chronic deposition of N. (Modified from Figure 1 in Aber et al.
(1989).)
N inputat sites with naturally low atmosphericdeposition and reduced N input (using exclusion roofs
and an ion exchange system) at sites with high deposition. Researchers predicted that N addition in
N-limited forests would have relatively little effect on leaching because of the high capacity for N
retention in these systems. Most of the observed responses to N manipulations were consistent with
expectations, with reductions in N status and NO
3
leaching occurring at sites where N deposition
was reduced and increases occurring at sites where N deposition was enhanced (Gundersen et al.
1998). Shifts in N status and cycling rates following treatments generally supported the N saturation
hypothesis (Aber et al. 1989).
The most consistent responses to enhanced N deposition were changes in water quality, par-
ticularly increased NO
3
. A strong relationship between N leaching and N status suggested that the
distinction between N-limited and N-saturated forests could be quantitatively demonstrated (Gun-
dersen et al. 1998). Nitrate leaching was observed within the first year of the experiments, whereas
biological responses were often delayed. The strong link between N deposition and acidification
was also demonstrated in the NITREX project. N additions caused a decrease in ANC, whereas
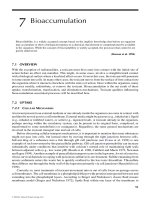
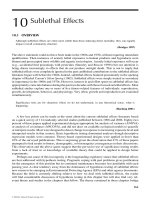
experimental reductions in N caused an increase in ANC (Emmett et al. 1998). Ratios of carbon
to nitrogen (C:N) were also good predictors of the onset of NO
3
leaching (Figure 35.3) because
nitrification rates are stimulated as C:N declines, resulting in a decrease in the retention efficiency
of N (Emmett et al. 1998). These results suggest a simple threshold response of N export. At C:N
greater than 24, only a small proportion of nitrate leaches (approximately 10%); however, as C:N
decreases, a rapid increase in the proportion of NO
3
leached was observed.
Comparison of N dynamics at N-limited and N-saturated sites showed that microbial cycling
of C and N was characterized by low NH
4
transformation and respiration rates at N-limited sites.
Surprisingly, despite a wide range of variation in N deposition rates, N transformation showed relat-
ively little variation. Gross mineralization and immobilization rates of NH
4
were highly correlated
with respiration rates across ecosystems (Figure 35.4), indicating the important linkage between C
and N dynamics and showing that simple measurements of CO
2
in soils could potentially serve as a
measure of N cycling (Tietema 1998).
The potential damaging effects of atmospheric deposition on forest productivity were clearly illus-
trated by the NITREX project. Experimental reduction of N and sulfur inputs to a highly N-saturated
site resulted in a 50% increase in tree growth (Emmett et al. 1998). However, in general, ecosystem
responses to experimental manipulation of N were relatively modest and required longer periods
© 2008 by Taylor & Francis Group, LLC
Clements: “3357_c035” — 2007/11/9 — 12:39 — page 777 — #7
Effects of Global Atmospheric Stressors on Ecosystem Processes 777
C:N ratio of forest floor
15 20 25 30 35
NO
3out
/NO
3in
0
1
2
3
FIGURE 35.3 Relationship between N leaching and carbon:nitrogen (C:N) ratios in the forest floor. Data are
from experimental results of the NITREX project in northwestern Europe. (Modified from Figure 5 in Emmett
et al. (1998).)
Respiration (mg C/kg/day)
100 150 200 250 300 350 400 450
Gross N transformation (mg N/kg/day)
5
10
15
20
25
30
FIGURE 35.4 Relationship between gross N transformation rates and respiration in forests soils from the
NITREX experiment. Solid circles = gross NH
4
mineralization rate; open circles = gross NH
4
immobilization
rate. (Data from Tables 2 and 3 in Tietema (1998).)
of time. Boxman et al. (1998) commented that it was “remarkable that no ecosystem components
have responded with increasing vitality to the high N levels in the initially N limited, oligotrophic
forests.” Mass loss in litter bags also increased along the gradient of N status, but effects of N
manipulation were not significant. Responses of soil fauna to N treatments were generally less than
initial differences among sites along the N gradient. The modest biological responses to N treatments
may have resulted from the relatively short duration of these experiments. Gundersen et al. (1998)
provided estimates of the amount of time required for several chemical and biological responses to
N treatment (Table 35.2). In general, decomposition rates and changes in NPP were relatively slow
processes compared with NO
3
leaching. These results again highlight the importance of conducting
long-term manipulations for assessing ecosystem effects of N deposition.
35.2.3.2 Variation in Responses to N Deposition among
Ecosystems
Responses of forestecosystems toN deposition areoften variable, and factors thatcontrol differences
in N retention and export are not completely understood. As described above, C:N ratios in soil are
© 2008 by Taylor & Francis Group, LLC
Clements: “3357_c035” — 2007/11/9 — 12:39 — page 778 — #8
778 Ecotoxicology: A Comprehensive Treatment
TABLE 35.2
Predicted Timing of Selected Forest Ecosystem
Responses to Changes in Chronic Additions and
Reductions in N Deposition
Pool or Process Response
NO
3
leaching Fast
Net mineralization Intermediate
Decomposition Slow intermediate
Denitrification Slow intermediate
NPP Slow
C:N of forest floor Slow
C:N of mineral soil Very slow
Fast = 1 year; intermediate = 2–4 years; slow ≥ 5 years.
Note: Results are based on experimental manipulations of nitro-
gen from the NITREX project.
Source: From Table 8 in Gundersen et al. (1998).
linked to thecapacity of forestecosystems to retainN, and decreasedC:N may occurunder conditions
of chronic N deposition (Emmett et al. 1998). Surveys of wet deposition in old-growth stands of
Engelmann Spruce showed elevated levels of NO
3
and NH
4
on the eastern side of the continental
divide in Colorado (Baron et al. 2000). Greater N deposition was attributed to agricultural and
atmospheric sources and was reflected in higher rates of mineralization and nitrification. Subsequent
N fertilization experiments conducted in Engelmann Spruce forests on both sides of the continental
divide showed that differences in soil conditions influenced responses to N treatments (Rueth et al.
2003). Mineralization rates were unaffected by N treatment on the western side of the continental
divide but increased by approximately two times on the eastern side.
Experimental studies ofN deposition at theELAin Ontario (Canada) havebeen conducted to con-
trast responses ofdifferent ecosystem components.A2-yearN addition experiment (40 kgN/ha/year)
was conducted in a boreal forest to compare effects in N-limited “forest islands” with naturally N-
saturated lichen outcrops (Lamontagneand Schiff 1999). Responses to N treatments differed between
habitat types. In contrast to forests, N-saturated lichen outcrops were highly sensitive to N depos-
ition. After 2 years of treatment, lichen outcrops no longer retained additional N inputs, whereas the
proportion of N retained in treated and reference forest–islands was similar (Figure 35.5). These data
highlight the role that relatively small habitat patches in a landscape play in controlling ecosystem
processes.
Differences in abundance of dominant species will also complicate our ability to predict ecosys-
tem responses to N deposition in forests. For example, species-specific differences in litter quality
and rates of decomposition influence N cycling and availability. Surveys conducted along a gradi-
ent of atmospheric N deposition in the northeastern United States showed that responses differed
between tree species (Lovett and Rueth 1999). Rates of mineralization and nitrification of soils were
significantly related to N deposition in maple plots but not in beech plots. Thus, while increased
rates of mineralization and nitrification are typical responses to N deposition in forest ecosystems,
the species composition of these forests should be considered when developing predictive models.
Similarly, changes in community composition of forest ecosystems as a result of natural or anthropo-
genic disturbance will affect responses to N deposition. Lovett and Rueth (1999) also demonstrated
that although descriptive studies do not allow researchers to directly infer causality, comparison
of ecosystem responses to chronic N deposition along a gradient can be a useful alternative to
experimental treatments.
© 2008 by Taylor & Francis Group, LLC
Clements: “3357_c035” — 2007/11/9 — 12:39 — page 779 — #9
Effects of Global Atmospheric Stressors on Ecosystem Processes 779
Community type
Bedrock Forest
Retention coefficient
0.0
0.5
1.0
Reference watershed
Treated watershed
FIGURE 35.5 Responses of lichen bedrock communities and forest communities after 2 years of N additions
in the ELA, Ontario, Canada. The figure shows retention coefficients ([Total N Input – Total N Output]/Total
N Input). (Data are from Table 4 in Lamontagne and Schiff (1999).)
35.2.4 ECOSYSTEM RECOVERY FROM NDEPOSITION
Mitigating the effects of N deposition on forest ecosystems will be challenging because of the
widespread distribution of sources and tremendousvariation in ecologicaleffects. However, potential
for recovery is relatively high if N deposition is significantly reduced. Experiments conducted in
The Netherlands and Germany showed rapid improvements in water quality following reductions
in N deposition to a watershed (Emmett et al. 1998). Increased tree growth was also observed at
two of the three sites where N deposition was reduced (Boxman et al. 1998). Soils are a major sink
for excess N in forests, and recent evidence suggests that microbial assimilation of NO
3
may be an
important regulator of N retention. Because major reductions in N emissions are unlikely for some
areas, management options should also include strategies to enhance the incorporation of N into
soils (Fenn et al. 1998).
Recovery of watersheds from the long-term effects of acidification may require many years if
base cations are significantly depleted. Reductions in atmospheric deposition of sulfate as a result
of the Clean Air Act have been associated with significant improvements in stream water chemistry.
However, export of base cations, especially Ca and Mg, from acidified watersheds will likely delay
recovery (Likens et al. 1996). Although the loss of base cations has been attributed primarily to
prolonged exposure to acid rain and a decline in Ca in precipitation, ecological factors also influence
Ca export. Hamburg et al. (2003) measured levels of Ca in the forest floor, abundance of snails
(organisms that require Ca for growth), and Ca export in stream water from hardwood forests of
various ages. Results showed that Ca concentration in snails, litterfall, and the forest floor and
export of Ca in stream water increased with forest age. Calcium mobilization in young stands
(4.6–6.0 g Ca/m/year) was much greater than in old stands (0.4 g Ca/m/year), indicating that forest
aging significantly influenced Ca dynamics.
Recent amendments to the 1990 Clean Air Act in the United States are expected to have signi-
ficant effects on air quality and water chemistry across large broad geographic regions. Assessing
these changes will require integrated studies of physicochemical and biological responses over large
regional areas andfor relatively long periodsof time. Because long-term monitoring dataat a regional
level are generally lacking, researchers are often required to use trends from site-specific results to
infer regionalpatterns. Stoddard et al. (1998) analyzed trends in waterchemistry from 44 Adirondack
and New England (USA) lakes that were sampled from 1982 to 1994. Long-term trends in meas-
ures of acidic deposition (SO
4
and NO
3
concentrations in stream water) and watershed responses
to acidification (ANC and export of base cations) differed between subregions. In particular, ANC
increased overtime in New England lakes but decreased inAdirondack Lakes. These results were not
© 2008 by Taylor & Francis Group, LLC
Clements: “3357_c035” — 2007/11/9 — 12:39 — page 780 — #10
780 Ecotoxicology: A Comprehensive Treatment
expected and indicate that potential for recovery from acid deposition would be considerably less in
the Adirondacks. The most significant finding of this research is that even with long-term data and a
solid mechanistic understanding of physicochemical relationships, predicting regional trends based
on well-defined subpopulations of sentinel lakes is difficult (Stoddard et al. 1998). The challenges of
making accurate regional predictions on the basis of a very well-understood phenomenon highlight
the potential difficulties associated with quantifying effects of poorly defined stressors such as CO
2
and UV-B radiation.
35.3 ULTRAVIOLET RADIATION
to really demonstrate UV-B radiation impacts at the ecosystem level requires establishing a chain of
cause and effect from molecule to ecosystem.
(Bassman 2004)
Ecosystem-level experiments are the only method of detecting UV influences on the myriad of competitive
and trophic interactions present in nature.
(Flint et al. 2003)
35.3.1 AQUATIC ECOSYSTEMS
Effects of UVR on ecosystem processes have been studied extensively, especially in pelagic mar-
ine and lentic systems. As a result of this comprehensive research effort, there exists sufficient
information concerning effects of UVR to develop reasonably detailed ecological risk assessments
for certain groups of organisms and processes (Hansen et al. 2003). Several excellent reviews on
the effects of UVR have been published recently. Day and Neale (2002) have provided the most
comprehensive treatment of UV-B effects in aquatic and terrestrial ecosystems, with an emphasis on
primary producers. One of the most consistent observations in studies of UV-B effects on marine and
freshwater phytoplankton is reduced primary production (Kinzie et al. 1998, Mostajir et al. 1999,
Neale et al. 1998, Smith et al. 1992, Williamson 1995). UV-B causes damage to Photosystem II, and
effects of UVR on primary production and other ecosystem processes can be extensive. Gala and
Giesy (1991) estimated that exposure to UV-B reduced primary production of a natural assemblage
of phytoplankton from Lake Michigan by 25%. Exposure to simulated UV-B reduced photosynthesis
by 40% in Georgian Bay (Furgal and Smith 1997). Remarkably, even short-term exposure to surface
radiation (e.g., 30 min) can be sufficient to inhibit photosynthesis (Marwood et al. 2000).
Because of proximity to the ozone depletion zone and the intense exposure to UVR during the
early australspring (October–November), considerableresearch effort has focused on phytoplankton
in Antarctic waters, where a 50% reduction in ozone has been documented. Smith et al. (1992)
conducted transects in the Antarctic marginal ice zone and reported a 6–12% reduction in primary
production associated with ozone depletion during a 6-week cruise. Assuming that this reduction is
representative of the entire area and integrating results over the austral spring, Smith et al. (1992)
concluded that this change corresponded to an approximately 2% reduction in annual production of
the Southern Ocean. Similar experiments conducted in the Weddell Sea showed that productivity of
marine phytoplankton decreased as a cumulative function of UV exposure, indicating little evidence
of photorepair (Neale et al. 1998). These researchers also documented considerable variation in
sensitivity of primary production among sites, and attributed this variation to UV exposure before
sampling.
35.3.1.1 Methodological Considerations
With respect to experimental methodology, most aquatic investigations involved the removal of
different wavelengths of UVR using various filters, although some have employed experimental
© 2008 by Taylor & Francis Group, LLC
Clements: “3357_c035” — 2007/11/9 — 12:39 — page 781 — #11
Effects of Global Atmospheric Stressors on Ecosystem Processes 781
enhancement of UVR using lamps. In contrast, studies conducted in terrestrial ecosystems have
more commonly employed lamps to enhance UVR. Because of the significantly elevated levels of
UV-B in the Southern Hemisphere, researchers have relied primarily on UV exclusion methodology.
In contrast, experimental designs in the Northern Hemisphere where UV increases are less dramatic
have more commonly employed UV enhancement (Flint et al. 2003). These are important method-
ological distinctions with significant implications for how results are interpreted. UVR exclusion
experiments document effects of current levels of UVR, whereas enhancement experiments attempt
to estimate effects of predicted increases.Advantagesand disadvantages ofthe different experimental
techniques used to enhance or reduce UVR were described in Chapter 26. In particular, there has
been considerable discussion of the artificial wavelength spectra produced by UV lamps. Unreal-
istic combinations of UV-A, UV-B, and photosynthetically active radiation (PAR) may artificially
enhance effects of UV-B (Caldwell and Flint 1997). These problems may be partially addressed by
either calculating biological spectral weighting functions or by using modulated lamp systems that
measure incoming UV-B and adjust lamp outputs accordingly. Comparisons of ecosystem processes
under ambient and UVR-excluded treatments provide important information on effects of current
levels of UVR. However, it may be difficult to extrapolate these results to conditions of enhanced
UVR because it requires that we make predictions beyond those used in the experiments (Behrenfeld
et al. 1995). More importantly, because of the significant influence of PAR on photosynthesis, it is
essential that filtering materials that exclude and transmit UV-B allow the same amount of PAR
(Flint et al. 2003). Because of these issues, some combination of UV exclusion and enhancement
may be necessary to reliably estimate effects of current and increased UVR under conditions of
ozone depletion.
The duration of experiments designed to assess UVR effects on primary production is also an
important consideration. In contrast to research conducted in terrestrial systems, most investigations
of UVR effects in aquatic ecosystems havebeen limited to relatively short-termexperiments. Watkins
et al. (2001) measured effects of UVR on epilithic metabolism, pigment concentrations, nutrients,
and community composition in a boreal lake over a 4-month period. Although chlorophyll a was
not affected, photosynthetic rates were increased by 37–46% and shifts in community composition
were observed when UVR was eliminated. Most of the observed response was a result of exposure
to UV-A. These results strongly support the hypothesis that current levels of UVR penetrating
clear-water lakes have detrimental effects on primary productivity. Because the experiments were
conducted in summer and fall, investigators were able to document seasonal responses to declining
UVR. Although differences among treatments were negligible in fall as a result of lower incident
UVR, differences in taxonomic composition persisted.
35.3.1.2 Factors that Influence UV-B Exposure and Effects in
Aquatic Ecosystems
Responses of marine and freshwater phytoplankton to UVR are complicated by numerous environ-
mental factors, and quantification of effects on ecosystem processes is often challenging (Marwood
et al. 2000). In addition to the elevated UV-B levels in the Southern Ocean, increases in UV-B radi-
ation occur at higher elevations (increasing by approximately 20% for each 1000 m), placing alpine
and subalpine ecosystems at considerable risk (Blumthaler and Ambach 1990, Sommaruga 2001).
Alpine lakes and streams are also more susceptible to UV-B because they often have naturally low
concentrations of light-attenuating dissolved organic material (DOM), which protect communities
from exposure (Vinebrooke and Leavitt 1998). UV-B exposure will also be elevated at low latitudes
and in tropical ecosystems because of the naturally thin layer of ozone and direct angle of exposure
for most of the year (Kinzie et al. 1998). Thus, tropical ecosystems located at higher elevations
would be expected to receive significant UV-B exposure. Kinzie et al. (1998) measured effects of
UV-B on photosynthesis of benthic and planktonic communities in a tropical alpine lake. Net oxy-
gen production of phytoplankton was actually lower in microcosms exposed to UV-B than in the
© 2008 by Taylor & Francis Group, LLC
Clements: “3357_c035” — 2007/11/9 — 12:39 — page 782 — #12
782 Ecotoxicology: A Comprehensive Treatment
dark. Effects of UV-B were greater on phytoplankton than on benthic algal mats, which were likely
protected by UVR-absorbing amino acids.
Habitat features, behavioral characteristics, and morphological adaptations of organisms will
influence exposure and sensitivity to UVR. Microcosm experiments conducted with artificial light to
enhance UV-B showed no effects on phytoplankton, zooplankton, periphyton, or macroinvertebrates
(De Lange et al. 1999). Some species-specific responses were observed, but overall ecosystem char-
acteristics were unaffected. The lack of a response in this system was attributed to UV-B attenuation
resulting from high concentrations of dissolved organic carbon (DOC), which protected organisms
from exposure. Interestingly, bioassays conducted with Daphnia pulex showed higher growth of
organisms fed seston from the control microcosms than organisms consuming seston from UV-
B-treated microcosms. These results suggest the intriguing possibility that energy transfer from
phytoplankton to zooplankton could be affected by UV-B.
Because penetration of UVR through the water column is dependent on water clarity, factors that
influence turbidity, trophic status, and levels of DOM will potentially influence ecosystem responses.
Anthropogenic changes in water clarity, such as those resulting from acidification, climate change, or
exotic species will also influence UVR exposure. Invasion of exotic filter-feeding zebra and quagga
mussels (Dreissena spp.), which remove phytoplankton from the water column, has significantly
increased water clarity and UVR penetration in lakes. Experiments conducted in Lake Erie (USA)
showed that UVR inhibited primary production, but that effects were mediated by N availability
(Hiriart et al. 2002). There are also concerns over the sustainability of planktonic food webs in
Lake Erie as a result of removal of phytoplankton by dreissenid mussels. The stability of these food
webs will be further compromised if UVR affects phytoplankton production.Allen and Smith (2002)
observed that UVR significantly inhibited phosphate uptake capacity in plankton, which may result
in a potential negative feedback by diminishing P availability in this system.
Vertical profiles of primary production showed that relative effects of UV-A and UV-B on pho-
tosynthesis vary with depth and water clarity (Palffy and Voros 2003). As expected, greatest effects
on photosynthesis were observed near the surface, but these effects were primarily attributable to
UV-A (Figure 35.6). A multiple regression model showed that UVR and vertical light attenuation
accounted for 90% of the variation in photoinhibition. Effects of UV-B on ecosystem processes may
be ephemeral and change as a result of alterations in community composition and maturity. Santos
et al. (1997) measured successional changes in tropical marine diatoms exposed to varying UVR
treatments in the field. During initial stages of colonization, primary production was reduced by
>40% when exposed to a full solar spectrum of UV-A+UV-B +PAR. These changes corresponded
to differences in composition of diatoms among treatments. Effects of UVR treatments were reduced
over time, suggesting that diatoms were most sensitive during the initial stages of succession.
Photosynthesis (µg C/L/h)
20 30 40 50 60 70
Depth (m)
−2.5
−2.0
−1.5
−1.0
−0.5
0.0
PAR only
PAR+UV-A
PAR+UV-A+UV-B
FIGURE 35.6 Vertical profile of phytoplankton primary production in the western basin of Lake Balaton
(Central Europe) measured on July 19, 1999. (Data from Table 1 in Palffy and Voros (2003).)
© 2008 by Taylor & Francis Group, LLC
Clements: “3357_c035” — 2007/11/9 — 12:39 — page 783 — #13
Effects of Global Atmospheric Stressors on Ecosystem Processes 783
Photosynthetic rate (µg C/µg Chl a/h)
0.0
0.5
1.0
1.5
Treatment
Quartz
Pyrex (305)
Mylar (323)
Plastic (378)
0
2
4
6
8
Antarctic phytoplankton
Tropical phytoplankton
FIGURE 35.7 Photosynthetic rates (µgC/µg Chl a/h) of Antarctic and tropical phytoplankton when solar
radiation is filtered using quartz, pyrex, mylar, and plastic film. Numbers in parentheses are the wavelengths
(in nanometers) corresponding to 50% transmission for each treatment. (Data from Figure 9 in Helbling et al.
(1992).)
As described previously, documented losses of ozone and subsequent increases in UVR have
been greatest in Antarctic marine ecosystems. Because phytoplankton in these southern oceans have
historically been exposed to relatively low levels of UVR, it is likely that they are especially sensitive
to anthropogenic increases. Helbling et al. (1992) compared effects of UVR on photosynthesis of
tropical and Antarctic phytoplankton populations. Results showed relatively little effects of elim-
inating UVR on tropical phytoplankton but dramatic effects on Antarctic organisms (Figure 35.7).
These researchers also noted that most of these effects were a result of reducing UV-A, whereas
UV-B had relatively minor effects on photosynthesis. In contrast to these findings, Banaszak and
Neale (2001) observed that photosynthesis of phytoplankton from a shallow estuarine environ-
ment was more strongly inhibited by UV-B than UV-A. Biological weighting functions (BWFs)
that quantified effects of different wavelengths on photosynthesis were similar to those derived for
Antarctic systems and showed relatively little seasonal variation, despite considerable variation in
physicochemical characteristics in this ecosystem (Banaszak and Neale 2001).
35.3.1.3 Comparing Direct and Indirect Effects of UVR on
Ecosystem Processes
Because UVR affects both primary producers and consumers, responses to UVR manipulations
observed in field experiments are often a combination of direct and indirect effects. Organisms
© 2008 by Taylor & Francis Group, LLC
Clements: “3357_c035” — 2007/11/9 — 12:39 — page 784 — #14
784 Ecotoxicology: A Comprehensive Treatment
representing different trophic levels will likely show differential sensitivity to UVR. Despite con-
siderable speculation that indirect effects of UVR will be important, relatively few studies have
documented these food web responses. Research by Bothwell et al. (1994) was one of the first
studies to quantify the importance indirect effects on benthic communities. Although accrual rates
of algae were initially inhibited by UVR, changes in abundance of algal consumers (chironomids)
mediated these responses. McNamara and Hill (2000) measured effects of UV-B on photosynthesis
and food resources available to grazers in experimental streams. These researchers observed a dose–
response relationship betweenUV-B irradianceand photosynthesis in both short-(4-h) andlong-term
(13-day) experiments.
Direct or indirect UVR-induced changes in food webs can have important consequences for
aquatic ecosystems. If UV-B inhibits growth and nutrient uptake of primary producers or alters size
and species composition, the quality of food resources for grazers may be affected (Hessen et al.
1997). Tanket al. (2003)measured direct and indirect effects of UVR in four montane lakes of varying
water transparency in Jasper National Park, Alberta (Canada). Results of mesocosm experiments
using filters showed that UVR altered trophic structure and function of benthic communities, but
direct and indirect effects were highly variable among lakes. In contrast to expectations, exposure
to UVR generally did not reduce the quality or quantity of food resources to invertebrates. UVR
exposure decreased species richness and resulted in lowerphotosynthetic pigments in organismsfrom
two clear lakes, but other factors such as nutrient concentration and grazers were more important
than UVR in structuring communities (Tank and Schindler 2004). Indirect effects of UVR on food
webs in a British Columbia (Canada) stream varied among locations, but were generally weak
compared to direct effects (Kelly et al. 2003). This study also failed to show effects of UVR on
food quality. Vinebrooke and Leavitt (1999) manipulated UVR and density of macroinvertebrates
in an oligotrophic alpine lake to test the relative importance of direct and indirect effects of UVR.
Responses of primary producers and consumers varied by species and habitat, with greatest effects
observed on epilithicstanding crop. These researchersspeculated thatdirect effects of UVR would be
more important in extreme environments, such as alpine lakes or other stressed ecosystems, where
abiotic factors regulate ecosystem processes. The hypothesis that UVR will have greater effects
in stressed ecosystems has important implications for understanding potential interactions between
UVR and contaminants and will be considered in Section 35.5.3.
Most studies investigating effects of UVR in marine and lentic ecosystems have focused
on inhibition of photosynthesis. However, a more comprehensive understanding of the potential
ecosystem-level effects of UVR requires that other processes be considered. Mesocosm experiments
using natural assemblages of marine phytoplankton showed that exposure to enhanced UV-B signi-
ficantly affected N transport rates (Mousseau et al. 2000). Research conducted by Behrenfeld et al.
(1995) also documented effects of UV-B on N uptake in natural plankton assemblages collected from
mid-latitudes of the North Pacific Ocean. Results showed that exclusion of UV-B increased uptake of
ammonium and nitrate compared to ambient levels, whereas enhancement of UV-B reduced uptake.
These researchers also established dose–response relationships between N uptake and UV-B dose.
Results of these analyses showed that rates of N uptake were more sensitive to UV-B than C fixation,
suggesting that assessment of effects based exclusively on photosynthesis may underestimate total
UV-B damage to ecosystems (Behrenfeld et al. 1995).
35.3.1.4 Effects of UV-B on Ecosystem Processes in
Benthic Habitats
Effects of UVR in benthic communities have received considerably less attention than planktonic
communities, presumably because these organisms should be protected by overlying water and
because UVR does not penetrate into sedimentary habitats. However, benthic communities occupy-
ing clear, shallow water environments are likely to be exposed to intense levels of UVR. In addition,
Garcia-Pichel and Bebout (1996) reported that UVR penetrated a range of sediment types, with
© 2008 by Taylor & Francis Group, LLC
Clements: “3357_c035” — 2007/11/9 — 12:39 — page 785 — #15
Effects of Global Atmospheric Stressors on Ecosystem Processes 785
relatively low attenuation in sandy quartz sediments where effects on photosynthetic organisms are
likely to be significant. These predictions are consistent with results of experiments measuring UVR
effects on benthic algal and meiofaunal communities. Odmark et al. (1998) exposed microbenthic
communities collected from sandy sediments to several UVR treatments. After 3 weeks of expos-
ure to natural UV-B, carbon fixation rates were significantly reduced as compared to the no UV-B
treatments. These researchers speculated that UV-B would have greater effects on communities
inhabiting sandy sediments compared to sediments with a high silt and clay content. Roux et al.
(2002) observed reduced photosynthesis in microphytobenthic communities (primarily small diat-
oms) from an intertidal mudflat exposed to UV-B; however, these effects were limited to periods of
high solar irradiance. Finally, unlike some planktonic organisms that are able to avoid UVR in the
photic zone, behavioral avoidance in some benthic habitats is limited. Because benthic algae and
diatoms can account for a significant portion of primary production in aquatic ecosystems, exposure
to UVR could have serious consequences for energy flow.
35.3.2 EFFECTS OF UVR IN TERRESTRIAL ECOSYSTEMS
While the major focus of UVR research in aquatic ecosystems has been on primary production,
research in terrestrial ecosystems has documented effects on other ecosystem processes, including
litter decomposition and biogeochemical cycles (Newsham et al. 1997, Pancotto et al. 2003, Zepp
et al. 1995). The consensus ofthese investigations isthat terrestrial ecosystemprocesses are generally
less sensitive to UVR than processes in aquatic ecosystems. Caldwell and Flint (1994) predicted that
the occurrence of UVR effects on plants from most frequent to least frequent was the following:
increased production ofUV-absorbing compounds > reduced growthand morphological changes
reduced photosynthesis.
35.3.2.1 Direct and Indirect Effects on Litter Decomposition
and Primary Production
Effects of UVR on litter decomposition have been described as a result of both direct and indirect
processes. Direct effects on decomposing litter are usually a result of inhibition of microbial, fungal,
and other components of the soil community, which reduces decomposition rates. Because these
effects may be offset by enhanced photodegradation, which enhances decomposition rate, predicting
direct effects of UV-Bon litter decomposition ratesis complex. Indirect effects ofUV-B occur during
growth and senescence of plants and can result in changes in leaf chemistry (e.g., lignin content) or
physical characteristics of leaves. One of the most consistent responses of plants to UV-B exposure is
increased production of protective secondary plant metabolites, including phenolics and flavonoids.
If these changes in leaf chemistry influence feeding habits of other trophic levels or alter plant–
herbivore interactions, there exists the possibility that higher trophic levels will be indirectly affected
by UV-B (Bassman 2004). In most instances these secondary plant compounds serve as deterrents
to herbivory and therefore are likely to mediate trophic responses to UV-B radiation. Although
aquatic ecologists routinely consider implications of cascading trophic interactions, these ideas have
received lessattention from terrestrial ecologists (Bassman 2004), perhaps because top-down control
in terrestrial ecosystems is considered relatively unimportant (Strong 1992). Nonetheless, the often
subtle direct effects of UV-B on terrestrial plants may be less important than the indirect effects on
trophic interactions.
Because effects of UV-B exposure will likely vary among locations, comparisons of plant com-
munities across sites is a valuable approach for understanding factors that determine ecosystem-level
effects. Moody et al. (2001) measured direct effects on litter decomposition of Betula pubescens
exposed to ambient and elevated UV-B at sites in Norway, Sweden, the Netherlands, and Greece.
Although the fungal community was significantly affected by UV-B, differences in mass loss and
chemical composition of litter between treatments were modest. Verhoef et al. (2000) also reported
© 2008 by Taylor & Francis Group, LLC
Clements: “3357_c035” — 2007/11/9 — 12:39 — page 786 — #16
786 Ecotoxicology: A Comprehensive Treatment
that litter decomposition and nutrient fluxes in a grassland ecosystem were not affected by UV-B;
however, abundance of soil decomposers was significantly reduced in both UV-A and UV-B treat-
ments. There is also likely to be a strong seasonal component to UVR effects that will vary among
terrestrial ecosystems. For example, UVR exposure to leaf litter in deciduous forests is likely to be
greatest in early spring when leaf canopies are absent and incident UV-B is high. Newsham et al.
(1997) observed subtle and transient effects of enhanced UV-B on decomposition of oak (Quercus
robur) leaf litter. Lower decomposition in UV-B treatments was associated with increases in C con-
tent of leaves and reduced fungal colonization. However, in a subsequent study of UV-B effects on
decomposition, Newsham et al. (2001) reported that Q. robur saplings exposed to a 30% increase
in UV-B (corresponding to an 18% reduction in ozone) for 2 years showed little change in chemical
composition. These researchers concluded that recent increases in UV-B in the Northern Hemisphere
are unlikely to have significant effects on organic matter pools, nutrient cycling, and decomposi-
tion through alterations in litter quality. Experiments conducted at high latitudes of the Southern
Hemisphere where ozone depletion is greatest showed quite different results. Pancotto et al. (2003)
employed a 2 ×2 factorial experimental design to assess both direct and indirect effects of UV-B on
a native shrub community in Tierra del Fuego National Park (Argentina). Plants were grown under
ambient or reduced UV-B and decomposition rate of litter produced by these plants was measured
under ambient or reduced UV-B. Decomposition rate (mass loss) was significantly (14–34%) lower
under ambient UV-B compared to reduced UV-B treatments. These direct effects were found to be
more important in controlling decomposition rates than indirect effects on litter quality. Pancotto
et al. (2003) speculated that changes in decomposition rates have important implications for other
ecosystem-level processes, including nutrient mineralization and carbon storage, in high latitudes of
the Southern Hemisphere.
Although effects of UV-B on primary production and nutrient cycling have been examined in
terrestrial habitats (Klironomos and Allen 1995, Gehrke 1998, Shi et al. 2004), these processes
have received considerably less attention compared to aquatic ecosystems. Assessing direct effects
on primary productivity is complicated because UVR can either increase or decrease physiological
processes that determine production. For example, growth of Sphagnum in a subarctic bog was
significantly reduced by exposure to UV-B (Gehrke 1998). However, total production was not
affected because photosynthesis was enhanced and dark respiration was reduced. Klironomos and
Allen (1995) exposed sugar maple (Acer saccharum) seedlings to enhanced UV-B and measured
shoot and root biomass. Despite significant shifts in belowground carbon flow and microarthropod
abundance in UV treatments, shoot and root biomass was not affected. Plants inhabiting alpine
ecosystems are naturally exposed to greater levels of UV-B and are therefore expected to possess
repair mechanisms to reduce the damaging effects on photosynthesis. In field experiments, Shi
et al. (2004) exposed alpine plants to enhanced UV-B radiation that simulated a 14% reduction
in ozone depletion. Photosynthesis and respiration were either similar or increased slightly under
moderate UV-B exposure. These researchers speculated that alpine plants are acclimated to UV-B
and that photosynthetic processes are protected by morphological adaptations such as increased leaf
thickness.
Meta-analysis offers a quantitative approach for integrating results of multiple studies to assess
complex relationships among variables. This approach is especially appropriate for assessing ter-
restrial ecosystem responses to UV-B because effects are expected to be relatively subtle and often
indirect. Searles et al. (2001) conducted meta-analysis of 62 papers that investigated effects of UV-B
radiation on the concentration of UV-B-absorbing compounds, growth, morphological variables,
and photosynthetic processes. With the exception of UV-B-absorbing compounds, most variables
showed relatively minor response to UV-B treatments. These researchers concluded that indirect
effects in the form of alterations in herbivory are likely to be the most significant responses of
terrestrial ecosystems to elevated UV-B radiation.
Finally, our understanding of effects of UV-B on terrestrial ecosystems is seriously limited by the
lack of long-term investigations (Aphalo 2003). In the meta-analysis of terrestrial studies described
© 2008 by Taylor & Francis Group, LLC
Clements: “3357_c035” — 2007/11/9 — 12:39 — page 787 — #17
Effects of Global Atmospheric Stressors on Ecosystem Processes 787
above (Searles et al. 2001), over 80% of the studies were conducted for less than 1 year. Long-term
studies are evenless common inaquatic ecosystems wheremanipulation ofUVR is moreproblematic
because of experimental artifacts. Although short-term experiments may help understand underlying
mechanisms, they often provide very different results than those of longer duration. Experiments
conducted inTierra del Fuego represent one of the best examples of long-term UV-B studies (Robson
et al. 2003). These researchers used filters to reduce ambient levels of UV-B in a peatland ecosystem
for six field seasons. It is important to note that 6 years was an insufficient time period to detect
subtle effects of UV-B for several of the responses measured.
35.4 INCREASED CO
2
AND GLOBAL CLIMATE
CHANGE
35.4.1 A
QUATIC ECOSYSTEMS
Despite widespread recognition of the potential ecological effects of global climate change associ-
ated with increased levels of atmospheric CO
2
, research on ecosystem-level responses in aquatic
systems has been lacking. Several excellent reviews describing predicted effects of climate change
on distribution and extirpation of species have been published (Carpenter et al. 1992b, Clark et al.
2001, Firth and Fisher 1992, Grimm 1992, Lodge 2001, Meyer et al. 1999, Smith and Buddemeier
1992); however, relatively few studies have investigated effects on ecosystem processes. A recent
report published by the Pew Center on Global Climate Change (Poff et al. 2002) summarized the
current state of knowledge on effects of climate change on aquatic ecosystems, but contained very
little information on changes in ecosystem function (Table 35.3). It is expected that increased sur-
face water temperatures associated with global climate change will affect ecosystem productivity,
materials transport, nutrient dynamics and decomposition; however, little data have been collected to
support this hypothesis. Increased water temperature will likely increase rates of respiration and pho-
tosynthesis, and the relative magnitude of these increaseswill determine overall effects on ecosystem
metabolism. Asurvey of factors related to lake productivity along a latitudinal gradient showed that
primary production was directly related to watertemperature (Brylinskyand Mann1973). Long-term
records (1970–1990) indicated that increased air temperature and reduced precipitation in northwest-
ern Ontario were most likely responsible for reduced discharge, increased water temperature, greater
light penetration, and reduced concentration of DOC in boreal lakes (Schindler et al. 1996). Because
TABLE 35.3
Major Conclusions of the Pew Center on Global Climate Change Report Regarding Aquatic
Ecosystem Responses to Global Climate Change
• Aquatic and wetland ecosystems are very vulnerable to climate change.
• Increases in water temperature will cause a shift in the thermal suitability of aquatic habitats for resident species.
• Seasonal shifts in stream runoff will have significant negative effects on many aquatic ecosystems.
• Wetland loss in boreal regions of Alaska and Canada is likely to result in additional releases of CO
2
into the atmosphere.
• Coastal wetlands are particularly vulnerable to sea level rise associated with increasing global temperatures.
• Most specific ecosystem responses to climate change cannot be predicted because new combinations of native and nonnative
species will interact in novel situations.
• Increased water temperatures and seasonally reduced streamflows will alter many ecosystem processes with potential direct
societal costs.
• The manner in which humans adapt to a changing climate will greatly influence the future status of inland freshwater and
coastal wetland ecosystems.
Source: Poff et al. (2002).
© 2008 by Taylor & Francis Group, LLC
Clements: “3357_c035” — 2007/11/9 — 12:39 — page 788 — #18
788 Ecotoxicology: A Comprehensive Treatment
of cascading trophic-level interactions in many lake ecosystems, alterations of one trophic level will
likely have consequences for both upper and lower trophic levels. Results of microcosm experiments
with aquatic microbes showed that warming increased primary production and decomposition by both
direct effects on temperature-dependent physiological processes and indirect effects on trophic struc-
ture. Finally, climate-inducedalterations in thecomposition of riparian canopiesmay have significant
effects on the quality and quantity of allochthonous detritus delivered to lakes and streams.
35.4.1.1 Linking Model Results with Monitoring Studies in
Aquatic Ecosystems
Much of the research in lakes and streams documenting potential effects of climate change has been
limited to hydrologic models that predict modifications in discharge resulting from altered precip-
itation patterns. Alterations in the flow regime of aquatic ecosystems are likely to be significant,
especially in western U.S. watersheds where modest changes in precipitation are expected to res-
ult in dramatic reductions in stream runoff (Carpenter et al. 1992a). Long-term records of stream
discharge are available for many watersheds (e.g., U.S. Geological Survey); therefore, predictive
models that relate regional changes in climate to altered flow regimes within a watershed can be
developed. Associating local weather patterns and stream discharge over the past several decades
may also provide useful insights into potential trends associated with global climate change. How-
ever, extrapolation from global and regional models to local conditions may not be appropriate for
some areas. For example, general circulation models (GCMs) for the Rocky Mountains predict that
temperature should increase under a two times CO
2
scenario. However, long-term monitoring in
this region showed a decline in mean annual temperature and an increase in precipitation (Williams
et al. 1996b), demonstrating that climate in alpine areas may be controlled more by local conditions
than by regional trends.
The oceans have long been recognized as an important sink for excess CO
2
released to the
atmosphere. Recent evidence indicates that approximately 48% of the anthropogenic C released
between 1800 and 1994was sequestered byoceans and that, without this oceanic uptake, atmospheric
CO
2
levels would be about 55 ppm greater than current levels (Sabine et al. 2004). These authors
also suggest that the strength of the oceans as a sink for atmospheric CO
2
has diminished and that
the fraction of CO
2
currently stored in the oceans is approximately one-third of the total potential
storage. Relatively complex feedback mechanisms will determine the effects of increased CO
2
and
global temperatures on oceanic ecosystems. Using results of long-term (1958–2002) surveys of
marine phytoplankton in the Northeast Atlantic Ocean, Richardson and Schoeman (2004) associated
increased sea surface temperatures with increased primary production in cooler areas and decreased
production in warmer areas. Changes in primary production were also related to production of
grazers, which propagated to other trophic levels. The effects of changes in primary production on
global carbon flux are difficult to predict because other factors, especially nutrient availability, will
determine CO
2
uptake. In one of the more ambitious attempts to understand the relationship among
nutrients, primary production, and CO
2
flux, Coale et al. (2004) performed multiple iron injection
experiments in large areas (15 km
2
) of the Southern Ocean. Rates of photosynthesis increased
from 0.29 to 6.9 mmol C/m
3
/day and nitrate concentrations decreased by approximately 2 µM
following treatment, indicating that iron may play an important role in controlling CO
2
uptake in this
region.
Unlike research in marine ecosystems, the role of freshwater ecosystems as a source or sink
for atmospheric carbon has received little attention. Community metabolism varies greatly among
aquatic ecosystems, with the highest productivity observed in marshes (Figure 35.8). Although it
is generally assumed that freshwater ecosystems export CO
2
to the atmosphere, the importance of
aquatic biota as sources or sinks depend on overall ecosystem productivity (Duarte and Agusti 1998).
Factors such as nutrient enrichment and trophic structure also regulate primary production and CO
2
flux in freshwater ecosystems. Wholeecosystem experiments conducted inWisconsin(USA) showed
© 2008 by Taylor & Francis Group, LLC
Clements: “3357_c035” — 2007/11/9 — 12:39 — page 789 — #19
Effects of Global Atmospheric Stressors on Ecosystem Processes 789
System
Lakes
Rivers
Coastal
Marshes
Open Ocean
Production or respiration (g O
2
/m
3
/day)
0
2
4
6
8
Production
Respiration
FIGURE 35.8 Median gross primary productionand respiration of freshwater and marineecosystems. Results
were compiled from five decades of studies that reported O
2
evolution as a surrogate for carbon flux. (Data
from Table 1 in Duarte and Agusti (1998).)
that shifts in top predators in experimentally enriched lakes regulated the flow of C and determined
if a lake was a sink or source of CO
2
(Schindler et al. 1997).
The relative lack of information concerning potential effects of climate change on primary pro-
duction, nutrient cycling, decomposition, and other processes in aquatic ecosystems is surprising
and in sharp contrast to tremendous research efforts currently underway in terrestrial habitats.
Considerably more research effort is necessary to understand responses of aquatic ecosystems
to elevated CO
2
and associated climate change. Climate-induced changes in water temperat-
ure, hydrology, and physicochemical characteristics in aquatic ecosystems are likely to influence
contaminant transport, bioavailability, uptake, and toxicity. Aquatic ecotoxicologists need to
develop a better appreciation for how these processes will be affected in a warmer, CO
2
-enriched
world.
35.4.2 TERRESTRIAL ECOSYSTEMS
In contrast to the relatively limited research on effects of climate change in freshwater ecosystems,
studies conducted in terrestrial ecosystems have been extensive. These studies have considered sev-
eral facets of the CO
2
problem (Figure 35.9): direct influences of CO
2
enrichment and indirect
effects of increased temperature (Körner 2000) and shifts in terrestrial vegetation (Wolters et al.
2000). Much of this research has focused on assessing the role of forests, grasslands, and other
ecosystems in C sequestration, a problem that requires a better understanding of the complex rela-
tionship between CO
2
and C storage and the role of soil nutrients, especially N, in regulating storage.
Quantifying global C sequestration is a difficult problem because of variation among ecosystems and
because of complex feedback processes. For example, boreal peatlands occupy only about 2% of the
earth’s surface but sequester about 33% of the global soil C. Increased soil temperature associated
with climate change could result in positive feedback by increasing decomposition rate of peatlands
thereby releasing large quantities of stored C to the atmosphere. Alternatively, warmer temperatures
could cause negative feedback by enhancing productivity and C storage in these areas. Storage of
C in terrestrial ecosystems will be largely dependent on the rate of turnover within C pools and the
availability of N. Carbon allocated to pools with relatively fast turnover such as leaves and roots
will likely result in little long-term storage. In contrast, C allocated to pools with slow turnover will
result in a large increase in soil C (Allen et al. 2000). Finally, if elevated CO
2
significantly increases
© 2008 by Taylor & Francis Group, LLC
Clements: “3357_c035” — 2007/11/9 — 12:39 — page 790 — #20
790 Ecotoxicology: A Comprehensive Treatment
Enrichment of
atmospheric CO
2
Combustion of fossil fuels and
land use changes
Effect on plants
and soils
CO
2
fertilization
Effects on the
climate system
Enhanced
greenhouse
effect
Indirect effects
Direct effects
Direct effects
FIGURE 35.9 The two potential aspects of increased CO
2
on terrestrial ecosystems. Increased CO
2
directly
stimulates photosynthesis and may alter NPP. Direct effects on the global climate system include changes in
atmospheric temperatures and patterns of precipitation. These climatic changes will likely have indirect effects
on terrestrial vegetation. (Modified from Figure 2 in Körner (2000).)
soil respiration or decreases decomposition by changing litter quality (e.g., altering C:N ratios), any
excess C removed by stimulation of NPP may be returned to the atmosphere.
Three general approaches have been employed to predict how terrestrial ecosystems will respond
to increased CO
2
and associated warmer temperatures: modeling, monitoring, and experimentation.
In the sectionbelow, we will briefly discussimportant findings using thesethree approaches aswell as
their strengths and limitations.
35.4.2.1 Simulation Models
Because of limitations associated with conducting experiments at appropriate spatial or temporal
scales (Chapter 26), computer modeling has played a prominent role in predicting effects of climate
change on terrestrial ecosystems. These models have attempted to quantify how various ecosys-
tem processes, especially photosynthesis and production, will respond to global increases in CO
2
.
The most realistic simulation models integrate biogeographic analyses showing forest redistribution
under various climate change scenarios with biogeochemistry models that simulate movement of C,
nutrients, and water. Aber et al. (2001) reviewed contemporary models developed to predict these
changes in forest ecosystems, with an emphasis on interactions among potential stressors. One of the
most consistent findings of these models was increased NPP in response to elevated CO
2
. However,
there was considerable uncertainty regarding the sustainability of increased NPP because of limita-
tions imposed by other factors, especially nutrients. Because increased NPP and C storage in forest
ecosystems will largely be determined by N availability, greater anthropogenic N deposition has the
potential to enhance C sequestration (Rastetter et al. 1997). Much of the spatial variation among
ecosystem responses to CO
2
enrichment is partially a result of N cycling and the rates of move-
ment between organic and inorganic pools. Simulation modeling predicts that short-term responses
to increased CO
2
are quite different from long-term responses and are characterized by at least
four different time scales (Rastetter et al. 1997): (1) instantaneous physiological responses include
greater NPP because photosynthesis is stimulated by CO
2
; (2) acclimation occurs over a period of
several years as uptake of N from soils is increased; (3) over a time scale of decades, increased
© 2008 by Taylor & Francis Group, LLC
Clements: “3357_c035” — 2007/11/9 — 12:39 — page 791 — #21
Effects of Global Atmospheric Stressors on Ecosystem Processes 791
C and N in vegetation results in greater litter production and accumulation of soil organic matter;
(4) over a time period of centuries, the most important response is increased ecosystem-level N
and the increased organic matter in vegetation and soils. These different temporal responses also
influence the sequestration of C in vegetation and soils. Carbon is initially stored in vegetation as
ratios of C:N increase. At intermediate (10–100 years) and longer time scales, C storage will be
driven by movement of N from soil to vegetation and by increases in total ecosystem N, respectively
(Rastetter et al. 1997).
Much of the simulation modeling conducted to assess ecosystem responses to increased CO
2
has addressed C sequestration in terrestrial habitats. As described above, approximately 50% of
the CO
2
released into the environment over the past 20 years has remained in the atmosphere. The
remaining proportion has been sequestered in either oceanic or terrestrial ecosystems. Significant
annual variation in the amount of CO
2
in the atmosphere has also been observed during this period.
However, because fossil fuel emissions show little annual variation, changes in atmospheric CO
2
most likely reflect annual variation in the CO
2
flux to oceans and continents (Bousquet et al. 2000).
Improved understanding of C storage in terrestrial ecosystems has helped identify the terrestrial
biosphere as a “missing sink” for anthropogenic CO
2
that previously could not be accounted for
in global models. The importance of identifying this sink is obvious because it explains why CO
2
levels in the atmosphere have not increased as much as expected on the basis of known anthropogenic
releases.
Despite significant progress, there remains considerable variation among the different models
used to predict changes in C storage in the continental United States (Aber et al. 2001). As part of the
Vegetation Ecosystem Modeling and Analysis Project (VEMAP), Schimel et al. (2000) integrated
historical climate information with three different ecosystem models to predict spatial and temporal
variation in C storage in the United States for the period 1895–1993. Results showed that C storage
was evenly distributed among different biomes in the United States (100–150 kg/ha), but there
was considerable annual variation (<0.1 Pg C efflux to >0.2 Pg C uptake). Because of this high
annual variability, any 2- to 3-year period would be insufficient to assess potential C storage, thus
highlighting the need for long-term assessments (Schimel et al. 2000). These researchers also note
that effects of forest management and agricultural abandonment are similar to effects of climate
and CO
2
on C storage. Again, there is considerable uncertainty with respect to the role of limiting
factors such as N and water availability on C storage in terrestrial ecosystems. However, estimates
of C balance by various models are relatively consistent and predict that the capacity of terrestrial
ecosystems to store C over the next century will decline as a result of continued increases in CO
2
emissions (Prentice et al. 2000).
In addition to understanding effects of CO
2
enrichment on C sequestration and ecosystem pro-
cesses, simulation models have predicted effects of increased temperature and precipitation on C
balance. Dramatic changes in the distribution of vegetation types, including the extirpation of alpine
habitats, spruce-fir forests, aspen-birch forests, and sagebrush in the United States are likely to occur
as a result of temperature increases (Hansen and Dale 2001, Iverson and Prasad 2001, Shafer et al.
2001). These shifts in vegetation types are likely to have significant effects on C storage. Bachelet
et al. (2001) used equilibrium and dynamic models to show that moderate increases in temperature
resulted in increased vegetation density and C storage. Esser (1992) compared modeled responses of
grasslands and coniferous forests to increased temperature (3.5
◦
C) and a 10% increase in precipita-
tion. Relativechanges in NPPin response towarming were greatest intemperature-limited grasslands
and coniferous forestsat low latitudes. Because ofgreater NPP, annual storagewill be moreimportant
in grasslands; however, because of their greater biomass and broader spatial distribution, disruptions
to coniferous forests will have the greatest effects on global C cycles (Esser 1992).
Results of simulation models are most convincing when they are validated using monitoring or
experimental results and applied to other ecosystems. These reality checks on model predictions are
powerful tools for enhancingour understanding ofcomplex responses to climatechange and potential
interactions with otherstressors (see Section35.5). Mechanisticmodels are especiallyappropriate for
© 2008 by Taylor & Francis Group, LLC
Clements: “3357_c035” — 2007/11/9 — 12:39 — page 792 — #22
792 Ecotoxicology: A Comprehensive Treatment
scaling between levels of organization (e.g., relating physiological responses of individual leaves to
C storage in whole ecosystems). Williams et al. (1997) developed a fine-scale model for a temperate
deciduous forest and then applied this model to predict gross primary production (GPP) for Alaskan
tundra and several forest types in Oregon. Results showed excellent agreement between modeled
and measured GPP in both systems (r
2
= .76 in Alaska; r
2
= .97 in Oregon). Luo et al. (2001)
validated modeling results designed to predict effects of elevated CO
2
on GPP with measurements
of photosynthesis and C flux at the Duke Free Air CO
2
Enrichment (FACE) experimental site.
Again, modeled and measured values for photosynthesis and canopy C flux were in good agreement
(r
2
= 0.80–0.85).
35.4.2.2 Monitoring Studies
We cannot predict with certainty, through direct experimentation, what the responses of forests to global
change will be becausewe cannot carry out themultisite, multifactorialexperiments required for doing so.
(Aber et al. 2001)
The ecological effects of global climate change are too complex to be comprehensively addressed by
experimental approaches, at least in the short term.
(Ringold and Groffman 1997)
Studies monitoring changes in temperature and CO
2
concentrations from regional to global scales
have provided useful information regarding effects of climate change on NPP and C sequestration.
Paleoclimate data have been linked with geochemical and climate models to show that long-term
variation in CO
2
strongly influences global temperatures (Crowley and Berner 2001). Because of the
unprecedented rate of change in CO
2
and global temperatures in the past several decades, it is now
possible to relate NPP to climatic changes over a much shorter time scale. Tree ring chronologies
have correlated increased growth with increases in CO
2
levels observed over the past 100 years in
several ecosystems (Graybill and Idso 1993, Nicolussi et al. 1995). Braswell et al. (1997) measured
CO
2
, temperature anomalies, and vegetation to examine the response of vegetation to temperature
variability at a global scale. Correlations among vegetation growth, temperature, and CO
2
were
lagged, suggesting that responses are regulated by biogeochemical feedbacks. Patterns observed
at a global scale were found to be a composite of individualistic responses among biomes, and
changes in the distribution of these systems could have important consequences for C sequestration
(Braswell et al. 1997). NPPhas increased by >6% globally in the period from 1982 to 1999 (Nemani
et al. 2003), but the magnitude and mechanisms explaining these increases differ among regions. The
greatest increase in NPPwasobserved in tropical ecosystems, withAmazonianrain forests accounting
for 42% of the global increase. Increased NPP observed in mid-latitudes and high latitudes were
attributed to climate, CO
2
enrichment, N fertilization, and forest regrowth, whereas increases in
the tropics were primarily a result of increased CO
2
(Nemani et al. 2003). The disproportionate
increase in NPP for tropical forests highlights the role that these systems play in the global C
budget. The importance of terrestrial ecosystems, especially tropical forests, as a sink for excess C
is well established (Phillips et al. 1998). Grace et al. (1995) measured CO
2
flux in an undisturbed
tropical rain forest in Brazil and concluded that this system was a net sink for CO
2
. Using data from
permanent plots of >600,000 individual trees, Phillips et al. (1998) reported that biomass of tropical
forests increased by 0.71 t/ha/year between 1975 and 1996. This increased biomass was likely a
response to greater atmospheric CO
2
and nutrient deposition and may account for approximately
40% of the “missing” terrestrial C.Although the sequestration of C by tropical forests may reduce the
impact of increasing CO
2
on global climate, there is an upper limit to the amount of C that tropical
forests can remove from the atmosphere (Phillips et al. 1998).
While much attention has been placed on the role that forest ecosystems play in C storage, other
terrestrial ecosystems are also capable of removing significant amounts of C from the atmosphere.
© 2008 by Taylor & Francis Group, LLC
Clements: “3357_c035” — 2007/11/9 — 12:39 — page 793 — #23
Effects of Global Atmospheric Stressors on Ecosystem Processes 793
For example, wet tundra ecosystems retain large stocks of C that have been stored for long periods
of time. These permafrost-dominated ecosystems are highly sensitive to global climate change and
modest increases in soil temperatures could return significant amounts of C to the atmosphere.
Oechel et al. (1995) compared ecosystem GPP and whole ecosystem respiration measured in 1971
with measurements 20 years later. Results showed dramatic changes in C storage during this period.
Wet meadow ecosystems stored approximately 25 g C/m
2
/year in 1971 but released 1.3 g C/m
2
/year
two decades later. Oechel et al. (1995) speculated that this shift from a strong C sink to a slight
C source in tundra ecosystems was related to increased surface temperatures and drying in the upper
soil layers.
35.4.2.3 Experimental Manipulations of CO
2
and Temperature
Manipulating concentrations of CO
2
or temperature to assess effects of climate change on processes
in terrestrial ecosystems is challenging. In fact, because of the limited spatiotemporal scale and
difficulty conducting multifactor manipulations, some researchers question the usefulness of these
experimental approaches (Aber et al. 2001, Luo and Reynolds 1999, Ringold and Groffman 1997).
Much of what we know about the direct physiological effect of CO
2
enrichment on forests is based
on relatively small-scale experiments conducted with isolated seedlings or saplings. Our ability to
link these responses of individual plants measured in a greenhouse to whole ecosystem processes is
questionable. In addition, the relationship between effects of step increases in CO
2
versus gradual
changes that occur in nature requires careful consideration (Luo and Reynolds 1999). However, as
described in Chapters 23 and 32, we feel that experimental manipulations remain one of the most
effective approaches for establishing cause-and-effect relationships between stressors and responses.
Observed positive correlations between NPP and CO
2
based on monitoring studies cannot separate
the effects of other factors such as increased N deposition or precipitation. Because of the time scales
and complexity of potential interactions among climate warming, CO
2
, and other related stressors, it
is essential that modelers and experimental ecologists collaborate to study effects of climate change
on ecosystem processes (Luo et al. 2004). Several large-scale experimental programs have been
established to quantify direct effects of elevated CO
2
on NPP and other ecosystem processes in
grasslands and forests. We will highlight findings of these programs in this section. Smaller-scale
studies have been conducted using individual species to identify mechanisms and to investigate
stressor interactions.
Experimental approaches to measure effects of increased CO
2
in terrestrial ecosystems include
closed-controlled containers, open-top chambers, FACE, and natural experiments (Körner 2000).
Hattenschwiler et al. (1997) compared production of trees grown adjacent to a naturally elev-
ated CO
2
source (a freshwater spring) to production of trees grown at sites with ambient CO
2
.
Results showed that growth was 12% greater at the CO
2
-enriched sites, but this difference did
not persist with older trees. The decline in CO
2
stimulation for older trees has important implica-
tions for predicting C sequestration because many CO
2
enrichment experiments are conducted with
seedlings or saplings. Using open-top chambers, Zak et al. (2000) measured effects of enhanced
CO
2
on microbial community composition and N cycling. Despite increases in fine-root produc-
tion, elevated CO
2
had no effect on microbial biomass or N cycling because the elevated C was
not sufficient to affect the large natural pools of soil organic matter. After 2 years of exposure,
enhanced CO
2
increased net CO
2
assimilation rate of aspen (Populus tremuloides) grown under
low or high N levels, with little evidence of photosynthetic acclimation (Figure 35.10) (Curtis
et al. 2000). However, after the third year, plants grown under elevated CO
2
in low N con-
ditions showed reduced photosynthetic activity. Dukes and Hungate (2002) reviewed results of
experiments conducted using open-top chambers to assess effects of CO
2
on decomposition in
grassland ecosystems. The direct effects of elevated CO
2
on litter quality and decomposition were
relatively modest. However, these researchers speculated that because decomposition rates vary
© 2008 by Taylor & Francis Group, LLC
Clements: “3357_c035” — 2007/11/9 — 12:39 — page 794 — #24
794 Ecotoxicology: A Comprehensive Treatment
Treatment
Low N (1995)
High N (1995)
Low N (1996)
High N (1996)
Net CO
2
assimilation
0
10
20
30
40
Ambient CO
2
Elevated CO
2
FIGURE 35.10 Effects of elevated CO
2
on net assimilation in aspen (P. tremuloides) grown under conditions
of low and high N. (Data from Table 2 in Curtis et al. (2000).)
greatly among species, CO
2
-induced changes in community composition may alter ecosystem-level
decomposition rate.
Research findings from the FACE studies conducted in a loblolly pine (Pinus taeda) plantation
in North Carolina, a sweetgum (Liquidambar styraciflua) monoculture in Tennessee, and a mixed
deciduous forest in Wisconsin (USA) provide the most comprehensive experimental evidence show-
ing a relationship between CO
2
and ecosystem processes in forests (DeLucia et al. 1999, Norby et al.
2002, Zak et al. 2003). Increases in NPP in response to experimentally elevated CO
2
at approxim-
ately 1.5 times ambient levels (537–560 µL/L) ranged from 21% in the sweetgum forest to 25% in
the loblolly pine forest. Despite a significant increase in NPP, the long-term potential of temperate
forests to remain a sink for excess C is limited. For example, most of the increased C sequestered in
the sweetgum forests was allocated to leaves and roots, compartments with relatively fast turnover
(Norby et al. 2002).
Because soil N pools and rates of mineralization are closely related to C flux, quantifying the
effects of CO
2
on these belowground processes is of critical importance for predicting C storage
in terrestrial ecosystems. Interactions between plants and soil microbial communities will largely
determine C sequestration, but the precise role of N availability in this process is controversial
(Luo et al. 2004). Experimental studies have consistently shown that elevated CO
2
enhances NPP,
but the sustainability of these increases will largely be determined by belowground processes that
influence N turnover and availability. Under increased levels of CO
2
, N availability in soils may
either decrease as a result of lower rates of litter decomposition or increase as a result of increased
C substrate. If greater amounts of C enter the soil as a result of CO
2
enrichment, microbial uptake
of nutrients may be enhanced and availability to plants may be diminished. CO
2
enrichment will
result in increased demand for N to support greater plant productivity and the greater storage of
N in long-lived plant biomass or soil organic matter pools (Luo et al. 2004). Finally, the potential
long-term effects of N limitation may be offset if N is supplied from other sources, such as increased
atmospheric deposition. Zak et al. (2003) addressed uncertainties associated with these belowground
processes using results from the three FACE studies described above. Because researchers in each
experiment used similar techniques, this study represents the first comprehensive evaluation of soil
responses to elevated CO
2
in different forest types. Although elevated CO
2
increased plant and litter
production in all experiments, there was no evidence of effects on N availability or transformation
in soils. Zak et al. (2003) speculated that because of relatively large pools of organic matter and
© 2008 by Taylor & Francis Group, LLC
Clements: “3357_c035” — 2007/11/9 — 12:39 — page 795 — #25
Effects of Global Atmospheric Stressors on Ecosystem Processes 795
N naturally present in soils, increases in plant and litter production associated with elevated CO
2
were not sufficient to affect N cycling.
Experiments to measure terrestrial ecosystem responses to warming have been conducted in a
variety of habitats, but for logistical reasons most research has been restricted to low vegetation such
as grasslands, alpine meadows, and peatlands (Price and Waser 2000, Shaw and Harte 2001, Shaw
et al. 2002, Updegraff et al. 2001). Subalpine vegetation in the Rocky Mountains showed relatively
little response to warming over a 4-year period (Price and Waser 2000). These researchers speculated
that despite earlier snowmelt in treated plots, drying soils limited photosynthesis and microbial
activity. Soil warming in a subalpine meadow had relatively little effect on litter decomposition,
but indirect effects on litter quality were observed in heated treatments (Shaw and Harte 2001).
Results of a decade-long soil warming experiment in a mid-latitude hardwood forest showed that
warming enhanced CO
2
flux and N mineralization rates, but effects diminished over time (Melillo
et al. 2002). Experiments conducted in northern peatlands compared responses of a sedge fen and a
Sphagnum bog to warming (Updegraff et al. 2001). Ecosystem respiration was closely related to soil
temperature but showed little difference between community types. These researchers concluded
that the flux of CO
2
from peatlands will increase exponentially with climate warming.
Separating effects of CO
2
enrichment, warming, and other changes in climate on ecosystem
processes is a difficult undertaking. For example, elevated CO
2
and increases in soil moisture will
likely increase C storage in forest ecosystems, whereas lower soil moisture and greater respiration
will likely reduce storage (Melillo et al. 2002). Experimental manipulation of both CO
2
and temper-
ature has been conducted under controlled conditions in single species and mesocosm studies such
as the Ecotron facility (Lawton 1996), but larger-scale experiments conducted at the ecosystem level
are uncommon (Shaw et al. 2002, Wright 1998). Because responses to increased CO
2
will likely
occur simultaneously with changes in temperature, precipitation, and other environmental factors,
multifactorial manipulations are essential for predicting realistic responses. The CLIMEX (climate
change experiment) project in Norway is one of the more ambitious ecosystem manipulations of
CO
2
and temperature (van Breemen et al. 1998, Wright 1998). Researchers enclosed a forested
headwater catchment in an 860 m
2
greenhouse and measured a variety of ecosystem responses.
There were no changes in decomposition rates or photosynthesis of dominant species as a result
of increased temperature or CO
2
. However, experimentally elevated soil temperatures increased N
mineralization and resulted in greater N export in the catchment. The possibility that climate change
could exacerbate N pollution and acidification in these areas is a serious concern that deserves addi-
tional attention (Wright 1998). Shaw et al. (2002) measured individual and combined effects of CO
2
enrichment, warming, precipitation, and N deposition on NPP in a California grassland. In contrast
to many greenhouse experiments and ecosystem studies, increased CO
2
did not stimulate NPP. More
importantly, responses to individual factors were quite different from responses to combinations of
factors. Theseresults should send a strong messageto researchers and funding agencies regardingthe
importance of multifactorial experiments for understanding how ecosystems will respond to global
environmental changes.
Alterations in the composition of terrestrial communities under conditions of increased CO
2
levels and warmer temperatures were discussed in Chapter 26. These changes in the structure of
vegetation are also likely to affect ecosystem processes by modifying terrestrial food webs. Changes
in the chemical composition of plants exposed to elevated CO
2
, including increases in nonstructural
carbohydrates, secondary compounds, and C:N ratios, are among the most consistent responses
observed in terrestrial studies (Körner 2000). Effects of CO
2
-induced changes in food quality have
important implications for food webs and energy flow. In a comparative study of three grasslands,
Wilsey et al. (1997) measured effects of elevated CO
2
and simulated ungulate grazing on pro-
ductivity of plants collected from Yellowstone National Park (USA), Flooding Pampa of Buenos
Aires (Argentina), and the Serengeti Ecosystem (Tanzania). Increased productivity in response
to CO
2
treatment was observed only in Yellowstone National Park. These results were expected
because Yellowstone species were dominated by C3 plants that are more susceptible to increased
© 2008 by Taylor & Francis Group, LLC