báo cáo sinh học:" Health worker densities and immunization coverage in Turkey: a panel data analysis" ppt
Bạn đang xem bản rút gọn của tài liệu. Xem và tải ngay bản đầy đủ của tài liệu tại đây (270.79 KB, 16 trang )
BioMed Central
Page 1 of 16
(page number not for citation purposes)
Human Resources for Health
Open Access
Research
Health worker densities and immunization coverage in Turkey: a
panel data analysis
Andrew D Mitchell*
1
, Thomas J Bossert
1
, Winnie Yip
2
and
Salih Mollahaliloglu
1,3
Address:
1
Harvard School of Public Health, Boston, Massachusetts, USA,
2
University of Oxford, Oxford, United Kingdom of Great Britain and
Northern Ireland and
3
School of Public Health, Ministry of Health, Ankara, Turkey
Email: Andrew D Mitchell* - ; Thomas J Bossert - ;
Winnie Yip - ; Salih Mollahaliloglu -
* Corresponding author
Abstract
Background: Increased immunization coverage is an important step towards fulfilling the Millennium Development Goal
of reducing childhood mortality. Recent cross-sectional and cross-national research has indicated that physician, nurse
and midwife densities may positively influence immunization coverage. However, little is known about relationships
between densities of human resources for health (HRH) and vaccination coverage within developing countries and over
time. The present study examines HRH densities and coverage of the Expanded Programme on Immunization (EPI) in
Turkey during the period 2000 to 2006.
Methods: The study is based on provincial-level data on HRH densities, vaccination coverage and provincial
socioeconomic and demographic characteristics published by the Turkish government. Panel data regression
methodologies (random and fixed effects models) are used to analyse the data.
Results: Three main findings emerge: (1) combined physician, nurse/midwife and health officer density is significantly
associated with vaccination rates – independent of provincial female illiteracy, GDP per capita and land area – although
the association was initially positive and turned negative over time; (2) HRH-vaccination rate relationships differ by cadre
of health worker, with physician and health officers exhibiting significant relationships that mirror those for aggregate
density, while nurse/midwife densities are not consistently significant; (3) HRH densities bear stronger relationships with
vaccination coverage among more rural provinces, compared to those with higher population densities.
Conclusion: We find evidence of relationships between HRH densities and vaccination rates even at Turkey's relatively
elevated levels of each. At the same time, variations in results between different empirical models suggest that this
relationship is complex, affected by other factors that occurred during the study period, and warrants further
investigation to verify our findings. We hypothesize that the introduction of certain health-sector policies governing
terms of HRH employment affected incentives to provide vaccinations and therefore relationships between HRH
densities and vaccination rates. National-level changes experienced during the study period – such as a severe financial
crisis – may also have affected and/or been associated with the HRH-vaccination rate link. While our findings therefore
suggest that the size of a health workforce may be associated with service provision at a relatively elevated level of
development, they also indicate that focusing on per capita levels of HRH may be of limited value in understanding
performance in service provision. In both Turkey and elsewhere, further investigation is needed to corroborate our
results as well as gain deeper understanding into relationships between health worker densities and service provision.
Published: 22 December 2008
Human Resources for Health 2008, 6:29 doi:10.1186/1478-4491-6-29
Received: 7 November 2007
Accepted: 22 December 2008
This article is available from: />© 2008 Mitchell et al; licensee BioMed Central Ltd.
This is an Open Access article distributed under the terms of the Creative Commons Attribution License ( />),
which permits unrestricted use, distribution, and reproduction in any medium, provided the original work is properly cited.
Human Resources for Health 2008, 6:29 />Page 2 of 16
(page number not for citation purposes)
Background
Increasing vaccination coverage is an important step
towards reducing under-five mortality by two-thirds by
2015, the fourth Millennium Development Goal (MDG).
While there have been large reductions in childhood mor-
tality since the second half of the 20
th
century, over 10
million children still die before the age of five [2]. Vac-
cine-preventable diseases continue to contribute greatly to
this mortality burden, accounting for an estimated 14% of
those deaths. Among deaths due to vaccine-preventable
diseases, measles alone accounts for around one-third,
while pertussis and tetanus combine for another one-
third [3]. Since 1974, the World Health Organization's
(WHO) Expanded Programme on Immunization (EPI)
has been a key tool used by nations to reduce child mor-
tality. Immunizations against measles, diphtheria, pertus-
sis and tetanus (DPT) and polio form the core of all
countries' basic EPI package, with other antigens included
as a country's level of development and financial
resources permit. The importance of a strong EPI frame-
work in reducing child mortality is reflected in one of the
indicators of the fourth MDG – the proportion of children
vaccinated against measles has been selected as one of the
indicators of the fourth MDG. Rate of measles immuniza-
tion is indicative of the coverage and quality of national
health care systems, since most basic health packages in
low- and middle-income countries finance vaccinations
against measles and DPT [4].
In Turkey, where levels of childhood mortality and mor-
bidity remain above those in many of its neighbouring
countries, achieving higher vaccination coverage remains
an unmet goal. Turkey is a middle-income country that
has experienced substantial economic growth over the
past 50 years. As in many other countries with similar
development trajectories (e.g. Mexico), it now faces a dual
burden of disease wherein communicable diseases con-
tinue to weigh down the health of the Turkish people even
while the chronic disease burden grows. Infectious dis-
eases account for around 10% of the country's overall dis-
ease burden and 80% of childhood deaths [5]. As many
children under five die each year (29 per 1000 live births)
as middle-aged adults (45–59), and Turkey experiences
the eighth highest child mortality rate in the WHO Euro-
pean region [3].
The Turkish Ministry of Health (MOH) has made signifi-
cant efforts to reduce childhood mortality through
increased immunization coverage. Introduced in Turkey
in 1980, the government's Expanded Programme of
Immunizations includes vaccinations for BCG, polio,
DPT, measles, Hepatitis B and tetanus toxoid [6]. Immu-
nizations are provided free of charge by MOH facilities at
the primary health care (PHC) level and this delivery sys-
tem accounts for almost all childhood vaccinations
administered in Turkey. Vaccination services are provided
primarily by nurses and midwives under the supervision
of primary care facility general practitioner physicians. In
theory, nurses provide vaccinations only in health facili-
ties, while midwives administer vaccinations both in facil-
ities and in the field. In practice, however, staffing
shortages require that their roles be more interchangeable
and that PHC officers (akin to male nurses) take part
administering vaccinations.
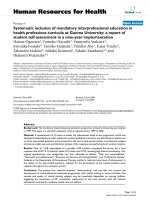
Vaccination coverage has improved substantially under
Turkey's EPI programme. As indicated in Figure 1, the per-
centage of children receiving EPI vaccinations increased
from around 50% in 1980 to around 80% in 2006 (per-
centages averaged across all antigens). In addition to rou-
tine vaccinations provided through the EPI programme,
use of National Immunization Days (NIDs) launched
since the mid-1990s have helped to significantly increase
immunization rates over the past decade. Indeed, the
drop in post-neonatal death rates since the 1990s may in
part reflect successes surrounding the EPI programme [5].
Nevertheless, improving vaccination coverage remains an
important component in reducing the disease burden of
Turkey's children. Nationally, Turkey's EPI vaccination
rate has hovered between 70% and 80% for almost two
decades, and the country's target of 90% complete EPI
coverage remains unmet. There also continue to be wide
regional differences in vaccination coverage. Lower access
to primary care in rural areas is associated with higher
rates of childhood mortality from vaccine-preventable
diseases, and some previous studies have found vaccina-
tion rates in rural areas to be lower than the nationwide
average [7-9]. Further, findings from the most recent
Demographic and Health Survey (DHS) indicate that in
2003 fewer than 50% of children under five received a full
complement of the EPI vaccinations before their first
birthday [7]. Indeed, incomplete and uneven coverage
may be a contributory factor to outbreaks of measles that
seem to occur every three to four years [10] and to persist-
ently elevated levels of childhood mortality more gener-
ally.
Recent international research suggests that the size of
countries' health workforces can be important in increas-
ing vaccination coverage. The 2004 Joint Learning Initia-
tive's Human Resources for Health report and the 2006
World health report focused attention on the many impor-
tant roles that human resources for health (HRH) play in
the functioning of health systems. Findings from the
World health report were based in part on recent cross-
country research examining density of HRH (i.e. number
of health workers per population) and health outcomes
and service provision, including vaccination coverage.
Using 63 country-years of data from 49 countries, Anand
Human Resources for Health 2008, 6:29 />Page 3 of 16
(page number not for citation purposes)
and Bärnighausen (2007) examine associations between
coverage of three types of vaccines – measles-containing
vaccine, DPT and polio – and health worker density. Con-
trolling for GNI per capita, land area and female adult lit-
eracy, they find that the combined density of doctors and
nurses to population is positively and significantly related
to coverage of the three vaccines. When densities are dis-
aggregated by type of health worker, they find that nurse
density in particular is positively associated with vaccina-
tion coverage, while physician density is not. The authors
hypothesize that the opportunity cost for physicians of
administering vaccinations is sufficiently high such that
an increase in density does not lead to increased vaccina-
tion coverage [11].
A second cross-national study finds similar positive rela-
tionships. Expanding on a dataset as used by Anand and
Bärnighausen (2004), Speybroeck et al. (2006) find a pos-
itive relationship between aggregate HRH density and
measles coverage [12,13]. Findings from their disaggre-
gated analysis, however, differ from those of Anand and
Bärnighausen (2007). Speybroeck et al. find that physi-
cian density remains statistically significant with vaccina-
tion coverage, while nurse/midwife density does not. The
authors hypothesize a number of reasons for differences
in findings. Opposite results pertaining to physician den-
sity may be due to the generally low levels of physician
densities in Anand and Bärnighausen's sample (the impli-
cation being that lack of variation in the author's sample
inhibited detection of statistical relationships). Non-sig-
nificance relating to nurses/midwives may be due to
greater cross-country heterogeneity in defining these cate-
gories of HRH than for physicians (implying greater meas-
urement error undermining true relationships).
While such cross-national studies have begun to construct
an evidence base surrounding deployment of health
workers and coverage of health services/health outcomes,
two major gaps in our knowledge remain. First, little
within-country research has been conducted on levels of
health workers and health outcomes. As Speybroeck et al.
(2006) note, the qualifications, training, classification
and roles of health workers vary widely from country to
country. Nurses in some countries, for example, may
undertake many of the same activities as junior doctors in
others. Examining relationships between types of health
workers and health service provision at the cross-national
level is therefore prone to error. A within-country analysis
EPI vaccination rate, 1980–2006Figure 1
EPI vaccination rate, 1980–2006. Source: Immunization Profile – Turkey. />en/.
National EPI Vaccination Rate
0
0.1
0.2
0.3
0.4
0.5
0.6
0.7
0.8
0.9
1
1
9
8
0
1
9
8
2
1
9
8
6
1
9
8
8
1
9
9
0
1
9
9
2
1
9
9
4
1
9
9
6
1
9
9
8
2
0
0
0
2
0
0
2
2
0
0
4
2
0
0
6
Year
Vaccination Rate
Human Resources for Health 2008, 6:29 />Page 4 of 16
(page number not for citation purposes)
avoids such limitations and can therefore provide some-
what stronger evidence on these associations.
Second, while previous studies have generated valuable
hypotheses on causal relationships between HRH and
health outcomes [14], their cross-sectional design inhibits
deeper investigation. Just as vaccination coverage may be
a function of health worker density, so both vaccination
coverage and HRH density may be affected by other unob-
served characteristics that enter into the HRH-health rela-
tionship. The quality of a country's infrastructure, citizen
trust in health institutions and workers, health sector pol-
icies and exogenous shocks are all examples of factors that
are difficult to measure but may be associated with vacci-
nation coverage and deployment of health personnel.
Turkey, for example, experienced a national financial cri-
sis at the end of 2000 and again in early 2001. There are
many ways that such a crisis could affect both the demand
for and supply of vaccinations. Similarly, a new govern-
ment came to power in 2002 and instituted a number of
reforms related to terms and conditions of HRH employ-
ment. These could have affected not only the deployment
of personnel but their motivation to undertake preventive
activities. Should such unmeasured factors be related to
health worker density, the previous studies' empirical esti-
mates may be capturing much more than just the role of
health worker levels on vaccination coverage. Addition-
ally, the previous cross-sectional studies provide little
insight on how relationships may evolve over time and/or
be affected by constantly changing secular forces. Such
knowledge could be useful to policy-makers seeking to
undertake long-term strategies of raising their country's
vaccination coverage.
The present study seeks to answer the questions: Have
HRH densities contributed to increasing vaccination rates
in Turkey, and what implications do findings hold for
raising future vaccination coverage? The analysis takes
advantage of a panel dataset to extend prior research on
this subject. It offers not only insights into immunization
rate variation at any particular time but also changes in
immunization rates over time. Panel data analysis also
makes it possible to distinguish health worker densities
from unobserved (and relatively static) country character-
istics that may affect vaccination coverage; this feature
addresses the second major limitation of previous
research. While it does not purport to make firm declara-
tions on chains of causality between health workers and
vaccination coverage, it does provide evidence that goes
beyond that provided by cross-sectional studies to date.
Data and methods
The analysis draws upon three sources of provincial-level
data from Turkey that span the period 2000 to 2006. Tur-
key is composed of 81 administrative provinces within
seven broader geographical regions. Provincial-level data
on vaccination coverage and levels of public sector human
resources are drawn from primary health care statistics
published by the Turkish Ministry of Health [15]. Data on
provincial population levels, per capita GDP, land area
and female adult illiteracy are published by the Turkish
Statistical Institute [16].
Dependent variable
Data on immunizations are collected by the Turkish Min-
istry of Health based on the national registry system,
which records the number of doses administered by the
government for a variety of types of vaccinations. Vaccina-
tion rates are calculated according to standard administra-
tive methods in which the number of doses of each
vaccination is divided by the number of eligible-aged chil-
dren living in each respective province. The dependent
variable is constructed as the mean vaccination rate of the
six component immunizations of all vaccinations pro-
vided by the national EPI programme (i.e. measles, BCG,
Hepatitis B, polio (three doses), DPT (three doses), and
tetanus toxoid (two doses) (TT2)). While previous
research has focused on relationships between HRH and
individual antigens, a composite EPI indicator is justified
and more informative in the context of Turkey for two rea-
sons. First, since administration of EPI vaccines is organ-
ized and provided by PHC facilities, an average
vaccination rate is perhaps more indicative of the effec-
tiveness of that system than relationships with individual
antigens. Second, as indicated in Table 1, correlations
among the five antigens aimed at communicable diseases
are particularly high – ranging from 82% to 99% – while
tetanus toxoid exhibits yearly correlations from 60% to
76%. Despite its lower degree of correlation, tetanus
typhoid is included in analysis because it (1) is nonethe-
less part of Turkey's EPI programme and (2) exclusion of
this EPI component from analysis does not substantively
affect empirical results (results available from authors
upon request). A composite EPI indicator therefore adds
greater variability and information to the outcome in a
way that does not fundamentally alter relationships
Table 1: Inter-EPI antigen correlations (2000–2005)
Measles DPT Polio BCG HBV
DPT 0.89 1.00
Polio 0.89 0.99 1.00
BCG 0.79 0.80 0.80 1.00
HBV 0.85 0.87 0.87 0.83 1.00
TT2 0.60 0.62 0.62 0.65 0.75
Human Resources for Health 2008, 6:29 />Page 5 of 16
(page number not for citation purposes)
between individual vaccinations and HRH densities.
Indeed, we find empirically that results from EPI analyses
do not differ qualitatively from those examining HRH
densities and individual vaccination rates (results availa-
ble from authors upon request).
Independent variables
The choice of independent variables is informed by previ-
ous studies and the nature of our dataset. HRH density is
measured in two ways: aggregate density of all providers
working in public sector primary care facilities (i.e. gen-
eral practitioners, nurses, midwives and health officers);
and disaggregated densities of doctors, nurses/midwives
and health officers. Following previous studies, variables
on GDP per capita, female adult illiteracy and land area
are also included. Data on per capita GDP and female
adult illiteracy are limited to the year 2000 – the last year
that both variables were calculated as part of Turkey's year
2000 census. Provincial land area is measured in kilom-
eters (squared). Finally, a linear time trend variable (range
0–5) is included, with the inclusion of a squared term to
capture temporal non-linearities in EPI vaccination rate
evident during the period under study (see Figure 1).
Estimation strategy
Previous research leads us to hypothesize the following
provincial-level model:
Vaccination Rate = f(HRH density, time, provincial socio-
economic characteristics, provincial demographic charac-
teristics).
Our theoretical model results in the following estimating
equation:
where Y is the rate of our composite EPI indicator and
β
1
is a (vector of) coefficient(s) relating to HRH density in
either aggregated or disaggregated form, i indexes prov-
inces and t indexes years. Equation (1) is a random effects
model in which we can explore the relationships between
both our time-varying HRH explanatory variables (i.e.
health worker densities) and time-invariant provincial
characteristics (i.e. GDP per capita, female adult illiteracy
and land area). However, such a model also assumes inde-
pendence between time-varying and time-invariant cov-
ariates within each provincial panel (i.e. Cov(X
it
,
α
i
) = 0).
Because this assumption may not hold, we also estimate a
fixed effects specification of equation (1) (in which
β
0
,
υ
i
and all time-invariant parameters are absorbed by a new
constant a
i
). We employ a logistic-log functional form to
be consistent with – and for the same reasons as – previ-
ous research. As described in Anand and Bärnighausen,
the logistic functional form of the dependent variables
addresses both upper and lower boundedness between 0
and 1 [11].
Our empirical analysis expands upon the base model in
equation (1) in two main ways. First, to allow for differing
relationships over time between types of health workers,
we interact HRH densities with our time trend variable.
(We restrict HRH interactions to the time trend main
effect and omit interactions with the time trend squared
term; our specification is based on our findings that no
HRH density-time trend squared term interactions are sig-
nificant either individually or jointly) This is motivated by
our previous observation of the financial crisis and policy
changes that took place during our study period. Second,
we explore possibilities of different HRH-vaccination rela-
tionships among more and less densely populated prov-
inces through stratified analyses that separate provinces
above and below the median population density for Tur-
key. This is motivated by earlier research indicating per-
sistent regional variations in vaccination rates and urban-
rural differences in access to PHC.
Given the varying population sizes of our provinces,
standard errors are clustered by province to be robust
against heteroskedasticity. Such clustering precludes a tra-
ditional Hausman specification test to evaluate the ran-
dom effects model assumption that Cov(X
it
,
α
i
) = 0.
Consequently, we conduct an alternative specification test
described in [17]. This methodology tests the joint signif-
icance of time-varying variables which have been
demeaned and entered directly into the random effects
estimation; joint significance implies that Cov(X
it
,
α
i
) ≠ 0
and that the random effects estimates are not consistent.
All analyses are conducted in STATA 9.0.
Results
Descriptive statistics
Overall vaccination rates of EPI immunizations range
from 74% to 82% over the study period, for a seven-year
average of around 75% (Table 2). Vaccination rates for
measles, DPT, polio and BCG are generally higher than
the overall EPI average, those of HBV around the average,
and those of TT2 the lowest among each type of immuni-
zation. There has been an increase in immunization cov-
erage from baseline to endline (e.g. from 0.74 to 0.81 for
all EPI immunizations), but the trend is U-shaped, with
the lowest point in 2003 rather than a steady increase in
vaccination coverage over time (see years 2000 to 2006 of
Figure 1).
In terms of human resource indicators, Table 3 indicates
that overall nurse and physician densities are at compara-
ble levels – around 2.4 and 2.0 per 10 000 population,
ln ln /
Y
Y
HRH pop TimeTrend TimeTre
it
it t
1
01 2 3
−
⎛
⎝
⎜
⎞
⎠
⎟
=+
()
+
()
+ nnd
GDP capita FemaleIlliteracy LandAr
t
ii
()
+
()
+
()
+
2
456
ln / ln eea
i
iit
()
++
(1)
Human Resources for Health 2008, 6:29 />Page 6 of 16
(page number not for citation purposes)
respectively – with relatively greater numbers of midwives
per 10 000 population (3.7, on average) and fewer PHC
health officers. The density of GPs held steady from 2000
to 2002 but then fell by around 2.2 doctors per 10 000
population by 2006. Density of health officers follows a
similar pattern but at lower levels. Conversely, nurse and
midwife densities have experienced a modest increase
over the study period of around one nurse per 3000 pop-
ulation and one midwife per 2000 population.
When overall EPI vaccination rate and HRH densities are
stratified into relatively urban and rural provinces (Table
4), two findings emerge. First, the overall vaccination rate
during the study period is five percentage points higher in
provinces with population densities above the median for
the country as a whole. Second, there are slightly different
patterns of HRH densities depending upon type of health
worker. On the one hand, densities of GPs are roughly the
same in high and low population-density provinces. On
the other hand, nurse/midwife and health officer densi-
ties are higher in relatively rural provinces compared to
relatively urban ones. T-tests suggest that differences in
densities are statistically significant only for health offic-
ers.
Regressions
Table 5 presents results from the random and fixed effects
models for EPI vaccinations (for comparison purposes,
the first column of each random and fixed effects model
omits all HRH terms). One province (Duzce) was
excluded from regression analysis due to its singularity: it
came into existence in 2000, after a major earthquake in
1999. While inclusion of this province did not quantita-
tively affect regression point estimates/statistical signifi-
cance, our alternative Hausman tests suggested that
significant correlations between our time-varying and -
invariant variables were inordinately influenced by this
province, suggesting that HRH density-vaccination cover-
age processes here were fundamentally different than for
the rest of Turkey (given the substantial need for HRH and
health infrastructure – including vaccines – in this prov-
ince due to the earthquake emergency, this finding is per-
haps not surprising).
In terms of the random effects models, Model I suggests
that, on average, aggregate PHC HRH density is positively
associated with EPI vaccination coverage during the study
period (β = 0.24; p = 0.02). This implies that a 10%
increase in aggregate HRH density is associated with
about a 2.0% increase in probability of a fully completed
EPI vaccination schedule. The model with the interaction
term suggests that this overall relationship is characterized
by a strongly positive main effect association (β = 0.50)
and negative interaction term coefficient (β = -0.11). This
suggests positive relationships until the year 2004 (e.g. a
10% increase in aggregate HRH density in 2000 is associ-
ated with a 3.3% increase in probability of full EPI vacci-
nation coverage) that turn negative thereafter (e.g. by
2006, the same increase in HRH density is associated with
a 1.5% reduction in probability of full EPI vaccination
coverage).
Model II provides indications that different categories of
HRH may be playing different roles in EPI vaccination
coverage. While the non-interacted specification does not
find significant HRH-vaccination rate relationships –
either among each type of health worker individually or
jointly – the interacted specification suggests that two dif-
ferent types of relationships may be at play. On the one
hand, GP/health officer densities and their respective
interaction terms exhibit the same pattern of relationships
as aggregate HRH density in Model I and are jointly signif-
icant. On the other hand, a negative main effect nurse/
midwife term has been counteracted by a positive associ-
ation (joint F-test of nurse-midwife density and interac-
Table 2: Mean vaccination rates, by year
Year Measles DPT Polio BCG HBV TT2 All EPI
2000 0.84 0.82 0.82 0.79 0.73 0.43 0.74
2001 0.84 0.83 0.83 0.79 0.74 0.43 0.75
2002 0.82 0.78 0.78 0.75 0.74 0.43 0.72
2003 0.74 0.68 0.69 0.72 0.69 0.42 0.66
2004 0.79 0.84 0.83 0.75 0.77 0.47 0.74
2005 0.88 0.89 0.89 0.85 0.84 0.55 0.82
2006 0.90 0.88 0.88 0.84 0.83 0.56 0.81
Table 3: Mean HRH densities (per 10,000 population), by year
Year GPs Nurses/Midwives Other PHC staff
2000 2.6 5.7 1.4
2001 2.5 6.1 1.3
2002 2.6 5.5 1.3
2003 2.3 5.2 1.1
2004 2.0 6.0 1.2
2005 2.1 6.2 1.3
2006 2.2 6.1 1.2
Human Resources for Health 2008, 6:29 />Page 7 of 16
(page number not for citation purposes)
tion term p-value = 0.04). Both joint F-tests of no
significant HRH density terms in the interacted models
are highly significant (p < 0.01).
In terms of control variables, adult female illiteracy has a
large and negative association with vaccination coverage,
wherein a 10% increase is associated with a more than
40% reduction in probability of fully completed EPI vac-
cination schedule. This is to be expected, given the well-
established micro-level link between education and vacci-
nation coverage [12], including previous research from
Turkey [9,18,19]. However, neither GDP per capita nor
land area is significantly associated with vaccination cov-
erage. As pointed out by Arah (2007), this might reflect
collinearities with other independent variables (e.g. posi-
tive associations between per capita GDP and both female
literacy and HRH densities) [20]. Time trend main effect
coefficients are negative with positive squared term coeffi-
cients (both highly significant) – a finding consistent with
the descriptive results presented in the last seven years of
Figure 1. Together, the explanatory variables account for
over one-half of variation in our outcome variable. While
much of this variation is between provinces, within-prov-
ince variation is also substantial, particularly given the rel-
atively few time periods. Further, the inclusion of HRH
variables increases within-province R-squared from 0.26
to 0.34, suggesting that as much as one-quarter of the
explained variation is associated with HRH densities.
Results from the fixed effects estimation models are con-
sistent with the random effects estimates. Though no
HRH coefficients in the non-interacted models are signif-
icant, the coefficients from interacted versions of both
Model I and Model II remain jointly significant (p < 0.01).
The main effect aggregate HRH density in Model I remains
positive, though the magnitude is attenuated. In terms of
disaggregated densities under Model II, both GP and
health officer densities remain significantly related to vac-
cination rates with positive main effect and negative inter-
action terms. Interestingly, the magnitude of the negative
GP/time interaction term suggests that the initial positive
associated disappears by 2002 (by the end of the study
period, a 10% increase in GP density is associated with an
almost 30% decrease in probability of full vaccination
coverage). Nurse/midwife density is no longer significant.
As with the random effects analyses, joint F-tests of no
HRH effects suggest that the interacted versions of each
model are appropriate. As with the random effects esti-
mates, comparison of the interacted version of Model II to
the baseline version suggests that HRH densities explain a
significant portion of variation in vaccination rates.
Interestingly, specification tests do not reject the appropri-
ateness of the random effects model for Model I, but do
reject the appropriateness of the random effects estimates
for disaggregated analyses. This suggests that while com-
bined doctor, nurse/midwife and health officer densities
are not correlated with unobserved provincial characteris-
tics, one or more of each disaggregated densities are so
correlated. In fact, further investigation, in which HRH
fixed effects were tested separately by type of health
worker, suggested that only GP densities are significantly
correlated with unobserved provincial characteristics
(results not shown).
We also explored how the vaccination-HRH density rela-
tionship may vary by level of provincial population den-
sity. We restrict presentation of results to the interacted
versions of each model and, to be conservative, the fixed
effects specifications. Table 6 presents the results stratified
by provincial population density. For provinces falling
below median population density (i.e. "rural" provinces),
two findings emerge. First, results for aggregate HRH are
similar to those for the full sample, with an initial positive
relationship turning negative after 2003. Second, the pos-
itive association/negative associations appear to stem
from differing relationships between GPs and health offic-
ers. Health officer density exhibits an overall positive rela-
tionship with vaccination rate (non-interacted β = 0.46; p
= 0.01). Significant associations with GP density, how-
ever, appear to stem from the negative interaction over
time.
A somewhat different picture emerges among Turkey's
higher-population density (i.e. "urban") provinces.
Unlike in more rural provinces, evidence of an overall
aggregate HRH relationship with vaccination rates is mar-
ginal and characterized mostly by negative relationships
among health officers over time. Instead, there are appar-
ently three different types of relationships: a non-signifi-
Table 4: Vaccination Rates and HRH densities – by degree of provincial population density
Population density Vaccination rate, EPI HRH/10 000 population
GP Nurse/Midwife Health Officer
High 0.77 2.4 5.7 1.1
Low 0.72 2.3 6.0 1.4
Human Resources for Health 2008, 6:29 />Page 8 of 16
(page number not for citation purposes)
Table 5: Random and fixed effects estimates of EPI vaccination rates on HRH densities (β coefficients presented; standard errors in
parentheses) (N = 560; # provinces = 80)
Random effects Fixed effects
Baseline Model I Model II Model I Model II
Log HRH density 0.00 0.24* 0.50** 0.00 0.00 0.07 0.29 0.00 0.00
0.00 (0.10) (0.20) 0.00 0.00 (0.20) (0.20) 0.00 0.00
Log HRH density * Time Trend 0.00 0.00 -0.11** 0.00 0.00 0.00 -0.12** 0.00 0.00
0.00 0.00 (0.04) 0.00 0.00 0.00 (0.04) 0.00 0.00
Log GP density 0.00 0.00 0.00 0.12 0.35 0.00 0.00 -0.06 0.15
0.00 0.00 0.00 (0.10) (0.20) 0.00 0.00 (0.10) (0.20)
Log GP density * Time Trend 0.00 0.00 0.00 0.00 -0.13** 0.00 0.00 0.00 -0.15**
0.00 0.00 0.00 0.00 (0.05) 0.00 0.00 0.00 (0.05)
Log nurse/midwife density 0.00 0.00 0.00 0.06 -0.13 0.00 0.00 0.02 -0.19
0.00 0.00 0.00 (0.09) (0.20) 0.00 0.00 (0.10) (0.20)
Log nurse/midwife density * Time Trend 0.00 0.00 0.00 0.00 0.09 0.000.000.000.10
0.00 0.00 0.00 0.00 (0.05) 0.00 0.00 0.00 (0.05)
Log health officer density 0.00 0.00 0.00 0.08 0.36* 0.00 0.00 0.11 0.44*
0.00 0.00 0.00 (0.08) (0.10) 0.00 0.00 (0.10) (0.20)
Log health officer density * Time Trend 0.00 0.00 0.00 0.00 -0.097** 0.00 0.00 0.00 -0.11**
0.00 0.00 0.00 0.00 (0.04) 0.00 0.00 0.00 (0.04)
Time trend -0.31** -0.29** -1.04** -0.29** -1.60** -0.30** -1.16** -0.30** -1.84**
(0.05) (0.05) (0.30) (0.05) (0.40) (0.05) (0.30) (0.05) (0.40)
Time trend-squared 0.062** 0.059** 0.060** 0.059** 0.055** 0.061** 0.062** 0.061** 0.056**
(0.01) (0.01) (0.01) (0.01) (0.01) (0.01) (0.01) (0.01) (0.01)
Log GDP/capita 0.09 0.09 0.10 0.11 0.13 0.00 0.00 0.00 0.00
(0.10) (0.10) (0.10) (0.10) (0.10) 0.00 0.00 0.00 0.00
Log % adult female illiteracy -1.44** -1.28** -1.30** -1.26** -1.30** 0.00 0.00 0.00 0.00
(0.20) (0.20) (0.20) (0.20) (0.20) 0.00 0.00 0.00 0.00
Log Land area -0.01 0.02 0.02 0.02 0.03 0.00 0.00 0.00 0.00
(0.07) (0.06) (0.07) (0.06) (0.07) 0.00 0.00 0.00 0.00
Constant -0.88 0.58 2.36 0.87 3.70* 1.82 3.36* 1.92 5.16**
Human Resources for Health 2008, 6:29 />Page 9 of 16
(page number not for citation purposes)
cant relationship with GP density, an initially negative
association with nurse/midwife density that becomes pos-
itive over time, and an initially positive association with
other PHC staff that turns negative over time.
Robustness
We estimated two alternatives to equation (1) to gauge the
robustness of our findings. As previously mentioned, the
financial crisis of late 2000/early 2001 raises the possibil-
ity that our results are driven not primarily by relation-
ships between HRH densities and vaccination coverage
but by forces affecting both. Turkey's macroeconomic cri-
sis, which left many citizens worse off in real economic
terms, could have affected the supply of government-pro-
vided EPI vaccinations through both HRH densities and
other non-HRH channels (e.g. governmental immuniza-
tion budget cuts leading to reduced availability of vaccina-
tions). On the demand side, documented reductions in
health utilization [21] might have spilled over into
reduced demand for vaccinations by relegating immuni-
zations to a lower priority in people's health-seeking
behaviour. Indeed, the decline in immunization rate from
2001 to 2003 could indicate such a scenario. The HRH
density-vaccination rate relationships we have found
could therefore reflect primarily independent national-
level factors associated with HRH densities but not densi-
ties per se (i.e. omitted variable bias).
If the driving force behind our results is the financial crisis
(or other temporal factor) operating exclusively through
non-HRH, we would expect to find no remaining HRH
density-vaccination rate relationship once we include
time-fixed effects. Results from the fixed-effects version of
this model specification are presented in the first four col-
umns of Table 7 (specification tests, not shown, strongly
reject the appropriateness of the random effects model for
all specifications). Consistent with our earlier findings,
there are no significant HRH density terms in the model
versions without time interaction terms. When these
interactions are included, however, results tell much the
same story as before (HRH densities are interacted with
the linear time trend term). We also estimated models
interacting HRH densities with each year indicator varia-
ble. However, F-tests indicated that the average of these
year-specific interaction terms for each category of HRH
were no different from the interaction coefficient with the
linear time trend interaction. Aggregate HRH density still
exhibits a positive main effect/negative interaction term
and is jointly significant at p < 0.05. Model II again sug-
gests that GP and health officer densities are the driving
force behind this relationship, while we find no signifi-
cant nurse/midwife relationships.
Though a fixed year effects model may most thoroughly
capture the influence of yearly repercussions, it also
(1.20) (1.30) (1.60) (1.50) (1.90) (1.20) (1.50) (1.40) (1.80)
R-squared (within) 0.26 0.26 0.30 0.26 0.34 0.26 0.30 0.27 0.35
R-squared (between) 0.67 0.72 0.71 0.73 0.69
R-squared (overall) 0.50 0.52 0.53 0.53 0.54
F-test: HRH = 0
†
0.00 0.00 10.90 6.62 20.30 0.00 5.72 0.23 3.90
P-value <0.01 0.09 <0.01 <0.01 0.88 <0.01
F-test: GP = GP * Time Trend = 0 0.00 0.00 0.00 0.00 8.41 0.000.000.006.83
P-value 0.02 <0.01
F-test: Nurse/Midwife = Nurse/Midwife * Time Trend = 0 0.00 0.00 0.00 0.00 6.63 0.00 0.00 0.00 2.06
P-value 0.04 0.13
F-test: Health officer = Health officer * Time Trend = 0 0.00 0.00 0.00 0.00 7.18 0.00 0.00 0.00 4.36
P-value 0.03 0.02
F-test p-value: Fixed Effects = 0 0.15 0.16 <0.01 <0.01
** p < 0.01, * p < 0.05
†
Includes all main effects and interaction terms, where applicable
Table 5: Random and fixed effects estimates of EPI vaccination rates on HRH densities (β coefficients presented; standard errors in
parentheses) (N = 560; # provinces = 80) (Continued)
Human Resources for Health 2008, 6:29 />Page 10 of 16
(page number not for citation purposes)
Table 6: Fixed effects estimates of EPI vaccination rates on HRH densities – by low/high provincial population density (β coefficients
presented; standard errors in parentheses)
Low density High density
Log HRH density 0.14 0.44 0.00 0.00 -0.01 0.14 0.00 0.00
(0.30) (0.30) 0.00 0.00 (0.20) (0.20) 0.00 0.00
Log HRH density * Time Trend 0.00 -0.15* 0.00 0.00 0.00 -0.097* 0.00 0.00
0.00 (0.06) 0.00 0.00 0.00 (0.04) 0.00 0.00
Log GP density 0.00 0.00 -0.25 0.09 0.00 0.00 0.33 0.37
0.00 0.00 (0.20) (0.30) 0.00 0.00 (0.20) (0.30)
Log GP density * Time Trend 0.00 0.00 0.00 -0.15* 0.00 0.00 0.00 -0.15
0.00 0.00 0.00 (0.06) 0.00 0.00 0.00 (0.09)
Log nurse/midwife density 0.00 0.00 -0.02 -0.09 0.00 0.00 -0.04 -0.44
0.00 0.00 (0.20) (0.20) 0.00 0.00 (0.20) (0.30)
Log nurse/midwife density * Time Trend 0.00 0.00 0.00 0.04 0.00 0.00 0.00 0.18
0.00 0.00 0.00 (0.05) 0.00 0.00 0.00 (0.09)
Log health officer density 0.00 0.00 0.46* 0.59* 0.00 0.00 -0.30 0.23
0.00 0.00 (0.20) (0.20) 0.00 0.00 (0.20) (0.30)
Log health officer density * Time Trend 0.00 0.00 0.00 -0.08 0.00 0.00 0.00 -0.15*
0.00 0.00 0.00 (0.05) 0.00 0.00 0.00 (0.06)
Time trend -0.31** -1.35** -0.33** -1.94** -0.30** -0.99** -0.31** -1.57*
(0.07) (0.40) (0.07) (0.50) (0.07) (0.30) (0.07) (0.60)
Time trend-squared 0.063** 0.064** 0.064** 0.059** 0.059** 0.060** 0.061** 0.052**
(0.01) (0.01) (0.01) (0.01) (0.01) (0.01) (0.01) (0.01)
Constant 2.14 4.23 2.97 6.51* 1.38 2.46 1.17 3.35
(2.00) (2.30) (2.30) (2.80) (1.20) (1.60) (1.60) (1.90)
R-squared (within) 0.28 0.34 0.31 0.40 0.25 0.28 0.27 0.34
F-test: HRH = 0
†
0.00 3.34 2.57 3.76 0.00 3.15 0.97 2.00
P-value 0.05 0.07 <0.01 0.05 0.42 0.09
F-test: GP = GP * Time Trend = 0 0.00 0.00 0.00 6.99 0.00 0.00 0.00 1.42
P-value <0.01 0.25
Human Resources for Health 2008, 6:29 />Page 11 of 16
(page number not for citation purposes)
reduces implies a within-year and -province interpretation
of our HRH density variables. Such a model substantially
reduces variation in both our outcome and HRH density
and therefore power to detect relationships. We thus re-
estimated equation (1) as specified but restricted to the
time period 2001 to 2006 – the year 2001 corresponding
to the first year that the financial crisis would be expected
to affect vaccination coverage and/or HRH densities.
These estimates are presented in the last four columns of
Table 7. When we omit the year 2000 from analysis, we
find that HRH densities in both the non-interacted and
interacted models exhibit positive associations with vacci-
nation coverage. That is, though aggregate HRH density
exhibits a significantly positive main-effects relationship
with vaccination coverage and a significantly negative
interaction effect, the overall relationship was positive
over the six years (β = 0.56). During this period, then, a
10% increase in aggregate HRH density is associated with
a 3.6% increase in probability of full EPI vaccination cov-
erage. Disaggregated analyses suggest that the overall pos-
itive relationship stems from nurse/midwife and health
officer densities (interestingly, though health officer den-
sity continues to exhibit an initially positive/subsequently
negative relationship, nurse midwife density exhibits the
opposite pattern).
Discussion
Our study suggests that there are relationships between
HRH densities and vaccination rates in Turkey, but our
results also paint a complicated picture. Our main find-
ings can be summarized as follows. First, combined PHC
staff density (GPs, nurses/midwives and health officers)
has been positively associated with provincial-level vacci-
nation rates for EPI immunizations over our study period.
We estimate that every 10% increase in aggregate densities
is associated with a 2% increase in probability of a fully
completed EPI vaccination schedule. Further, this rela-
tionship is characterized by an initially positive associa-
tion that diminished and even disappeared over the study
period (by the end of the study period, a 10% increase in
aggregate density is associated with a 1.5% decrease in
probability of a fully completed EPI vaccination sched-
ule). While these point estimates provide a useful starting
point for quantifying HRH density-vaccination coverage
relationships, we also emphasize that they should be
treated with caution for policy purposes. The limited time
frame of analysis and sensitivity of results to model spec-
ification suggest that further investigation is warranted to
verify our results before basing policy on these findings.
Second, our disaggregated analyses indicate that different
categories of health workers exhibit differing relationships
with vaccination rates. The initially positive/subsequently
negative relationships of the aggregate HRH density anal-
yses appear to be driven primarily by densities of GPs and,
to a lesser degree, PHC health officers. Nurse/midwife
density, on the other hand, exhibits the opposite relation-
ship (initial negative association followed by positive
association over time), though the statistical evidence for
this relationship is weaker. The weaker connection
between nurse/midwife density at the provincial level is
somewhat surprising, given that nurses and midwives are
primarily responsible for administering vaccinations.
Third, we find evidence of a distributional dimension in
which HRH density-vaccination rate relationships are
stronger among Turkey's more rural provinces. In rela-
tively rural provinces (i.e. those with population densities
below the national median), findings mirror those for the
whole sample. Health officer density, in fact, exhibits a
significantly positive overall association during the study
period. By contrast, there is less evidence that HRH densi-
ties have had bearings on vaccination rates among Tur-
key's more urban provinces. Instead, only PHC health
officer densities have had significant relationships with
vaccination coverage, and this is characterized by an ini-
tially positive association that turned negative relatively
soon thereafter.
Finally, HRH density-vaccination rate relationships after
2000 appear to be markedly different from those during
our baseline year. When analyses are restricted to the
period 2001 to 2006, nurse/midwife and health officer
densities have an overall positive relationship with vacci-
nation rate, while GP density continues to have an ini-
tially positive/subsequently negative relationship that
results in an overall null association.
F-test: Nurse/Midwife = Nurse/Midwife * Time Trend = 0 0.00 0.00 0.00 0.32 0.00 0.00 0.00 2.19
P-value 0.72 0.13
F-test: Health officer = Health officer * Time Trend = 0 0.00 0.00 0.00 3.48 0.00 0.00 0.00 4.57
P-value 0.04 0.02
** p < 0.01, * p < 0.05
† Includes all main effects and interaction terms, where applicable
Table 6: Fixed effects estimates of EPI vaccination rates on HRH densities – by low/high provincial population density (β coefficients
presented; standard errors in parentheses) (Continued)
Human Resources for Health 2008, 6:29 />Page 12 of 16
(page number not for citation purposes)
Table 7: Fixed effects estimates of EPI vaccination rates on HRH densities – with fixed time effects (β coefficients presented; standard
errors in parentheses)
Year fixed effects 2001–2006
Model I Model II Model I Model II
Log HRH density -0.11 0.11 0.00 0.56** 0.75** 0.00
(0.20) (0.20) 0.00 (0.10) (0.10) 0.00
Log HRH density * Time Trend 0.00 -0.13** 0.00 0.00 -0.077** 0.00
0.00 (0.04) 0.00 0.00 (0.03) 0.00
Log GP density 0.00 0.00 0.10 0.22 0.00 0.00 0.01 0.26*
0.00 0.00 (0.10) (0.20) 0.00 0.00 (0.07) (0.10)
Log GP density * Time Trend 0.00 0.00 0.00 -0.12* 0.00 0.00 0.00 -0.12**
0.00 0.00 0.00 (0.05) 0.00 0.00 0.00 (0.03)
Log nurse/midwife density 0.00 0.00 -0.23 -0.34 0.00 0.00 0.29** 0.04
0.00 0.00 (0.10) (0.20) 0.00 0.00 (0.09) (0.10)
Log nurse/midwife density * Time Trend 0.00 0.00 0.00 0.07 0.00 0.00 0.00 0.082**
0.00 0.00 0.00 (0.05) 0.00 0.00 0.00 (0.03)
Log health officer density 0.00 0.00 0.02 0.33 0.00 0.00 0.26* 0.54**
0.00 0.00 (0.10) (0.20) 0.00 0.00 (0.10) (0.10)
Log health officer density * Time Trend 0.000.000.00-0.10*0.00 0.00 0.00 -0.084**
0.00 0.00 0.00 (0.04) 0.00 0.00 0.00 (0.02)
Year 0.00 0.00 0.00 0.00 -0.30** -0.85** -0.30** -1.44**
0.00 0.00 0.00 0.00 (0.03) (0.20) (0.03) (0.20)
Year-squared 0.00 0.00 0.00 0.00 0.060** 0.060** 0.060** 0.059**
0.00 0.00 0.00 0.00 (0.00) (0.00) (0.00) (0.00)
2001 -0.12 -1.03** -0.10 -1.53** 0.00 0.00 0.00 0.00
(0.09) (0.30) (0.09) (0.40) 0.00 0.00 0.00 0.00
2002 -0.30** -2.11** -0.30** -3.16** 0.00 0.00 0.00 0.00
(0.10) (0.50) (0.10) (0.80) 0.00 0.00 0.00 0.00
2003 -0.63** -3.36** -0.62** -4.94** 0.00 0.00 0.00 0.00
(0.10) (0.80) (0.10) (1.10) 0.00 0.00 0.00 0.00
Human Resources for Health 2008, 6:29 />Page 13 of 16
(page number not for citation purposes)
What factors may be driving these findings? A first possi-
bility is that changing HRH density-vaccination rate rela-
tionships relate to policy changes within the MOH that
took place during the study period and directly affected
service provision. After a newly elected government came
to power in 2002, a number of reforms governing the
employment of health personnel were instituted. These
included the phasing-out of compulsory service in rural
areas for physicians, the introduction of contract-based
employment for physicians and nurses with salary incen-
tives to serve in rural areas, and the introduction of a per-
formance-based payment system intended to improve
health worker productivity and quality of services.
At the PHC level, performance-based pay rewards the
achievement of clinical outputs by PHC facility team lead-
ers (i.e. GPs) and both clinical and preventive outputs
achieved by the facility (including immunizations). The
changing mix of service provision incentives may have
affected HRH density-vaccination rate relationships and
these changes may have had negative impacts on the vac-
cination rate. For GPs, for example, the incentives of per-
formance-based pay to heighten personal clinical
productivity may have outweighed those designed to
ensure a certain level of facility performance. This could
have, in turn, focused their attention away from preven-
tive activities such as immunizations. In such a case, a
higher density of GPs could be associated with lower vac-
cination rates during the latter part of our dataset.
2004 -0.17 -3.80** -0.12 -5.96** 0.00 0.00 0.00 0.00
(0.10) (1.10) (0.10) (1.50) 0.00 0.00 0.00 0.00
2005 0.27* -4.26** 0.32** -6.98** 0.00 0.00 0.00 0.00
(0.10) (1.30) (0.10) (1.90) 0.00 0.00 0.00 0.00
2006 0.27* -5.17** 0.31* -8.43** 0.00 0.00 0.00 0.00
(0.10) (1.60) (0.10) (2.30) 0.00 0.00 0.00 0.00
Constant 0.47 2.08 0.53 3.52* 5.27** 6.59** 5.97** 8.72**
(1.10) (1.40) (1.30) (1.70) (0.70) (0.80) (0.90) (1.00)
R-squared (within) 0.37 0.41 0.37 0.44 0.53 0.55 0.54 0.59
F-test: HRH = 0
†
0.00 6.30 1.34 2.90 0.00 20.40 10.40 13.30
P-value <0.01 0.27 0.01 <0.01 <0.01 <0.01
F-test: GP = GP * Time Trend = 0 0.00 3.42 0.00 6.72
P-value 0.04 <0.01
F-test: Nurse/Midwife = Nurse/Midwife * Time Trend = 0 0.00 1.89 0.00 11.50
P-value 0.16 <0.01
F-test: health officer = health officer * Time Trend = 0 0.00 0.00 0.00 3.14 0.00 0.00 0.00 9.76
P-value 0.00 0.00 0.05 0.00 0.00 <0.01
F-test: HRH
†
Fixed Effects = 0 0.76 8.22 11.00 38.10 0.76 8.22 0.01 0.26*
P-value 0.38 0.02 0.01 <0.01 0.38 0.02 (0.07) (0.10)
** p < 0.01, * p < 0.05
† Includes all main effects and interaction terms, where applicable
Table 7: Fixed effects estimates of EPI vaccination rates on HRH densities – with fixed time effects (β coefficients presented; standard
errors in parentheses) (Continued)
Human Resources for Health 2008, 6:29 />Page 14 of 16
(page number not for citation purposes)
Conversely, findings related to health officers might be a
result of contract-based employment. While physicians
were generally resistant to serving in rural areas under
contract-based employment, it has been a relatively suc-
cessful incentive among other facility personnel. Between
2004 and 2006, for example, over six times as non-physi-
cian health personnel were employed under contract than
physicians. Coupled with facility-level performance-based
pay incentives to designed to maintain preventive activi-
ties, such employment could have motivated non-GPs to
focus on administering EPI vaccinations. Provinces with
higher densities of health officers would therefore also
exhibit higher vaccination coverage. However, it is unclear
why nurses and midwives would not react similarly to
health officers.
A second possibility is that factors other than employ-
ment-related incentives – such as the economic crisis in
Turkey in late 2000/early 2001 or the general PHC immu-
nization budget – influenced relationships between HRH
densities and vaccination rates. Though MOH policies
may have played a role in these relationships, it is striking
that exclusion of only the baseline year leads to substan-
tially different results. Given that MOH personnel policies
took effect only after 2002, the advent of the financial cri-
sis seems a likely candidate that could have significantly
affected density-vaccination relationships.
Through our year fixed effects model, we had earlier con-
sidered the possibility that such outside forces might
entirely erase evidence of HRH density-vaccination rate
relationships. While this does not appear to be the case, it
is interesting that the nurse/midwife and health officer
densities are unconditionally positive after the year 2000.
There are many reasons why this might be, including
those that operate directly through HRH channels. During
times of economic stress, demand for vaccinations might
depend to an even greater degree on promotion of preven-
tive activities by HRH than before. Increases in the govern-
ment's PHC immunization budget could have facilitated
stepping up of such efforts: hovering around TRY 20 mil-
lion from 1999 to 2002, the budget rose to TRY 45 million
by 2004 and over TRY 100 million by 2006 [22]. These
budgetary trends also correspond to the nationwide rise in
vaccination coverage from its low point in 2003. It is pos-
sible that the budget increases permitted more effective
promotion of preventive immunization activities, and
such promotion was especially crucial during and after the
crisis. Indeed, this hypothesis is consistent with previous
research from Turkey indicating that follow-up visits from
midwives are a determinant of vaccination rates [19].
At the same time, however, it is entirely possible that the
financial crisis and/or PHC immunization budget may
influenced vaccination coverage, while HRH densities
were simply associated with these influences (i.e. omitted
variable bias). While the financial crisis may have damp-
ened demand for vaccinations in general, for instance, its
effects were likely most pronounced among the poorest of
Turkey's citizens. At the same time, more wealthy/less
rural provinces tend to have higher levels of both vaccina-
tion rates and HRH densities. As a result, we might see a
positive relationship between nurse-midwife densities
and vaccination coverage. This particular possibility
would therefore be one of omitted variable bias rather
than an exogenous force operating solely through densi-
ties of health workers. The increases in PHC immuniza-
tion budget could have operated the same way, simply by
making the supply of vaccinations more accessible.
Our analysis can be of policy interest both internationally
and for Turkey. On the one hand, our results suggest that
size of the health workforce may matter to service provi-
sion even at relatively elevated levels of development. Pos-
itive associations between HRH densities and vaccination
rates might be expected at low levels of development in
which inadequate levels of personnel are significant barri-
ers to access to care. As a middle-income country possess-
ing relatively much higher levels of health personnel,
vaccination rates and development compared to low-
income countries, it is not clear that the level of health
personnel would continue to be a determinant of vaccina-
tion coverage in Turkey. It is interesting, then, that we do
find evidence of relationships between HRH density and
vaccination rates. While positive relationships are more
apparent among Turkey's more rural provinces, income
levels in those provinces are still close to the average of all
low- and middle-income countries (USD 3700) [23]. This
finding therefore suggests that HRH densities might mat-
ter for health services even at relatively elevated levels of
development, and that Turkey's lessons are relevant for
many other developing countries. Though it would be
premature to draw strong policy conclusions based on our
results alone, we hope that our results encourage further
investigation in Turkey to verify these findings. Given the
paucity of research relating the health workforce to health
and service provision outcomes, endeavors similar to ours
would be of great use in other countries, as well.
On the other hand, our findings also suggest that focusing
on per capita levels of health personnel may be of limited
value in workforce planning designed to achieve health
systems objectives. There are a variety of ways that govern-
ments typically assess workforce requirements, including
needs-based approaches, utilization or demand-based
approaches, target-setting and density benchmarking
[24].
While the first three approaches make attempts to relate
country-specific conditions to size of the health work-
Human Resources for Health 2008, 6:29 />Page 15 of 16
(page number not for citation purposes)
force, such as disease profile, demand for services and
health worker productivity, they also require more sophis-
ticated modeling and/or deeper data requirements than
benchmarking of HRH densities. For these reasons, then,
policy-makers often focus on per capita levels of health
personnel to gauge the adequacy of a country's health
workforce. Indeed, Turkey's MOH has maintained for
some time that the size of its physician workforce is inad-
equate because, compared to its European neighbours, its
densities are relatively small [6].
Our findings, however, underscore that the size of a coun-
try's workforce is only one part of effective delivery of serv-
ices. As pointed out by Arah (2007), there are wide
variations in HRH densities and vaccination coverage
even at the cross-national level [20]. These variations sug-
gest that a variety of other factors – political, health-sys-
tems, economic, educational, etc. – may mediate
relationships between health personnel density and vacci-
nation coverage and merit future research. Our results are
consistent with such a conclusion.
While some of the hypotheses we have offered by way of
interpretation are not actionable from a MOH policy per-
spective (e.g. influence of the financial crisis), others are
policy levers directly under the government's control (e.g.
incentives of employment policies). A deeper understand-
ing of factors affecting linkages between HRH densities
and provision of vaccinations could thus be of great value
for future workforce planning in Turkey and countries
more generally. Future research on HRH densities and
provision of services could therefore benefit greatly from
a better understanding of health worker performance. For
Turkey's MOH, this might take the form of analyses on the
effects of performance-based pay or compulsory service
on outcomes.
Finally, our results may be of particular interest to the
Turkish MOH in future provision of primary care services
in Turkey. The MOH is currently emphasizing the role that
primary health care must play in addressing Turkey's dis-
ease priorities [25]. The family medicine model empha-
sizes an approach to care in which GPs lead teams of PHC
health workers to provide services. Our findings raise the
possibility that different health worker cadres may be able
to act as substitutes in provision of immunization serv-
ices. That health officer density was positively associated
with vaccination coverage in higher-density provinces
during the entire study period – and nurse-midwife den-
sity from 2001 onwards – while positive associations for
GP density disappeared over time, is consistent with such
substitutability.
While our findings alone are not sufficient to form the
basis of related policy decisions, their nuanced nature sug-
gests that a better understanding of potential roles for
each team-based approach may be important in helping
Turkey improve vaccination coverage and bring its level of
childhood mortality more in line with its European neigh-
bors. More generally, it would be useful for the govern-
ment to understand how its family medicine approach
may affect other aspects of service provision through sim-
ilar avenues of research.
There are two main limitations to our study. First, previ-
ous studies have raised concerns about the accuracy of
immunization rates reported by routine registry systems.
In a study of 45 countries, Murray et al. found that offi-
cially reported DPT coverage levels were systematically
higher than those from demographic health surveys
(DHS) [26]. However, comparison of Turkey's officially
reported estimates to those of DHS and international
agencies do not suggest systematic reporting bias during
the time period under study. WHO/UNICEF estimates of
national coverage for measles-containing vaccine, DPT,
polio and Hepatitis B from 2000 to 2006, for instance, are
virtually identical to nationally-reported figures [27]. Sim-
ilarly, DHS data from 2003 do not suggest the presence of
an upward bias over all EPI vaccinations. Though the offi-
cial estimate of 68% for DPT is higher than that of the
DHS (64%), estimates for polio vaccination are identical
and country estimates for BCG, measles and tetanus vac-
cination are lower than the DHS [1]. This is more sugges-
tive of random measurement error than systematic biases.
If so, we would expect this error to attenuate our HRH
coefficient estimates towards the null rather than inflate
them.
Second, our findings are limited to provincial-level vacci-
nation rates and cannot be directly linked to individual-
level outcomes. For instance, our EPI analyses suggest that
HRH densities have positive relationships with the odds
of administering a full set of immunizations for the pop-
ulation at hand. This is different from the odds of an indi-
vidual child in that province receiving those vaccinations.
Indeed, as highlighted previously, recent DHS data sug-
gests those rates are much lower (less than 50%). Never-
theless, we would expect our outcome rates – number of
doses administered per eligible age population – to be
correlated with individual-level degree of vaccination
schedule completion. Further, our outcomes remain
indicative of a health system's capacities to reach its citi-
zens. The policy lessons described earlier therefore
remain.
ConclusionAn emerging literature has begun to establish
links between human resources for health (HRH) and
population health. At the cross-national level, there
appear to be positive relationships between HRH densi-
ties and vaccination coverage, as well as other indicators
Publish with Bio Med Central and every
scientist can read your work free of charge
"BioMed Central will be the most significant development for
disseminating the results of biomedical research in our lifetime."
Sir Paul Nurse, Cancer Research UK
Your research papers will be:
available free of charge to the entire biomedical community
peer reviewed and published immediately upon acceptance
cited in PubMed and archived on PubMed Central
yours — you keep the copyright
Submit your manuscript here:
/>BioMedcentral
Human Resources for Health 2008, 6:29 />Page 16 of 16
(page number not for citation purposes)
of health status. To our knowledge, ours is the first study
in the field of health to extend such research within a
developing country context and by analysing changes over
time. Though our study also suggests that there are rela-
tionships between HRH densities and vaccination rates in
Turkey during our study period, it paints a more compli-
cated picture than depicted by previous evidence at the
international level. Our findings suggest that a deeper
understanding of relationships between HRH and health
would be of use to policy-makers in Turkey, and should
motivate additional within-country research into HRH
densities and health worldwide.
Competing interests
The authors declare that they have no competing interests.
Authors' contributions
AM performed the statistical analyses and drafted the
manuscript. TB participated in developing the research
question and drafting the manuscript. WY participated in
statistical analyses. SM participated in drafting the manu-
script.
Acknowledgements
The authors wish to acknowledge the help of Dr. Mustafa Kosdak, Dr. Unal
Hulur, Dr. Banu Ayar, Sirin Ozkan, Ummuhan Ekinci and Emel Alkan of the
School of Public Health in Turkey in gathering data and background infor-
mation on health workers in Turkey.
References
1. Immunization Profile – Turkey [ />immunization_monitoring/en/]
2. United Nations: The Millennium Development Goals Report:
2006. New York: United Nations; 2006.
3. Core Health Indicators. Turkey [ />tabase/country/compare.cfm?country=TUR&indicator=MortChild
Both&language=english]
4. Millennium Development Goals [ld-
bank.orext/GMIS/gdmis.do?siteId=2&contentId=Content_t15&men
uId=LNAV01HOME1]
5. Ministry of Health of Turkey: National Burden of Disease and
Cost Effectiveness Project: Burden of Disease Final Report.
Ankara: Refik Saydam Hygiene Center Presidency, Refik Saydam
School of Public Health Directorate, Baskent University; 2004.
6. Ministry of Health of Turkey: Turkey Health Report. Ankara 2004.
7. Hacettepe University Institute of Population Studies: Turkey
Demographic and Health Survey, 2003. Ankara, Turkey: Hacet-
tepe University Institute of Population Studies; 2004.
8. Altinkaynak S, Ertekin V, Guraksin A, Kilic A: Effect of several soci-
odemographic factors on measles immunization in children
of Eastern Turkey. Public Health 2004, 118:565-9.
9. Torun SD, Bakirci N: Vaccination coverage and reasons for
non-vaccination in a district of Istanbul. BMC Public Health 2006,
6:125.
10. Guris D, Bayazit Y, Ozdemirer U, Buyurgan V, Yalniz C, Toprak I,
Aycan S: Measles epidemiology and elimination strategies in
Turkey. J Infect Dis 2003, 187(Suppl 1):S230-4.
11. Anand S, Bãrnighausen T: Health workers and vaccination cov-
erage in developing countries: an econometric analysis. Lan-
cet 2007, 369:1277-85.
12. Anand S, Bãrnighausen T: Human resources and health out-
comes: cross-country econometric study. Lancet 2004,
364:1603-9.
13. Speybroeck N, Kinfu Y, Dal Poz M, Evans D: Reassessing the rela-
tionship between human resources for health, intervention
coverage and health outcomes. In Background paper prepared for
the World Health Report 2006 Geneva: World Health Organization;
2006.
14. DuBois C-A, McKee M: Cross-national comparisons of human
resources for health – what can we learn? Health Economics, Pol-
icy and Law 2006, 1:59-78.
15. Ministry of Health [ />]
16. State Institute of Statistics [ />]
17. Wooldridge JM: Econometric analysis of cross section and
panel data. Cambridge, Mass.: MIT Press; 2002.
18. Topuzoglu A, Ozaydin GA, Cali S, Cebeci D, Kalaca S, Harmanci H:
Assessment of sociodemographic factors and socio-eco-
nomic status affecting the coverage of compulsory and pri-
vate immunization services in Istanbul, Turkey. Public Health
2005, 119:862-9.
19. Ozcirpici B, Sahinoz S, Ozgur S, Bozkurt AI, Sahinoz T, Ceylan A, Ilcin
E, Saka G, Acemoglu H, Palanci Y, et al.: Vaccination coverage in
the South-East Anatolian Project (SEAP) region and factors
influencing low coverage. Public Health 2006, 120:145-54.
20. Arah OA: Health workers and vaccination coverage in devel-
oping countries. Lancet 2007, 370:480. author reply 481.
21. World Bank: Turkey: Reforming the Health Sector for
Improved Access and Efficency (Volumes I and II). In Report
No. 24358-TU Washington, DC: World Bank; 2003.
22. Ministry of Health of Turkey (General and Strategic Planning Directo-
rates): Personal Communication. Ankara .
23. World Development Indicators [ITE/
EXTERNAL/DATASTATISTICS/0,,content MDK:20398986~men
uPK:64133163~pagePK:64133150~piPK:64133175~theS-
itePK:239419,00.html]
24. Dreesch N, Dolea C, Dal Poz MR, Goubarev A, Adams O, Aregawi
M, Bergstrom K, Fogstad H, Sheratt D, Linkins J, et al.: An approach
to estimating human resource requirements to achieve the
Millennium Development Goals. Health Policy Plan 2005,
20:267-76.
25. Ministry of Health of Turkey: Family Medicine: The Turkish
Model. Ankara, Turkey: Ministry of Health of Turkey; 2006.
26. Murray CJ, Shengelia B, Gupta N, Moussavi S, Tandon A, Thieren M:
Validity of reported vaccination coverage in 45 countries.
Lancet 2003, 362:1022-7.
27. WHO/UNICEF: Review of National Immunization Coverage –
Turkey (1980–2006). Geneva: WHO; 2007.