báo cáo sinh học:" Community characteristics that attract physicians in Japan: a cross-sectional analysis of community demographic and economic factors" potx
Bạn đang xem bản rút gọn của tài liệu. Xem và tải ngay bản đầy đủ của tài liệu tại đây (270.27 KB, 10 trang )
BioMed Central
Page 1 of 10
(page number not for citation purposes)
Human Resources for Health
Open Access
Research
Community characteristics that attract physicians in Japan: a
cross-sectional analysis of community demographic and economic
factors
Masatoshi Matsumoto*
1
, Kazuo Inoue
2
, Satomi Noguchi
2
,
Satoshi Toyokawa
2
and Eiji Kajii
1
Address:
1
Division of Community and Family Medicine, Centre for Community Medicine, Jichi Medical University, Tochigi, Japan and
2
Department of Public Health, Graduate School of Medicine, University of Tokyo, Tokyo, Japan
Email: Masatoshi Matsumoto* - ; Kazuo Inoue - ; Satomi Noguchi - ;
Satoshi Toyokawa - ; Eiji Kajii -
* Corresponding author
Abstract
Background: In many countries, there is a surplus of physicians in some communities and a shortage in others.
Population size is known to be correlated with the number of physicians in a community, and is conventionally
considered to represent the power of communities to attract physicians. However, associations between other
demographic/economic variables and the number of physicians in a community have not been fully evaluated. This
study seeks other parameters that correlate with the physician population and show which characteristics of a
community determine its "attractiveness" to physicians.
Methods: Associations between the number of physicians and selected demographic/economic/life-related
variables of all of Japan's 3132 municipalities were examined. In order to exclude the confounding effect of
community size, correlations between the physician-to-population ratio and other variable-to-population ratios
or variable-to-area ratios were evaluated with simple correlation and multiple regression analyses. The equity of
physician distribution against each variable was evaluated by the orenz curve and Gini index.
Results: Among the 21 variables selected, the service industry workers-to-population ratio (0.543), commercial
land price (0.527), sales of goods per person (0.472), and daytime population density (0.451) were better
correlated with the physician-to-population ratio than was population density (0.409). Multiple regression analysis
showed that the service industry worker-to-population ratio, the daytime population density, and the elderly rate
were each independently correlated with the physician-to-population ratio (standardized regression coefficient
0.393, 0.355, 0.089 respectively; each p < 0.001). Equity of physician distribution was higher against service
industry population (Gini index = 0.26) and daytime population (0.28) than against population (0.33).
Conclusion: Daytime population and service industry population in a municipality are better parameters of
community attractiveness to physicians than population. Because attractiveness is supposed to consist of medical
demand and the amenities of urban life, the two parameters may represent the amount of medical demand and/
or the extent of urban amenities of the community more precisely than population does. The conventional
demand-supply analysis based solely on population as the demand parameter may overestimate the inequity of
the physician distribution among communities.
Published: 18 February 2009
Human Resources for Health 2009, 7:12 doi:10.1186/1478-4491-7-12
Received: 18 August 2008
Accepted: 18 February 2009
This article is available from: />© 2009 Matsumoto et al; licensee BioMed Central Ltd.
This is an Open Access article distributed under the terms of the Creative Commons Attribution License ( />),
which permits unrestricted use, distribution, and reproduction in any medium, provided the original work is properly cited.
Human Resources for Health 2009, 7:12 />Page 2 of 10
(page number not for citation purposes)
Background
Physicians are one of the most essential human resources
for maintaining health. Equal distribution of physicians
in consideration of health care needs is a crucial part of
health policy. However, in reality, the unequal distribu-
tion of physicians is a serious problem in many countries.
Physicians are disproportionately concentrated in cities
and are in short supply in rural areas [1-4]. Especially in
Japan, where medical practice is financially based on a fee-
for-service reimbursement system and there is no restric-
tion on practice location, physician distribution is deter-
mined largely by the market and by physicians' individual
preferences. As a consequence, physicians are highly con-
centrated in communities that are financially and geo-
graphically attractive to them, which results in their so-
called maldistribution.
The maldistribution itself is not problematic. If attractive-
ness is equal to medical demand, maldistribution should
be justified because the concentration of physicians in
high-need communities is a proper allocation of this lim-
ited human resource. However, in many societies, there is
a gap between the distribution of needs and the distribu-
tion of physicians, hence, the shortage of physicians in
rural areas is a serious problem.
The power of communities to attract physicians consists
of two elements: the amount of medical demand and the
extent of urban amenities [1,5-8]. Medical demand is
composed of factors such as population size, elderly rate
and morbidity rate. Thus, it is difficult to pinpoint the
amount of medical demand in a community [6,9-11].
However, evaluating medical demand and representing it
quantitatively is necessary in order to arrive at an accurate
assessment of resources and subsequently a desirable dis-
tribution of health resources. Therefore, population size is
conventionally used for representing the quantity of med-
ical needs. The physician-to-population ratio is used to
evaluate the demand-supply balance of physicians in a
community [1,5,7,12].
The municipality (i.e. city, town or village) is the smallest
administrative unit, and is the most often used geograph-
ical unit for communities in Japan, while the county is the
comparable unit in countries such as the United States of
America. Municipalities with higher physician-to-popula-
tion ratios are regarded as areas of physician oversupply
and municipalities with lower ratios are judged as areas of
physician shortage [12]. The municipality- or county-level
physician-to-population ratio has also been used to exam-
ine the longitudinal change of the demand-supply bal-
ance in a single area [1,5,7].
The second element of community attractiveness, the
amenities of urban life, can also have a substantial impact
on physician distribution, and this factor explains why
physicians are overconcentrated in some areas. Physicians
tend to prefer living in urban areas, so the distribution of
physicians is biased toward urban areas [1,13,14]. This
urban preference is probably due to the highly biased
birth origin of physicians toward urban areas [13,15,16].
The urban amenities that physicians tend to prefer are also
a complex concept that is difficult to quantify. Past studies
have revealed that the extent of urban amenities correlates
well with population size. The physician-to-population
ratio is known to increase proportionately with popula-
tion [1,5]. This means that physicians would rather prac-
tise in cities with large populations despite the intense
competition for survival in such areas [1,5].
Population is thus a parameter of both medical demand
and urban amenities. This indicates that the population
can represent the whole range of attractiveness of a com-
munity. However, it is unknown whether the population
alone is the best parameter of the community attractive-
ness among many available variables. There are no studies
that have evaluated the many potential associations
between demographic or economic variables and the
number of physicians in a community. If we can evaluate
the physician-pulling power of communities by means of
multiple variables, we can identify more precisely what
constitutes "medical demand" and "urban amenities".
These types of data can clarify our understanding of the
equal distribution of physicians.
In this study, we examine the strength of associations
between demographic, economic or life-related variables
of municipalities and the number of physicians in the
municipalities by using a widely available dataset of
Japan's 3132 municipalities. Variables that have inde-
pendent correlations with the number of physicians are
regarded as potential parameters of the community attrac-
tiveness. We also calculate the equity of physician distri-
bution against each of the possible parameters of
attractiveness in order to re-evaluate the maldistribution
of physicians, as indicated by conventional physician-to-
population analysis.
Methods
Japan has three levels of government: municipal, prefec-
tural and national. Municipalities (cities, towns and vil-
lages) are the basic geographical units of administration.
Prefectures and municipalities in Japan are roughly com-
parable to states and counties in the United States, respec-
tively. All the data analysed in this study are from
Statistical Observations of the Municipalities 2005, which
includes 100 variables related to demographics, natural
Human Resources for Health 2009, 7:12 />Page 3 of 10
(page number not for citation purposes)
environment, economic activities, labour force, health
and security in each of Japan's 3132 municipalities [17].
The dataset was produced by the Ministry of Internal
Affairs and Communications, and was available online
free of charge. The number of physicians is one of the var-
iables included in the dataset, but it was transferred from
the National Physician Census, where all practising physi-
cians in Japan are obliged to register their work addresses
every two years. Each of the variables selected for analysis
is described in Table 1.
The simplest way to identify which variables could repre-
sent community attractiveness is to examine simple corre-
lation coefficients between the number of physicians and
Table 1: Municipality variables selected for analysis
Variable Explanation
Population Number of registered residents
Daytime population [Population] + [number of commuters from outside] - [number of commuters to outside]
Commuters from outside Population of other municipalities who commute to the municipality
Commuters to outside Population of the municipality who commute out
Foreigners Population who are not Japanese
Elderly population Population who are 65 years old or older
Elderly rate Proportion of those who are 65 years old or older among the population
Workers Number of workers
Primary industry workers Number of workers who engage in agriculture/fishery/mining industry
Sales of primary industry products Total annual sales of the agriculture/fishery/mining products (yen)
Manufacturing industry workers Number of workers who engage in manufacturing industry
Sales of manufactured products Total annual sales of manufactured products (yen)
Service industry workers Number of service industry workers (excluding health care workers)
Sales of commercial goods Total annual sales of commercial goods (yen)
Executives Number of executives of companies and public organizations
Total jobless rate Proportion of those who cannot find a job among employable population
Total income of residents Total of annual incomes of all residents (yen)
Residential land price Price of residencial land per square kilometre (yen)
Commercial land price Price of commercial land per square kilometre (yen)
Divorces Number of divorces per year
Crimes Number of crime cases per year
Area Total area (square kilometres)
Length of paved roads Total length of paved roads (kilometres)
Human Resources for Health 2009, 7:12 />Page 4 of 10
(page number not for citation purposes)
selected variables of municipalities, assuming that the dis-
tribution of physicians is influenced by the attractiveness
of the municipalities in which they live. The correlation
analysis, however, has one problem. Because the values of
most of the variables (including the number of physi-
cians) depend on the size of the population or the size of
the area of the municipality, most of the variables corre-
late well with the number of physicians, whether they rep-
resent attractiveness or not. For example, the number of
kindergartens in a municipality correlates well with its
number of physicians, not because the number of kinder-
gartens represents the community's attractiveness, but
because both values are dependent on and confounded by
the size of the municipality.
Thus, we need to examine the correlations from which the
influences of the population size and area size have been
excluded. For this purpose, we calculated the number of
physicians per 100 000 residents in each of the municipal-
ities, and examined simple correlation coefficients
between the physician-to-population ratio and other var-
iable-to-population ratios.
For population and daytime population, variable-to-area
ratios were used instead of variable-to-population ratios
because these variables directly represent population. If
the number of physicians distributes equally against pop-
ulation, the physician-to-population ratios of municipali-
ties should remain constant. However, in reality,
physician-to-population ratios vary substantially from
one area to another [1].
The variability of physician-to-population ratios indicates
that population, the conventional parameter supposed to
reflect medical demand, does not necessarily represent the
full spectrum of an area's pulling power (attractiveness).
Hence, we regarded variables where the ratio to popula-
tion or ratio to area correlated well with the physician-to-
population ratio as possible parameters representing a
portion of attractiveness that cannot be represented by
population. Because most of the variables in the dataset
were not normally distributed, all correlations were pre-
sented with Spearman's rho correlation.
Next, we extracted variables in which the ratio to popula-
tion or ratio to area showed relatively strong correlations
with the physician-to-population ratio. We also extracted
additional variables that are theoretically associated with
medical demand (i.e. proportion of the elderly, income
level of residents).
We then conducted multiple-regression analysis in which
the extracted variables were treated as explanatory varia-
bles and the physician-to-population ratio as the outcome
variable. This analysis was conducted to reveal the extent
to which each variable-to-population ratio or variable-to-
area ratio independently correlated with the physician-to-
population ratio, and how much the fluctuation in total
of the variables could predict the fluctuation of the physi-
cian-to-population ratio among the municipalities.
In this multivariate analysis, all the variables except for the
proportion of the aged were log
10
-transformed because
they were not normally distributed. The variance inflation
factor (VIF) of each explanatory variable, which is an
index that measures how much the variance of a coeffi-
cient is increased due to collinearity, was calculated to
examine the severity of multicollinearity.
Population size and other variables in which the ratio to
population or to area showed stronger correlations with
the number of physicians in the multiple regression anal-
ysis were regarded as possible parameters of community
attractiveness, and the equity of physician distribution
against each of the parameters was evaluated by the
Lorenz curve and Gini index. Both measures have tradi-
tionally been used to show the extent of income equity
among the members of a society, but they are also used for
the analysis of equity of physician distribution against
population [1,18].
For example, in the analysis of physician-population dis-
tribution we first ranked all the municipalities by physi-
cian-to-population ratio. Next, we calculated both the
cumulative proportion of physicians and that of popula-
tion of each municipality in ascending order of the physi-
cian-to-population ratio.
We then plotted all the points representing the municipal-
ities onto the plane of coordinates with the X-axis repre-
senting the cumulative proportion of population and the
Y-axis representing that of physicians [1]. The plotted line
is the Lorenz curve and the diagonal line between (0,0)
point and (1,1) point represents the complete equity in
the physician-population distribution. The degree of the
arc of the Lorenz curve corresponds to the degree of ineq-
uity.
Finally, we calculated the Gini index, which is the area
between the Lorenz curve and the complete equity line,
divided by the triangle under the equity line. The Gini
index ranges from 0 to 1; the smaller the value, the more
equal the distribution.
The same procedures were used in evaluating equity of
physician distribution against the other possible parame-
ters of attractiveness. We regarded variables against which
physicians are more equally distributed as better parame-
ters of community attractiveness: that is, better parameters
of medical demand and/or urban amenities.
Human Resources for Health 2009, 7:12 />Page 5 of 10
(page number not for citation purposes)
All the statistical analyses were carried out using SPSS
®
for
Windows, version 11.5 (SPSS Inc., Japan). The analyses
were two-tailed, and P < 0.05 was considered statistically
significant.
Results
The results of simple correlation analysis between the
physician-to-population ratio and other selected variables
divided by population or area size are shown in Table 2.
The service industry workers-to-population ratio showed
the strongest correlation with the physician-to-popula-
Table 2: Basic characteristics of community variables and their correlations with physician-to-population ratio (n = 3,132)
Variables of municipalities Mean IQR Correlation* P**
Service industry workers/unit population 26 004 18 639 – 28 979 0.543 <0.001
Commercial land price 80 645 27 525 – 88 175 0.527 <0.001
Sales of commercial goods/person 2 003 300 618 200 – 1 653 200 0.472 <0.001
Daytime population density 1 020 245 – 854 0.451 <0.001
Residential land price 39 208 11 600 – 47 150 0.436 <0.001
Population density 1 018 271 – 914 0.409 <0.001
Workers/unit population 96 194 95 408 – 97 225 0.364 <0.001
Executives/unit population 4 176 3 146 – 5 030 0.349 <0.001
Crimes/unit population 1 313 755 – 1 688 0.326 <0.001
Income/person 3 117 434 2 816 800 – 3 293 300 0.298 <0.001
Total jobless rate 3.8 2.8 – 4.6 0.252 <0.001
Commuters from outside/unit population 151 83 – 173 0.232 <0.001
Length of paved roads/unit area 0.7 0.4 – 0.9 0.225 <0.001
Foreigners/unit population 536 162 – 639 0.222 <0.001
Divorces/unit population 182 134 – 226 0.196 <0.001
Sales of manufactured products/unit population 199 912 44 266 – 229 916 0.112 <0.001
Manufacturing industry workers/unit population 13 905 9 392 – 16 788 -0.049 0.005
Commuters to outside/unit population 189 120 – 258 -0.105 <0.001
Elderly rate 24.0 18.7 – 28.5 -0.226 <0.001
Sales of primary industry products/unit population 21 910 5 474 – 27 284 -0.319 <0.001
Primary industry workers/unit population 7 426 2 732 – 10 678 -0.381 <0.001
Outcome variable is the number of physicians per 100 000 residents (mean 126; IQR 53–155)
*Spearman's rho correlation coefficient
**Probability of coefficient being zero
IQR: Interquartile range
Unit population is 100,000 residents
Unit area is a square kilometer
Human Resources for Health 2009, 7:12 />Page 6 of 10
(page number not for citation purposes)
tion ratio (R = 0.543). Other variables such as commercial
land price, sales of goods per person and daytime popula-
tion density were also positively correlated (R = 0.527,
0.472, 0.451, respectively). In short, density of commer-
cial activity and people correlated best with the physician-
to-population ratio. Some variables such as manufactur-
ing industry workers/population ratio were negatively
correlated, suggesting that these variables have a negative
impact on the number of physicians when the effect of
municipality size is adjusted for.
The results of multiple regression analysis in which the
outcome variable is the physician-to-population ratio are
shown in Table 3. As explanatory variables, two variables
that showed higher correlations with physician-to-popu-
lation ratio were used: service industry workers/popula-
tion ratio and the daytime population density. Other
variables with higher correlations, such as population
density and sales of goods per person, showed strong col-
linearity with one or both of the two variables, and there-
fore were not used in the regression model. Two other
variables, the proportion of those aged 65 or older among
the population (elderly rate) and the average income per
person, were also used as explanatory variables because
they are theoretically expected to influence medical
demand.
The square of the multiple correlation coefficient (R
2
) of
the model was 0.318; that is, the fluctuations of explana-
tory variables in total explain 32% of the fluctuation of
physician-to-population ratio among the municipalities.
The service industry workers/population ratio, the day-
time population density and elderly rate were each inde-
pendently correlated with the physician-to-population
ratio (standardized regression coefficient [B] = 0.393,
0.355, 0.089, respectively; each p < 0.001). The average
income per person was not significantly correlated (B =
0.010, p = 0.578). No strong collinearity was seen among
the explanatory variables (each variance inflation factor
[VIF]<2).
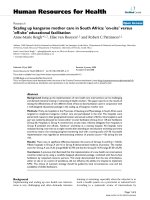
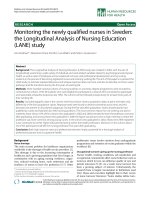
Figure 1 shows the Lorenz curves and Gini indices of phy-
sician distribution against three indicators assumed to
represent community attractiveness: population, daytime
population and service industry population. The figure
indicates that physicians are most equally distributed
against the service industry population (Gini index =
0.26), next, against the daytime population (0.28) and
least equally, against the general population (0.33).
Discussion
This study demonstrated that the variation of the conven-
tional indicator of physician demand-supply balance, the
physician-to-population ratio among municipalities was
to a substantial degree explained by variations in the day-
time population density, service industry worker-to-pop-
ulation ratio, and elderly rate among municipalities.
Daytime population density and service industry worker-
to-population ratio were independently and strongly cor-
related with the physician-to-population ratio. When
population, daytime population and population of serv-
ice industry workers were each regarded as parameters of
community attractiveness, the distribution of physicians
was least equal against population and was most equal
against service industry workers.
In Japan, there is no legal restriction on practice location
of physicians. Physicians can freely choose their places of
practice. All medical practices in Japan are covered by the
National Health Insurance System and profit financially
Table 3: Multiple regression analysis between physician-to-population ratio and other variables of municipalities (n = 3,132)
Coefficient* P** VIF
Daytime population density 0.355 <0.001 1.826
Elderly rate 0.089 <0.001 1.747
Income per person 0.010 0.578 1.588
Service industry workers per unit population 0.393 <0.001 1.146
Multiple correlation coefficient (R) 0.564 <0.001
R
2
0.318
Outcome variable is the number of physicians per 100 000 residents
*Standard partial correlation coefficient
**Probability of coefficient being zero
VIF: variance inflation factor
All variables except for elderly rate were log10-transformed
Human Resources for Health 2009, 7:12 />Page 7 of 10
(page number not for citation purposes)
from its fee-for-service reimbursement system [19]. Physi-
cian distribution in Japan therefore tends to be driven by
the market, and by physicians' own preferences for urban
location. In this context, the community attractiveness,
that is, the community's pulling power for physicians is
determined largely by the amount of medical demand
and extent of urban amenities of the community. Popula-
tion size is usually seen as the parameter that best reflects
the amount of medical demand [1]. This is an assumption
upon which the physician-to-population ratio as an indi-
cator of the demand/supply balance of physicians is
based. Japanese health policies, particularly those on phy-
sician supply and rural health, have been created based on
the physician-to-population analysis of areas [14].
However, the results of this study support a hypothesis
that daytime population is an even better indicator of the
community attractiveness (demand and/or urbanity) than
population. Daytime population density correlated with
the physician-to-population ratio slightly better than pop-
ulation density. Variation of daytime population density
among communities was independently correlated with
variation of physician-to-population ratio, indicating that
there are areas in which physicians appear to be over- or
undersupplied against the registered (nighttime) popula-
tion, but, in fact, adequately supplied against daytime
population. Theoretically speaking, rather than the mere
number of registered residents, the total number of resi-
dents who remain in the area during the daytime and who
commute from the outside (i.e. daytime population)
should be a more accurate reflection of medical needs.
In Japan, most medical offices close at 6:00 pm. It was
reported that the proportion of hospitals open for non-
emergency outpatients after 6:00 pm on weekdays was
10.3% to 12.4%, and the proportion of clinics was 13.7%
to 26.3% [20]. Thus, most medical services are provided
during business hours.
The data of Hong et al. support our reported results. Based
on the population data of United States counties, they
reported that areas in which higher proportions of the res-
idents commuted out tend to have lower physician-to-
population ratios, suggesting that daytime population is a
Lorenz curves and Gini indices of physician distribution against populationsFigure 1
Lorenz curves and Gini indices of physician distribution against populations.
㪈㪅㪇㪅㪏㪅㪍㪅㪋㪅㪉㪇㪅㪇
㪈㪅㪇
㪅㪏
㪅㪍
㪅㪋
㪅㪉
㪇㪅㪇
㪈㪅㪇㪅㪏㪅㪍㪅㪋㪅㪉㪇㪅㪇
㪈㪅㪇
㪅㪏
㪅㪍
㪅㪋
㪅㪉
㪇㪅㪇
㪈㪅㪇㪅㪏㪅㪍㪅㪋㪅㪉㪇㪅㪇
㪈㪅㪇
㪅㪏
㪅㪍
㪅㪋
㪅㪉
㪇㪅㪇
Cumulative proportion of population
Cumulative proportion of
physicians
Service industry population (0.26)
Daytime population (0.28)
Population (0.33)
Complete equity line (Gini index=0.00)
Human Resources for Health 2009, 7:12 />Page 8 of 10
(page number not for citation purposes)
better indicator of a community's medical demand than
nighttime population [21].
The strongest correlation of physician population with
service industry population among community variables
indicates that the service industry population best repre-
sents a community's attractiveness. This indirectly sup-
ports another hypothesis that "accessible daytime
population" and commercial activity are good indicators
of medical demand and/or urbanity.
"Accessible daytime population" is defined as the sum of
the population and persons who are outside the commu-
nity but can potentially gain access to the community in a
relatively short time during the day. The "accessible day-
time population" should theoretically be a better indica-
tor of medical needs than population or even daytime
population. It includes not only the population existing
in the area but also people in the neighborhood commu-
nities who have a strong connection to the area in terms
of transportation and/or commercial activity.
Theoretically the population of service industry workers
in the area could represent the size of the "accessible day-
time population". Service industry workers provide a vari-
ety of goods and services to their customers. The potential
customers of the service industry workers are not only the
residents of the area, but also people who can gain access
to the area from outside. The areas with high service
industry workers/population ratios are expected to be
commercial centres of their wider regions, and be strongly
connected to surrounding areas via infrastructure such as
roads and railways.
The potential customers of commercial centres are thus
residents of wider regions. From the perspective of hospi-
tal and clinic administration, the concentration of physi-
cians in such commercial centres is to be expected,
because they have access to a larger potential customer
population and hence can possibly reap larger profits.
Moreover, the commercial centres should be more
"urban" than areas of similar population size that experi-
ence less commercial activity. From the perspective of
physicians' own preferences, such urban areas with com-
merce would be desirable places to practise and live. In
contrast, areas with low service industry workers-to-popu-
lation ratios are expected to be isolated areas in which the
sizes of accessible daytime populations are almost equal
to the sizes of their registered populations. The popula-
tions of potential patients (i.e. the amount of medical
demand) in such areas should be smaller than in commu-
nities of comparable size with commercial activity.
Regardless of the amount of medical demand, however,
such rural areas would not be attractive to physicians,
most of whom have urban origins and therefore a prefer-
ence for urban life.
The more equal distribution of physicians against daytime
population and service industry population than that
observed against population itself also supports the
hypothesis that these variables are better indicators of
community attractiveness than population. The result
also suggests that maldistribution of physicians can be
overestimated when the distribution analysis is based
solely on the conventional physician-to-population ratio.
If we assume that daytime population and service industry
population are more sensitive parameters of medical
demand than population, taking into account distribu-
tion analysis of physicians against these parameters ena-
bles us to obtain a clearer sense of the demand/supply
balance of physicians in communities, and to ascertain
what their equal distribution actually is. These types of
data can lead to more appropriate public policy actions.
The extent to which population, daytime population and
service industry population represent medical demand is
still largely unknown. As shown in the results, these vari-
ables are parameters of community attractiveness. Attrac-
tiveness, however, is not necessarily the same as demand.
In particular, the plausibility of service industry popula-
tion as an indicator of medical demand is unclear.
Population and daytime population can be considered as
direct indicators of medical needs because health service
users are included in each of the populations. The service
industry population, however, does not necessarily over-
lap with the user population; it is an indirect, surrogate
parameter that is expected to represent the size of popula-
tion that has access to the area.
As mentioned above, community attractiveness in Japan
is largely determined by demand and urban amenities.
Service industry population thus might represent the
extent of urban amenities more than does demand. If this
is the case, equal distribution of physicians against service
industry population is neither desirable nor justifiable
because concentration of physicians in urban areas
beyond the amount of demand in the areas is not a
rational allocation of the limited human resource. It is
thus necessary to first demonstrate, before concluding
that the parameter represents medical needs, that the
parameter correlates well with the real and directly meas-
ured accessible population.
We employed the municipality as the geographical unit
for the analysis. An assumption is required for the munic-
ipality variables to be an indicator of community attrac-
tiveness. The assumption is that health-seeking behaviour
Human Resources for Health 2009, 7:12 />Page 9 of 10
(page number not for citation purposes)
of patients and the provision of health services take place
within the boundary of municipality.
It has been reported that this assumption does not neces-
sarily hold true [21,22]. A substantial proportion of
patients cross county borders to visit their physicians
[21,22]. Past studies in the United States revealed that the
percentage of physician visits that involve county-border
crossing ranges from 7% to 47% according to the type of
the county; the rate was lowest in large metropolitan
counties and highest in rural counties adjacent to metro-
politan counties [22,23]. It might thus be problematic to
use the county (in the case of the United States) and
municipality (in the case of Japan) as the geographical
unit for the analysis of physician supply.
Although several alternative units have been proposed
and tested [23-25], these new analytical tools are much
less available to researchers and policy-makers than the
municipality/county-based data, so their usage is quite
limited. In practical terms, it is most convenient to use
municipality-based data because of the high availability
and accuracy of the data, particularly in terms of demo-
graphics and health care variables. Moreover, municipal-
ity-based analysis of physician supply is useful for policy-
making because the municipality is both an administra-
tive and a geographical unit [12].
For these reasons, municipality-based data are still widely
used to analyse the distribution of physicians, regardless
of their limitations. The results of this study revealed that
there are variables in widely available municipality data
that can potentially take into account the cross-border
effect and represent with greater accuracy the community
medical demand and/or urban amenities.
Conclusion
Population size is a parameter that represents a commu-
nity's attractiveness to physicians, and the conventional
physician-to-population ratio is a relatively valid way of
to analyse the demand-supply balance of physicians.
However, daytime population and service industry popu-
lation in a municipality represent the attractiveness of an
area better than population does, and thus each can be a
better parameter of medical demand and/or urban amen-
ities of the area. The number of people in the area during
daytime and the volume of commercial activity may be
key components of medical demand in and/or the urban
amenities of an area. By adding these new parameters to
the conventional analysis that uses population, we may be
able to evaluate the equity of physician distribution more
precisely.
Competing interests
The authors declare that they have no competing interests.
Authors' contributions
MM directed the study, contributed to design, methods
and manuscript writing. EK, KI, ST and SN contributed to
design, statistical analysis and manuscript writing.
Acknowledgements
This study was funded by the Pfizer Health Research Foundation.
References
1. Kobayashi Y, Takaki H: Geographic distribution of physicians in
Japan. Lancet 1992, 340:1391-1393.
2. Australian Medical Workforce Advisory Committee: The General
Practice Workforce in Australia. Sydney: Australian Medical
Workforce Advisory Committee; 2000.
3. Bureau of Health Professions: Rural Health Professions Facts:
Supply and Distribution of Health Professions in Rural
America. Rockville, MD: Health Resources and Services Adminis-
tration; 1992.
4. Rivo ML, Kindig DA: A report card on the physician work force
in the United States. N Engl J Med 1996, 334:892-896.
5. Rosenthal MB, Zaslavsky A, Newhouse JP: The geographic distri-
bution of physicians revisited. Health Serv Res 2005,
40:1931-1952.
6. Cooper RA, Getzen TE, Laud P: Economic expansion is a major
determinant of physician supply and utilization. Health Serv
Res 2003, 38:675-696.
7. Schwartz WB, Newhouse JP, Bennett BW, Williams AP: The chang-
ing geographic distribution of board-certified physicians. N
Engl J Med 1980, 303:1032-1038.
8. Ernst RL, Yett DE: Physician location and specialty choice Ann Arbor:
Health Administration Press; 1985.
9. Smaje C, Grand JL: Ethnicity, equity and the use of health serv-
ices in the British NHS. Soc Sci Med 1997, 45:485-496.
10. Morris S, Sutton M, Gravelle H: Inequity and inequality in the use
of health care in England: an empirical investigation. Soc Sci
Med 2005, 60:1251-1266.
11. van Doorslaer E, Masseria C, Koolman X: Inequalities in access to
medical care by income in developed countries. CMAJ 2006,
174:177-183.
12. Ministry of Health, Labour and Welfare: The working party report
on national supply of physicians (Ishi no jukyu ni kansuru
kentoukai houkokusyo). [ />dl/s0728-9c.pdf]. Tokyo: Ministry of Health, Labour and Welfare
13. Matsumoto M, Okayama M, Inoue K, Kajii E: Factors associated
with rural doctors' intention to continue a rural career: a
survey of 3072 doctors in Japan. Aust J Rural Health 2005,
13:219-225.
14. Jichi Medical School: Chiiki-iryo hakusyo (The white paper on community
healthcare) Tochigi: Jichi Medical School; 2002.
15. Matsumoto M, Inoue K, Kajii E: Characteristics of medical stu-
dents with rural origin: Implications for selective admission
policies. Health Policy 2008, 87:194-202.
16. Takayashiki A, Okayama M, Mise J, Kajii E: Igakusei no syusshinchi
to syourai no hekichikinmu kibou. (The birthplaces of medi-
cal students and their intentions of rural practice). Primary
Care 2003, 26(supple):142.
17. Statistic Bureau, Ministry of Internal Affairs and Communications:
Toukei de miru shikuchouson no sugata. (Statistical observations of the
municipalities.) Electronic ed Tokyo: Japan Statistical Association; 2005.
18. Brown MC: Using Gini-style indices to evaluate the spatial
patterns of health practitioners: theoretical considerations
and an application based on Alberta data. Soc Sci Med 1994,
38:1243-1256.
19. Ikegami N, Campbell JC: The art of balance in health policy: maintaining
Japan's low-cost, egalitarian system. Japanese edition Tokyo: Chuko-shin-
syo; 1996.
20. Ministry of Health LaW: Iryo-sisetsu chosa 2007 (Health Facility Census
2007) Tokyo: Health and Welfare Statistics Association; 2007.
21. Hong W, Kindig DA: The relationship between commuting
patterns and health resources in nonmetropolitan counties
of the United States. Med Care 1992, 30:1154-1158.
22. Kleinman JC, Makuc D: Travel for ambulatory medical care.
Med Care 1983, 21:543-557.
Publish with Bio Med Central and every
scientist can read your work free of charge
"BioMed Central will be the most significant development for
disseminating the results of biomedical research in our lifetime."
Sir Paul Nurse, Cancer Research UK
Your research papers will be:
available free of charge to the entire biomedical community
peer reviewed and published immediately upon acceptance
cited in PubMed and archived on PubMed Central
yours — you keep the copyright
Submit your manuscript here:
/>BioMedcentral
Human Resources for Health 2009, 7:12 />Page 10 of 10
(page number not for citation purposes)
23. Makuc D, Kleinman JC, Pierre MB Jr: Service areas for ambula-
tory medical care. Health Serv Res 1985, 20:1-18.
24. Makuc DM, Haglund B, Ingram DD, Kleinman JC, Feldman JJ: The use
of health service areas for measuring provider availability. J
Rural Health 1991, 7:347-356.
25. Goodman DC, Mick SS, Bott D, Stukel T, Chang CH, Marth N, Poage
J, Carretta HJ: Primary care service areas: a new tool for the
evaluation of primary care services. Health Serv Res 2003,
38:287-309.