báo cáo sinh học:" National trends in the United States of America physician assistant workforce from 1980 to 2007" ppt
Bạn đang xem bản rút gọn của tài liệu. Xem và tải ngay bản đầy đủ của tài liệu tại đây (367.78 KB, 10 trang )
BioMed Central
Page 1 of 10
(page number not for citation purposes)
Human Resources for Health
Open Access
Research
National trends in the United States of America physician assistant
workforce from 1980 to 2007
Xiaoxing Z He*
1
, Ellen Cyran
2
and Mark Salling
2
Address:
1
Department of Health Sciences, Cleveland State University, 2121 Euclid Avenue HS 122, Cleveland, OH 44115, USA and
2
Northern
Ohio Data & Information Service, Cleveland State University, 1717 Euclid Avenue, Cleveland, OH 44115, USA
Email: Xiaoxing Z He* - ; Ellen Cyran - ; Mark Salling -
* Corresponding author
Abstract
Background: The physician assistant (PA) profession is a nationally recognized medical profession
in the United States of America (USA). However, relatively little is known regarding national trends
of the PA workforce.
Methods: We examined the 1980-2007 USA Census data to determine the demographic
distribution of the PA workforce and PA-to-population relationships. Maps were developed to
provide graphical display of the data. All analyses were adjusted for the complex census design and
analytical weights provided by the Census Bureau.
Results: In 1980 there were about 29 120 PAs, 64% of which were males. By contrast, in 2007
there were approximately 97 721 PAs with more than 66% of females. In 1980, Nevada had the
highest estimated rate of 40 PAs per 100 000 persons, and North Dakota had the lowest rate
(three). The corresponding rates in 2007 were about 85 in New Hampshire and ten in Mississippi.
The levels of PA education have increased from less than 21% of PAs with four or more years of
college in 1980, to more than 65% in 2007. While less than 17% of PAs were of minority groups in
1980, this figure rose to 23% in 2007. Although nearly 70% of PAs were younger than 35 years old
in 1980, this percentage fell to 38% in 2007.
Conclusion: The trends of sustained increase and geographic variation in the PA workforce were
identified. Educational level, percentage of minority, and age of the PA workforce have increased
over time. Major causes of the changes in the PA workforce include educational factors and federal
legislation or state regulation.
Background
The physician assistant (PA) profession of the United
States of America (USA) emerged in the late 1960s, and
has continued to thrive, becoming internationally recog-
nized [1-3]. As health care professionals, PAs are licensed
to practice medicine with physician supervision [4]. PAs'
practices are not only in the areas of primary care, internal
medicine, family medicine, pediatrics, obstetrics, and
gynecology, but also in surgery and the surgical subspe-
cialties. Physicians may delegate to PAs those medical
duties that are within the physician's scope of practice and
the PA's training and experience. Therefore, a broad range
of diagnostic and therapeutic services are delivered by PAs
to diverse populations in rural and urban settings.
Published: 26 November 2009
Human Resources for Health 2009, 7:86 doi:10.1186/1478-4491-7-86
Received: 21 April 2009
Accepted: 26 November 2009
This article is available from: />© 2009 He et al; licensee BioMed Central Ltd.
This is an Open Access article distributed under the terms of the Creative Commons Attribution License ( />),
which permits unrestricted use, distribution, and reproduction in any medium, provided the original work is properly cited.
Human Resources for Health 2009, 7:86 />Page 2 of 10
(page number not for citation purposes)
Because of the close working relationship between PAs
and physicians, PAs are educated in a medical model
designed to complement physician training [4]. The
intensive PA education programs are accredited by the
Accreditation Review Commission on Education for the
Physician Assistant (ARC-PA). The average PA program
runs approximately 26 months [4]. Graduation from an
accredited PA program and passage of the national certify-
ing program, developed by the National Commission on
Certification of PAs (NCCPA), are required for state licen-
sure. Federal or state laws and regulations affect PA work-
force development and practice management [5]. The
sustained growth of the PA workforce appears to be sup-
ported by federal Title VII of the U.S. Public Health Service
Act, in response to skyrocketing medical expenditures, the
physician shortage, and the primary care shortage crisis
[6-11].
The physician shortage and the aging population make
cost containment a critical issue [12-14]. A cost-effective
way to meet the aging population's primary care needs is
the PA model [15,16]. As the growth of the PA profession,
it is important to understand the trends of changes in the
PA workforce, in order to promote health education and
disease prevention for improving the population's health
[17-21]. Furthermore, evidence from public health system
research indicates that the population's health is inevita-
bly influenced by national policies and optimal supply of
medical workforce [22]. However, there is not much liter-
ature regarding the current supply of the PA profession.
While Larson et al. has attempted to describe the status of
the PA workforce, the limitations are lack of current data
and population information [23].
Using nationally-representative population data for 1980,
1990, 2000, 2005, and 2007, we examined the overall
trends of changes in the PA workforce. As part of this anal-
ysis, we also examined the demographic characteristics
and socioeconomic dimensions of the PA workforce, and
PA-to-population relationships nationwide.
Methods
Sources of data
The sources of data were the 1980, 1990, and 2000 U.S.
decennial Census and the 2005 and 2007 American Com-
munity Survey (ACS). For this analysis, the Integrated
Public Use Microdata Sample (IPUMS) was used. The
IPUMS data is the Public Use Microdata Sample (PUMS),
released by the U.S. Census Bureau and enhanced for lon-
gitudinal research [24]. The IPUMS draws its sample in all
3141 counties (or county equivalents) in the USA [24-30].
The IPUMS data for the 1980, 1990, and 2000 are from
the 'long form' samples of the U.S. decennial Census in
those years. The IPUMS data for 2005 and 2007 are from
the annual ACS. The ACS is a rolling sample through the
year and is adjusted to the Census Bureau's independent
population estimates program [24]. The ACS protocol
calls for a sequential contact with a mixed-mode survey,
resulting in a high (over 95%) response rate [24]. With the
use of IPUMS data, the differences in the surveys' defini-
tions of occupations over time are resolved.
Study variables
In all of the IPUMS-USA data since 1980, respondents
were asked to report their job activity and occupation
[25,26]. Participants reported whether they worked at a
private-for-profit; private not-for-profit; local, state, or
federal government; were self-employed; or worked with-
out pay in farm and family business. Participants also
described the industry in which they worked, and
responded to a variety of other employment questions,
including their occupation. The PAs were identified in the
1980, 1990, 2000, 2005, 2007 IPUMS-USA data by the
available code '106' for physicians' assistants, classified
under the category of professional specialty occupations
[27].
Over the 27 years, the only period of major change on the
coding of occupation was between 1990 and 2000. Basi-
cally, the 1990 Census code '106' was matched directly to
the 2000 Census code '311' for physicians' assistants [28].
The 1990 Census code '106' was equivalent to 2000 Cen-
sus code '311', plus the code '340' for emergency medical
technicians (EMT) and paramedics, and the code '365' for
medical assistants and other health care support occupa-
tions. The 2000 Census code '311' would be equivalent to
the 1990 Census code '106' and 5% of the code '208' for
health technologists and technicians. However, the stand-
ard job title of 'physicians' assistants' remained the same
as a single occupation over time. The change of code def-
inition from '106' to '311' was based on keeping the
number in that occupation, and earnings, consistent.
The occupation code/definition change might account for
some but not all demographic changes between 1990 and
2000. Nevertheless, it does not account for any changes
between 1980-1990 or 2000-2005, and 2007. The consist-
ent category system for 1960-2000 Census occupations
was described in the Bureau of Labor Statistics (BLS)
working paper: "we analyze employment levels, average
earnings levels, and earnings variance in our occupation
categories over time, compare these to similar trends for
occupations defined in the occ1950IPUMS classification,
and test both classifications for consistency over time"
[28]. Thus, we were able to analyze the characteristics of
such occupations as physician and PA. We analyzed these
study variables with a focus on the PA profession to
describe the trends of the PA workforce. This is the first
step of a serial analysis (forthcoming) to examine the
changes in healthcare workforce structure in order to iden-
Human Resources for Health 2009, 7:86 />Page 3 of 10
(page number not for citation purposes)
tify the impact on health services utilization or medical
expenditures, and to project the optimal supply of the
nation's medical workforce.
Analysis
We applied the Geographical Information System (GIS)
analysis to examine the patterns of changes in the PA
workforce from 1980 to 2007. Maps were developed to
provide an intuitive graphical display of the data. The
analysis documented how demographic trends and the
geographic distribution of the PA workforce have changed
over time, with a focus on the most recent period from
2000 to 2007. In addition to analyzing overall trends, we
assessed the degree of variation in the PA workforce distri-
bution across the states. Furthermore, we examined the
ratio of PAs to population by state. The analysis was sup-
plemented with data on the PA profession's average
hourly and annual wages from the Occupational Employ-
ment Statistics (OES) from the U.S. Department of Labor.
Appropriate statistical tests have been applied, especially
to the 2005 and 2007 Census data, given their relatively
small sample size (1% sample), to ensure the estimates
are reliable. All analyses were adjusted for the complex
census design and analytical weights provided by the Cen-
sus Bureau.
Results
Overall trends of the PA workforce
The estimated numbers of PAs more than tripled from
1980 to 2007. In 1980, nearly 64 per cent of PAs were
male. By 2007, more than 66 per cent of PAs were female
(Table 1). From 1980 to 1990, there was a decrease in the
number of PAs. Although there was only a slight increase
of male PAs, it indicated more than threefold increase of
female PAs from 1990 to 2000. In the five-year period
between 2000 and 2005, there was an increase of more
than 10 000 PAs among both males and females. In the
years of 2005 to 2007, there was a small increase of male
PAs (about twelve hundred), and sustained growth of
female PAs (over fourteen thousand).
Demographic characteristics of the PA workforce
The educational background of PAs has improved from
less than 21 per cent of PAs with four or more years of col-
lege in 1980, to more than 65 per cent in 2007. In 1980,
nearly 5 per cent of the PAs had less than a twelfth grade
Table 1: Estimated employed PAs by gender and education in the USA, 1980-2007
Gender & Education 1980 1990 2000 2005 2007
Total: N 29 120 23 618 56 922 82 135 97 721
Male: N (%)
<12
th
grade 1520 (5.2) 375 (1.6) 266 (0.5) 317 (0.4) 413 (0.4)
12
th
grade 4900 (16.8) 1332 (5.6) 1170 (2.1) 1894 (2.3) 1044 (1.1)
1-3 years of college 7580 (26.0) 6365 (26.9) 4831 (8.5) 5402 (6.6) 6535 (6.7)
4+ years of college 4500 (15.5) 4270 (18.1) 14 718 (25.9) 23 504 (28.6) 24 384 (24.9)
Total 18 500 (63.5) 12 342 (52.2) 20 985 (37.0) 31 117 (37.9) 32 376 (33.1)
Female: N (%)
<12
th
grade 1400 (4.8) 395 (1.7) 447 (0.8) 574 (0.7) 1381 (1.4)
12
th
grade 5340 (18.3) 2478 (10.5) 4066 (7.1) 5119 (6.2) 5404 (5.5)
1-3 years of college 2340 (8.0) 5259 (22.3) 12 423 (21.8) 14 835 (18.1) 19 100 (19.5)
4+ years of college 1540 (5.3) 3144 (13.3) 19 001 (33.4) 30 490 (37.1) 39 460 (40.4)
Total 10 620 (36.4) 11 276 (47.8) 35 937 (63.1) 51 018 (62.1) 65 345 (66.8)
* Estimates are adjusted using weights provided by the Census Bureau. † While 95% Confidence Intervals are not listed due to space limitations, the
estimates with appropriate statistical testing conducted on the various differences are reliable according to the Census Bureau. ‡The added
percentage may not be 100, due to rounding.
Human Resources for Health 2009, 7:86 />Page 4 of 10
(page number not for citation purposes)
education. By 2007, only 1 per cent of the PAs had an edu-
cation background of less than twelfth grade. The increase
in educational attainment in the PA profession is espe-
cially notable for females (Table 1). In 1980, about 5 per
cent of female PAs had four or more years of college. Dra-
matically, over 40 per cent of female PAs had four or more
years of college by 2007.
In terms of racial and ethnic profile, while fewer than 17
per cent of PAs were minority races (non-White) in 1980,
the estimated percentage of PAs that were minorities
increased to 23 per cent by 2007 (Table 2). Asian Ameri-
can PAs had the greatest percentage increase over time.
Between 1980 and 2007, Asian American PAs increased
threefold - growing from two to six per cent of all PAs.
The age profile of the PA workforce had also undergone
significant change. While nearly 70 per cent of PAs were
less than 35 years old in 1980, this estimated percentage
fell to 38 per cent in 2007 (Table 2). The most remarkable
changes occurred among the 45 to 54 age cohort. In 1980,
this age group composed of only seven per cent of the PA
workforce; by 2007, more than 20 per cent were 45 to 54
years old. Other noticeable changes were among the 35 to
44 and 55 to 64 years old cohorts. In 1980, an estimated
17 per cent of the PAs were 35 to 44 years old. By 2007 the
estimated percentage had increased to about 30 per cent -
nearly doubling its share of the PA workforce in 27 years.
While only three per cent of the PAs were 55 to 64 years
old in 1980, almost 10 per cent of all PAs were estimated
to be in that age group by 2007.
PA-to-population ratios and wages
Ratios of PAs per 100 000 persons varied greatly among
the states for all years in the study (Table 3). In 1980,
Nevada had the highest estimated ratio - 40 PAs per 100
000 persons, followed by Florida (29.8), and Alabama
(26.2). North Dakota had the lowest ratio - three PAs per
100 000 persons. Other states with low ratios in 1980
included Vermont (3.9), and Wyoming (4.3). In 2007, the
highest ratio of PAs per 100 000 persons were 84.7 in New
Hampshire, 75.3 in Maine, and 63.0 in Rhode Island. The
three states with the lowest ratios were Mississippi (10.4),
New Mexico (11.4), and Missouri (11.7).
Table 2: Estimated employed PAs by age and race/ethnicity in the USA, 1980-2007
Age & ace/ethnicity, N (%) 1980 1990 2000 2005 2007
<35 20 240 (69.5) 13 662 (57.8) 21 990 (38.6) 30 218 (36.8) 36 923(37.8)
35-44 5020 (17.2) 6985 (29.6) 17 663 (31.0) 23 205 (28.3) 29 302(29.9)
45-54 2160 (7.4) 2028 (8.6) 13 118 (23.0) 20 326 (24.7) 20 347(20.8)
55-64 980 (3.4) 823 (3.5) 3360 (5.9) 7222 (8.8) 9761 (9.9)
65-74 520 (1.8) 58 (0.2) 618 (1.1) 927 (1.1) 1064 (1.1)
75+ 200 (0.7) 62 (0.3) 173 (0.3) 237 (0.3) 324 (0.3)
White NH 24 160 (82.9) 18 921 (80.1) 43 628 (76.6) 60 962 (74.2) 75 408 (77.2)
Black NH 2780 (9.5) 2053 (8.7) 4830 (8.5) 7707 (9.4) 7606 (7.8)
American Indian/Native NH 120 (0.4) 183 (0.8) 390 (0.7) 481 (0.6) 470 (0.5)
Asian NH 480 (1.6) 1118 (4.7) 2457 (4.3) 4087 (4.9) 5382 (5.5)
Native Hawaiian NH N/A 45 (0.2) 78 (0.1) N/A N/A
Some other races NH N/A N/A 54 (0.1) 147 (0.2) 198 (0.2)
2+ major race groups NH N/A N/A 1028 (1.8) 437 (0.5) 604 (0.6)
Hispanic or Latino 1580 (5.4) 1298 (5.5) 4457 (7.8) 8314 (10.1) 8053 (8.2)
* Estimates are adjusted using weights provided by the Census Bureau. † While 95% Confidence Intervals are not listed due to space limitations, the
estimates with appropriate statistical testing conducted on the various differences are reliable according to the Census Bureau. ‡ NH: Not Hispanic
Human Resources for Health 2009, 7:86 />Page 5 of 10
(page number not for citation purposes)
Table 3: Estimated rates of PAs per 100 000 persons and wages by states in the USA, 1980-2007
States 1980 1990 2000 2005 2007 2007 Hourly mean wages 2007 Annual mean wages
Alabama 26.2 12.1 24.6 13.8 39.9 33.04 68 720
Alaska 14.9 19.5 25.0 16.9 54.3 43.01 89 460
Arizona 23.5 9.5 25.9 42.4 37.5 37.35 77 690
Arkansas 5.2 7.7 8.4 18.8 21.3 31.97 66 490
California 15.6 9.4 20.1 25.8 31.4 37.56 78 120
Colorado 21.5 14.9 27.9 34.1 31.3 36.56 76 050
Connecticut 7.1 14.8 34.5 73.0 38.6 43.76 91 010
Delaware 16.8 5.9 24.0 9.7 57.3 38.8 80 710
DC 12.5 9.1 28.0 58.1 49.8 36.96 76 880
Florida 29.8 10.8 29.8 45.3 35.4 39.23 81 600
Georgia 15.4 15.7 26.2 34.1 60.7 37.58 78 170
Hawaii 20.7 27.0 12.1 6.9 46.5 30.79 64 040
Idaho 14.8 10.7 30.5 12.4 21.9 30.15 62 700
Illinois 18.9 9.6 17.5 23.0 21.3 33.02 68 680
Indiana 10.6 12.7 15.9 19.1 22.6 32.78 68 190
Iowa 10.3 8.4 24.3 35.2 61.1 36.6 76 130
Kansas 19.5 13.6 26.5 45.1 58.7 38.06 79 170
Kentucky 9.8 4.5 24.8 36.2 27.5 36.13 75 160
Louisiana 20.4 9.7 18.5 37.3 31.3 27.24 56 650
Maine 10.7 18.1 59.3 39.1 75.3 39.88 82 960
Maryland 19.0 15.7 24.6 45.3 56.9 39.99 83 190
Massachusetts 6.6 9.3 29.2 19.9 45.6 39.29 81 720
Michigan 14.5 9.3 22.9 38.2 26.5 38.1 79 240
Minnesota 7.9 11.7 24.3 45.4 40.3 40.04 83 280
Mississippi 7.9 8.0 19.4 36.2 10.4 20.27 42 160
Missouri 21.2 13.4 16.0 15.9 11.7 29.44 61 240
Montana 12.7 3.3 25.2 32.1 20.8 30.98 64 440
Human Resources for Health 2009, 7:86 />Page 6 of 10
(page number not for citation purposes)
Data on salaries in 2007 showed that Connecticut's PAs
earned the highest hourly mean wages ($43.8) and
annual mean wages ($91 010). The lowest hourly mean
wages were $20.3 in Mississippi, and it also had the lowest
annual mean wages at $42 160 (Table 3).
Geographic shifts in the PA workforce
In 1980, the top five states with the highest estimated
numbers of PAs were California (3120), Florida (2520),
New York (1920), Illinois (1800), and Texas (1740). Con-
versely, the five states with the lowest estimated number
Nebraska 12.7 15.6 23.3 36.1 58.5 37.98 79 010
Nevada 40.0 11.0 18.3 11.7 17.4 40.3 83 820
New Hampshire 6.5 4.6 36.8 19.4 84.7 38.91 80 920
New Jersey 11.4 9.7 13.8 27.5 25.3 42.69 88 800
New Mexico 16.9 14.1 27.4 35.6 11.4 24.19 50 320
New York 13.8 12.1 31.2 43.6 48.6 39.98 83 160
North Carolina 14.3 12.8 33.3 36.4 42.0 37.87 78 760
North Dakota 3.1 12.5 28.3 55.3 39.3 33.69 70 080
Ohio 11.7 11.7 22.9 21.3 34.3 38.12 79 280
Oklahoma 14.5 4.0 27.9 16.9 29.8 38.75 80 600
Oregon 12.2 4.7 22.7 33.5 33.9 39.16 81 460
Pennsylvania 13.8 11.3 25.7 26.2 48.7 32.39 67 370
Rhode Island 6.3 N/A 22.3 39.8 63.0 36.73 76 400
South Carolina 17.3 11.8 17.6 27.4 25.1 35.31 73 450
South Dakota 11.6 16.7 13.2 99.6 21.4 37.46 77 920
Tennessee 15.7 12.7 23.6 48.2 29.8 35.38 73 590
Texas 13.914.621.534.832.0 39.4 81 960
Utah 16.4 8.1 28.3 36.9 31.8 41.52 86 360
Vermont 3.9 26.7 19.2 13.4 35.9 39.11 81 340
Virginia 13.8 4.9 20.5 17.4 38.7 30.46 63 350
Washington 16.5 12.9 29.8 35.1 40.4 41.45 86 210
West Virginia 17.4 19.8 27.5 50.5 30.7 36.03 74 950
Wisconsin 14.0 9.5 28.8 32.9 42.0 38.53 80 140
Wyoming 4.3 N/A 7.5 N/A 51.8 31.29 65 080
* Estimates are adjusted using weights provided by the Census Bureau. † While 95% Confidence Intervals are not listed due to space limitations, the
estimates with appropriate statistical testing conducted on the various differences are reliable according to the Census Bureau. ‡ DC: District of
Columbia.
Table 3: Estimated rates of PAs per 100 000 persons and wages by states in the USA, 1980-2007 (Continued)
Human Resources for Health 2009, 7:86 />Page 7 of 10
(page number not for citation purposes)
of PAs were North Dakota (20), Vermont (20), Wyoming
(20), New Hampshire (40), and Alaska (40). The geo-
graphic distribution of the PA workforce has been chang-
ing over time. By 2007, New York employed the greatest
estimated number of PAs (9010), closely followed by Cal-
ifornia (9004), Texas (6646), Pennsylvania (5874), and
Florida (5806). North Dakota had the lowest number of
PAs (106) employed in 2007. Two other states that
employed fewer than 200 PAs in 2007 were South Dakota
(170) and Montana (199) (data not shown).
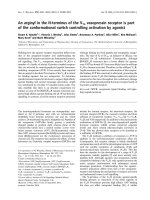
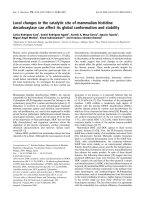
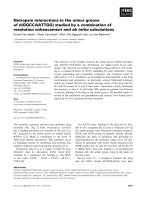
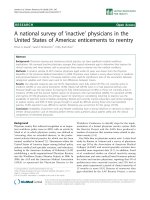
Figure 1 and Figure 2 display the absolute changes and the
percentage changes in the rates of PAs per 100 000 per-
sons across the states. The ratios of PAs to population had
increased since 1980 in all but three states - Missouri,
Nevada, and New Mexico. The greatest growth was in New
England and upper Midwest states. Maine, New Hamp-
shire, and Iowa had the greatest positive changes in the
rates of PAs per 100 000 persons (Figure 1). The states
with the largest percentage increase in the rate of PAs to
population were Maine, Vermont, New Hampshire,
North Dakota, and Wyoming (Figure 2).
Discussions
In this study, we sought to identify the trends of the PA
workforce from 1980 to 2007, based on the estimates
from the USA Census Bureau. A major trend is the increase
in PA workers, with the greatest expansion of PA work-
force between 2000 and 2005. In addition, levels of edu-
cation, percentage of minority, and age of the PA
workforce have increased. One notable change in PA
workforce is the ratio of males to females, from about 1.7
in 1980 down to 0.5 by 2007. Another remarkable change
is that the rates of PAs to population and the average
wages of PAs vary greatly across the 50 states and District
of Columbia. Furthermore, there is a growing concentra-
tion of the PA profession in New England and upper Mid-
west states over the 27 years of study period.
The greatest expansion of PA workforce in 2000 to 2005
likely resulted from the third period of the federal Title VII
Public Health Service Act which supported training of
health professions in medicine and dentistry [6-8]. The
first period, from 1963 to 1975, appeared to lead the
emergence of the PA profession. Title VII support in the
Change in the estimated rate of PAs per 100 000 persons, USA, 1980-2007Figure 1
Change in the estimated rate of PAs per 100 000 persons, USA, 1980-2007. Prepared in January 2009 by Northern
Ohio Data & Information Service, NODIS, The Urban Center, Maxine Goodman Levin College of Urban Affairs, Cleveland
State University, January 2009.
Change in Rate
50.8 - 78.1
32.4 - 50.8
0 - 32.4
-5.5 - 0
-22.6 - -5.5
Texas
Utah
Montana
California
Arizona
Idaho
Nevada
Oregon
Iowa
Colorado
Kansas
Wyoming
New Mexico
Illinois
Ohio
Missouri
Minnesota
Florida
Nebraska
Georgia
Oklahoma
Alabama
South Dakota
Arkansas
Washington
Wisconsin
North Dakota
Maine
Virginia
Indiana
New York
Louisiana
Michigan
Kentucky
Mississippi
Tennessee
Pennsylvania
North Carolina
South
Carolina
West
Virginia
Vermont
Maryland
New
Jersey
New
Hampshire
Massachusetts
Connecticut
Delaware
Rhode Island
District of Columbia
Human Resources for Health 2009, 7:86 />Page 8 of 10
(page number not for citation purposes)
second period, from 1976 to 1991, seemingly marked the
establishment of primary care disciplines and related divi-
sions in all medical schools [8]. Meanwhile, there was a
small decrease in male PAs and a slight increase in female
PAs, as shown in our findings. In the third era, from 1992
to present, national policy goals have emphasized caring
for vulnerable populations, greater diversity in the health
professions, and innovative curricula to prepare trainees
[8]. Apparently, the third period of Title VII support
induced a sustained growth of PA workforce, especially
the expansion between 2000 and 2005. The findings of
increased percentage of minority PAs and levels of PA edu-
cation in this study could serve as direct evidence of the
targeted outcomes of the Title VII third era's national pol-
icy goals. The correlation between the federal Title VII
Public Health Service Act and the PA workforce expansion
could be empirically tested by the planned follow-up
analysis.
While we see favorable increases in the total numbers of
PAs, the levels of education, and the percentage of minor-
ity PAs, an alarming sign is also indicated in our study.
Although it is still a relatively young medical workforce,
the PA profession is growing older - a reflection of similar
trends in other professions and in the nation's population
in general. To keep up with the PA profession's original
goals of meeting the aging population's primary care
needs, it is imperative to develop innovative recruitment
strategies for PA programs to enroll new PA students in
their 20s and early 30s. This is critically important in
building a sustained supply of the PA workforce.
Recruiting younger PA students might also help to balance
the ratio of males to females, since the 'feminization' of
the PA profession appears to be the consequences of more
education, observed in females [31]. In addition, a previ-
ous study suggests that younger PA students are more
likely to stay and practice in rural areas if they are recruited
and receive training there [32]. Therefore, recruiting
younger PA students locally would help to meet the orig-
inal Title VII goals of filling the existing gap of the physi-
cian shortage and enhancing the primary care practice in
rural or underserved areas.
Percent change in the estimated rate of PAs per 100 000 persons, 1980-2007Figure 2
Percent change in the estimated rate of PAs per 100 000 persons, 1980-2007. Prepared in January 2009 by Northern
Ohio Data & Information Service, NODIS, The Urban Center, Maxine Goodman Levin College of Urban Affairs, Cleveland
State University, January 2009.
Texas
Utah
Montana
California
Arizona
Idaho
Nevada
Oregon
Iowa
Colorado
Kansas
Wyoming
New Mexico
Illinois
Ohio
Missouri
Minnesota
Florida
Nebraska
Georgia
Oklahoma
Alabama
South Dakota
Arkansas
Washington
Wisconsin
North Dakota
Maine
Virginia
Indiana
New York
Louisiana
Michigan
Kentucky
Mississippi
Tennessee
Pennsylvania
North Carolina
South
Carolina
West
Virginia
Vermont
Maryland
New
Jersey
New
Hampshire
Massachusetts
Connecticut
Delaware
Rhode Island
Dis trict o f C olumb i a
Percent Change in Rate
605.4 - 1199
359.6 - 605.4
145.3 - 359.6
0 - 145.3
-56.5 - 0
Human Resources for Health 2009, 7:86 />Page 9 of 10
(page number not for citation purposes)
Our findings have shown a large variation among the 50
states and District of Columbia with regard to the rates of
PAs per 100 000 persons and the PAs' average wages.
Some possible explanations include the changes over time
in state laws for PA practice regulations, the delegation of
services agreements (DSA), and the numbers of PA educa-
tional programs. The American Academy of Physician
Assistants (AAPA) website has the detailed summaries of
state laws and regulations [5]. A comparative reading of
the summary clauses of state regulations indicates that a
favorable practice environment, in particular the flexibil-
ity of physician supervision requirements [5], appears to
be the most important factor in encouraging the growth of
the PA workforce. For example, New Hampshire, Maine,
and Rhode Island - the three states with the highest rates
of PAs per 100 000 persons in 2007, had relatively flexible
supervision requirements. In these three states, a physi-
cian was not required to be physically present, as long as
the physician was easily contactable to advise the PA
through easy-to-use and effective electronics or telecom-
munications.
However, more restricted supervision requirements
existed for the three states with the lowest rates of PAs per
100 000 persons in 2007. Mississippi requires on-site
presence of a physician for the first 120 days of care, and
a supervising physician must review and initial 10 per cent
of the PA-written charts monthly. New Mexico demands
immediate communication between the physician and
the PA to specify what services may be provided. Missouri
mandates that the attending physician must practice in
the same facility as the PA, and be present at least 66 per
cent of the time when a PA is providing care.
Furthermore, the enacted dates that PAs were licensed,
registered, or certified to practice had inevitable impact on
the variations of PAs' ratios per 100 000 persons and PAs'
average wages. In 2000, Mississippi the state with the
lowest rate of PAs per 100 000 persons and the lowest
average wages in 2007 was the last state to establish the
statute for PA practice [5]. Our study suggests the necessity
for the federal government to standardize PA practice reg-
ulations across the nation in order to effectively allocate
workforce, improve quality of care, and reduce health dis-
parities.
Moreover, we posit that the availability or the numbers of
PA educational programs played a chief role in influenc-
ing the geographic distribution of the PA workforce. Based
on a list of all accredited PA educational programs by the
AAPA [4], of the three states with the lowest rates of PAs
per 100 000 persons in 1980, two states (Vermont and
Wyoming) did not have any PA educational programs.
Similarly, no PA educational programs were found among
two of the three states in 2007 with the lowest ratios of
PAs to population (Mississippi and Missouri). Therefore,
a national approach or coordinated strategy for training
and retaining PAs is recommended in order to sustain the
PA workforce supply and balance the distribution of the
PA workforce more equitably.
Limitations associated with the data should be noted. Like
all surveys, the USA Census surveys are subject to poten-
tial problems of sampling error and response bias. The PA
samples are relatively small for some states in 1980. Data
on their attributes at the national level are more reliable
and the relatively high response rates minimize the poten-
tial for selection bias. In addition, the measures of occu-
pation and job activities were self-reported, and might
contribute to reporting bias. Finally, the estimated num-
bers of employed PAs appear to be higher than those esti-
mates of clinically active PAs in the AAPA survey report.
The differences in the estimates can be attributed to the
different assumptions or survey sampling methods and
questionnaires used for data collection. Among the
study's strengths are innovative analysis ideas and unique
research designs to explore a topic without much existing
literature.
As a first step in identifying the optimal structure of the
nation's medical workforce, our study informs the USA
policy by providing new information about national
trends in the PA workforce from 1980 to 2007. Further
studies are necessary to inform the development of
national policies with regard to the cost-effectiveness of
various supply patterns for meeting primary care needs,
especially in rural or underserved areas, and the impact of
various supply patterns on medical expenditures in the
nation's health care system.
Competing interests
The authors declare that they have no competing interests.
Authors' contributions
XZH conceived and designed the study, interpreted the
preliminary results, and was responsible for writing the
paper. EC completed preliminary analyses. MS made geo-
graphic maps and helped to edit the draft. All authors read
and approved the final manuscript.
Acknowledgements
This research was made possible through a 2009-2011 Scholars Grant in
Health Policy from Pfizer's Medical and Academic Partnership program.
References
1. Frossard LA, Liebich G, Hooker RS, Brooks PM, Robinson L: Intro-
ducing physician assistants into new roles: international
experiences. Med J Aust 2008, 188:199-201.
2. Druss BG, Marcus SC, Olfson M, Tanielian T, Pincus HA: Trends in
care by nonphysician clinicians in the United States. N Engl J
Med 2003, 348:130-7.
3. Perry HB: Physician assistants: an overview of an emerging
health profession. Med Care 1977, 15:982-90.
Publish with Bio Med Central and every
scientist can read your work free of charge
"BioMed Central will be the most significant development for
disseminating the results of biomedical researc h in our lifetime."
Sir Paul Nurse, Cancer Research UK
Your research papers will be:
available free of charge to the entire biomedical community
peer reviewed and published immediately upon acceptance
cited in PubMed and archived on PubMed Central
yours — you keep the copyright
Submit your manuscript here:
/>BioMedcentral
Human Resources for Health 2009, 7:86 />Page 10 of 10
(page number not for citation purposes)
4. American Academy of Physician Assistants: Physician Assist-
ant Programs [ />physician-assistant-programs]
5. American Academy of Physician Assistants: Summaries of
State Laws and Regulations [ />practice-resources/state-government-and-licensing/state-laws-and-
regulations]
6. Davis AK, Reynolds PP, Kahn NB Jr, Sherwood RA, Pascoe JM, Goroll
AH, Wilson ME, DeWitt TG, Rich EC: Title VII and the develop-
ment and promotion of national initiatives in training pri-
mary care clinicians in the United States. Acad Med 2008,
83:1021-9.
7. Cawley JF: Physician assistants and Title VII support. Acad Med
2008, 83:1049-56.
8. Reynolds PP: A legislative history of federal assistance for
health professions training in primary care medicine and
dentistry in the United States, 1963-2008. Acad Med 2008,
83:1004-14.
9. Sheldon GF, Ricketts TC, Charles A, King J, Fraher EP, Meyer A: The
global health workforce shortage: role of surgeons and other
providers. Adv Surg 2008, 42:63-85.
10. Ricketts TC, Randolph R: Urban-rural flows of physicians. J Rural
Health 2007, 23:277-85.
11. Cooper RA: New directions for nurse practitioners and physi-
cian assistants in the era of physician shortages. Acad Med
2007, 82:827-8.
12. Andersen RM, Rice TH, Kominski GF: Changing the U.S. Health
Care System. John Wiley & Sons, Inc; 2007.
13. Heffler S, Smith S, Keehan S, Borger C, Clemens MK, Truffer C: U.S.
health spending projections for 2004-2014. Health Aff (Millwood)
2005:W5-74-W5-85.
14. Davis K, Anderson GF, Rowland D, Steinberg EP: Health care cost
containment. Baltimore: Johns Hopkins University Press; 1990.
15. Hooker RS: A cost analysis of physician assistants in primary
care. JAAPA 2002, 15:39-42.
16. Davis A, Powe ML: Physician assistants: scope of practice, reg-
ulation and reimbursement. J Med Pract Manage 2002, 18:81-85.
17. Baker DW, Hasnain-Wynia R, Kandula NR, Thompson JA, Brown ER:
Attitudes Toward Health Care Providers, Collecting Infor-
mation About Patients' Race, Ethnicity, and Language. Med-
ical care 2007, 45:1034-1042.
18. Baker DW: The meaning and the measure of health literacy.
Journal of General Internal Medicine
2006, 21:878-83.
19. He XZ, Baker DW: Body-mass index, physical activity, and the
risk of decline in overall health and physical functioning in
late middle age. American Journal of Public Health 2004, 94:1567-73.
20. He XZ, Baker DW: Changes in weight from 1992-2000 among
a nationally-representative cohort of adults aged 51 to 61
years. American Journal of Preventive Medicine 2004, 27:8-15.
21. He XZ, Meng H: Changes in weight among a nationally-repre-
sentative cohort of individuals aged 70 and over, 1993-2002.
Preventive Medicine 2008, 47:489-493.
22. Mays GP, McHugh MC, Shim K, et al.: Identifying dimensions of
performance in local public health systems: results from the
National Public Health Performance Standards Program. J
Public Health Manag Pract 2004, 10:193-203.
23. Larson EH, Hart LG: Growth and change in the physician assist-
ant workforce in the United States, 1967-2000. J Allied Health
2007, 36:121-130.
24. Design and Methodology: The American Community Sur-
vey. Technical Paper 67. Unedited Version [
sus.gov/acs/www/Downloads/tp67.pdf]
25. The 1990 U.S. Census Form [ />90dec/cph4/appdxe.pdf]
26. The United States Census 2000 [ />www/pdf/d02p.pdf]
27. IPUMS USA [ />tion.do?mnemonic=OCC1990]
28. Meyer PB, Osborne AM: BLS Working Papers. [http://
usa.ipums.org/usa/chapter4/OCCBLS_paper.pdf].
29. Davern M, Quinn BC, Kenney GM, Blewett LA: The American
Community Survey and Health Insurance Coverage Esti-
mates: Possibilities and Challenges for Health Policy
Researchers. Health Serv Res 2009, 44:593-605.
30. Ruggles Steven, Sobek Matthew, Alexander Trent, Fitch Catherine A,
Goeken Ronald, Hall Patricia Kelly, King Miriam, Ronnander Chad:
Integrated Public Use Microdata Series: Version 4.0
[Machine-readable database]. Minneapolis, MN: Minnesota Pop-
ulation Center [producer and distributor]; 2008.
31. Lindsay S: The feminization of the physician assistant profes-
sion. Women Health 2005, 41:37-61.
32. Henry LR, Hooker RS: Retention of physician assistants in rural
health clinics. J Rural Health 2007, 23:207-14.