báo cáo sinh học:" Human resources for health and burden of disease: an econometric approach" docx
Bạn đang xem bản rút gọn của tài liệu. Xem và tải ngay bản đầy đủ của tài liệu tại đây (403.75 KB, 11 trang )
Castillo-Laborde Human Resources for Health 2011, 9:4
/>
RESEARCH
Open Access
Human resources for health and burden of
disease: an econometric approach
Carla Castillo-Laborde
Abstract
Background: The effect of health workers on health has been proven to be important for various health outcomes
(e.g. mortality, coverage of immunisation or skilled birth attendants). The study aim of this paper is to assess the
relationship between health workers and disability-adjusted life years (DALYs), which represents a much broader
concept of health outcome, including not only mortality but also morbidity.
Methods: Cross-country multiple regression analyses were undertaken, with DALYs and DALYs disaggregated
according to the three different groups of diseases as the dependent variable. Aggregate health workers and
disaggregate physicians, nurses, and midwives were included as independent variables, as well as a variable
accounting for the skill mix of professionals. The analysis also considers controlling for the effects of income,
income distribution, percentage of rural population with access to improved water source, and health expenditure.
Results: This study presents evidence of a statistically negative relationship between the density of health workers
(especially physicians) and the DALYs. An increase of one unit in the density of health workers per 1000 will
decrease, on average, the total burden of disease between 1% and 3%. However, in line with previous findings in
the literature, the density of nurses and midwives could not be said to be statistically associated to DALYs.
Conclusions: If countries increase their health worker density, they will be able to reduce significantly their burden
of disease, especially the burden associated to communicable diseases. This study represents supporting evidence
of the importance of health workers for health.
Background
The labour force is an essential input in any productive
system, and health care is not the exception. As Gupta
and Dal Poz [[1], p.2] state, the ‘functioning and growth
of the health systems depend on the time, effort and
skill mix provided by the workforce in the execution of
its tasks’.
The World Health Report 2006 defines health workers
as ‘all people engaged in actions whose primary intent is
to enhance health’ [[2], p.1]. In this context, the health
workforce includes health services providers (e.g. physicians, nurses, midwives, and laboratory technicians) as
well as health management and support workers (e.g.
accountants in a hospital, administrative professionals,
and drivers).
In recent decades, worldwide concern about the shortage of health workers has been growing [3,4]. The
Correspondence:
Department of Health Economics, Ministry of Health, Santiago, Chile
estimated shortage is about 4.3 million doctors, nurses,
midwives, and support workers worldwide [2] and is
considered as a ‘global health crisis’ [[5], p.1984] because
it affects not only developing countries but also developed countries; forcing them to implement new policies
in order to train, sustain and retain the workforce.
Considering that the provision of quality health care
depends on the adequate number, distribution and
training of Human Resources for Health (HRH), the
aforementioned shortage must be an important part not
only of the health policy agenda, but also of the health
research agenda, particularly taking into account the
implications that it has on equity.
As Speybroeck mentioned [6], the distribution of the
health workers throughout different countries is an
important factor to consider when equity concerns are
taken into consideration, and even though the shortage
is present in nearly all countries, it affects more severely
the poorest countries in the world. For instance, subSaharan Africa has only 4% of the health workers but
© 2011 Castillo-Laborde; licensee BioMed Central Ltd. This is an Open Access article distributed under the terms of the Creative
Commons Attribution License ( which permits unrestricted use, distribution, and
reproduction in any medium, provided the original work is properly cited.
Castillo-Laborde Human Resources for Health 2011, 9:4
/>
25% of the global burden of disease, while the Americas
have 37% of the health workers and only 10% of the
burden of disease [2].
Although the poorest countries are the most affected
by the scarcity of health workers, most of the countries
in the world are affected by problems related to their
health workforce. The availability of an appropriate
number of health workers is an important (if not the
most important) issue to solve, but not the only one.
The productivity of the existent resources, the appropriate skill mix (i.e. allocation throughout different occupations), the geographical distribution of the health
workers according to the population needs, and the
quality of the services delivered by them are just a few
examples of other issues to consider, generally neglected
by the decision makers. As Dussault and Dubois stated
[[7], p.14], ‘[t]he lack of explicit policies for HRH development has produced, in most countries, imbalances
that threaten the capacity of health care systems to
attain their objectives’.
Migration is one of the most readily-recognised contributors to the increasing shortage in some of the
world’s most disadvantaged countries (i.e. ‘source countries’). At the same time, it represents a way to deal
with the shortage in the destination countries. Differences in salaries as well as working conditions are major
incentives to migrate; therefore, a key component of
health policies on human resources must incorporate
financial and non-financial strategies to retain the health
workers, especially in poor countries.
Gupta and Dal Poz [1], in a cross-country comparison
including six countries, highlight the ‘dual employment’
(i.e. when the employee holds more than one position in
different locations) as a factor which may represent a
signal of unsatisfactory salaries. Dräger et al. [8] present
a cross-country comparison of health workers’ wages
(i.e. physicians and professional nurses) for 42 countries,
where data are available from the OWW database (i.e.
International Labour Organization October Inquiry and
Occupational Wages around the World), showing huge
differences in average yearly wages earned by physicians
and nurses between developed countries (USA being the
highest) and the same professionals in poor countries.
As the wage differentials have been proven to be so
large between destination and source countries, Vujicic
et al. [9] suggest that non-financial incentives may be
more effective in order to retain health workers in their
countries.
Another problem regarding human resources for
health is the skill mix imbalance, which can be appreciated by the great differences in the composition of
health teams throughout different countries (e.g. ratio
nurses to physicians, specialists to physicians or health
Page 2 of 11
care management to physicians). As official data on
number of specialists are not always available, a common indicator of skill mix that can be compared
throughout countries is the ratio of nurses to physicians.
The World Health Report 2006 [2] states that this varies
between 5:1 in the World Health Organization’s (WHO)
African Region and 1.5:1 in the WHO Western Pacific
Region.
The substitution of health workers (e.g. high-level
cadres substituted by mid-level cadres) has been suggested in the literature as one of the alternatives to
deal with the shortage of health professionals in poor
countries at a lower cost [10-12]. However, the evidence regarding skill mix in the health care workforce, and in particular the degree of substitutability
between different cadres, is still limited and mostly
descriptive [13].
In any case, the availability of data on health workers
and wages is one of the major current obstacles to conducting health workforce research and, therefore, also to
developing appropriate health worker policies. Nonetheless, WHO is developing some projects in order to
improve the availability of these data at a worldwide
level (e.g. WHO Human Resources for Health Minimum
Data Set, [14]).
Although it may seem clear that health workers play a
fundamental role in the delivery of health interventions,
and that, through this, their availability and actions have
direct effect on people’s health, a question that may
arises from this evidence is exactly how much of the
burden of disease can be explained by the density of
health workers.
The purpose of this study is to conduct a cross country study in order to analyse descriptively and econometrically the relationship between human resources for
health (i.e. density of health workers) and population
health outcomes, focusing especially on the burden of
disease (i.e. disability-adjusted life years (DALYs)), and
compare these results with the results for other outcome
indicators previously analysed in the literature (i.e. vaccination coverage and mortality). Finally, the analysis will
be extended considering separately the DALYs of the
three different groups of the burden of disease as the
dependent variable (i.e. communicable, non-communicable diseases, and injuries), in order to study the possible different effects of the variable of interest (i.e. health
workers) on these different groups of diseases.
The essay is organized into five sections. The second
section reviews the literature, presenting some theoretical and empirical considerations regarding the relationship between health workers and population health. The
third section describes the data and the methodology of
the study. The fourth section presents the results and
Castillo-Laborde Human Resources for Health 2011, 9:4
/>
discusses the policy implications of the main findings.
The final section summarises the conclusions.
Literature review: what the literature says about the
relationship between health workers and health
outcomes
The World Health Statistics 2009 [15] indicate that the
global average number of physicians per 10 000 people
is 13. However, there is a wide range of variation
between the different regions. For instance, while in the
European Region the number of physicians per 10 000
populations is 32, it is just 2 in the African Region. In
the case of nurses and midwives, the global average per
10 000 is 28, but again there are significant variations,
ranging between 11 and 79 per 10 000 in the WHO
African and European Regions respectively.
Considering physicians, nurses, and midwives, Speybroeck, et al. [16] estimate that countries with less than
2.28 health workers per 1000 people (i.e. 23 per 10 000
populations) will present problems to achieve 80%
skilled coverage of births, one of the interventions considered by the Millennium Development Goals (MDG).
Looking at this threshold and the average densities mentioned above, the African Region appears to be in a disadvantaged position in terms of the achievement of the
MDGs [10]. In fact, it has been estimated that there is a
shortage of more than 800 000 physicians, nurses, and
midwives in this region [17,18].
The growing concern about health workers has represented a great incentive to develop literature in this
area, especially in the context of health policies, to deal
with the problems associated with the shortage or the
imbalance of the health workforce. Moreover, there
seems to be a consensus in the literature concerning the
critical role of the human resources for health in terms
of the management and delivery of health services, especially considering that they account for an important
part of the health budgets in most of countries [19].
In this context of concern about the health workforce
it is important to keep in mind that the main goal of
any health system is to enhance population health. It
cannot be denied that health workers are a key input in
the productive process of health care (i.e. playing a fundamental role in the delivery of health interventions),
and therefore they have a direct effect on the population health (i.e. the final outcome). However, a question
that arises is how much of this ‘health’ can be
‘explained’ by the density of health workers. In order to
answer this question a crucial issue is to find a measurable indicator of ‘health’. Smith et al. [[20], p.4] describe
the population health measures as ‘measures of aggregate data on the health of the population’; for instance,
Page 3 of 11
life expectancy, years of life lost, avoidable mortality, or
disability-adjusted life-years (i.e. DALYs).
Previous cross-sectional studies have attempted to
assess the relationship between the human resources for
health (e.g. density of doctors, density of health workers,
and density of nurses and midwives) and the health outcomes (e.g. maternal, infant and under-five mortality
rate, vaccine coverage, and coverage of skilled birth
attendants).
Not only do the health outcomes considered as a
dependent variable different from study to study, but so
are the independent variables included (e.g. controlling
for poverty, GDP, and adult literacy), in addition to the
different functional forms for their econometrics analysis
(for instance, logit-log [21], log-linear [22], linear regressions with arcsin and log transformation of the dependent and independent variables [23,24], logit-log and
arcsine-log model [16]). Furthermore, the results from
the studies come to different conclusions.
Kim and Moody [25], and Hertz and Landon [26]
found no significant association between density of doctors and infant mortality; while Cochrane et al. [27]
recorded an adverse association (i.e. positive) between
the density of doctors, and infant and perinatal
mortality.
On the other hand, more recent studies have found a
positive and a significant association between the density
of health workers and the health outcomes. Robinson
and Wharrad [23] state a negative relationship between
the density of doctors and the two dependent variables,
‘infant mortality rate’ and ‘under-five mortality rate’. In
2001, the same authors found a negative relationship
between the density of doctors and maternal mortality
[24]. However, both studies also show the ‘disappearing’
(i.e. no statistical significance) of nurses.
Anand and Bärninghausen [22], controlling for gross
national income per capita, income poverty and female
adult literacy, present a negative association between the
density of doctors and maternal, infant, and under-five
mortality. The coefficient for the density of nurses was
negative and significant just in the case of maternal
mortality, with no significance in other cases.
Anand and Bärninghausen [21], controlling for gross
national income per capita, female adult literacy, and
land area, present a positive relationship between the
density of aggregate health worker (i.e. including doctors
and nurses) and the coverage of three kinds of vaccination (i.e. MCV, DTP3 and polio3). When including
health workers separately, the density of nurses was significantly associated with the three dependent variables,
but the effect of physicians on the dependent variables
was found to be not significant.
Castillo-Laborde Human Resources for Health 2011, 9:4
/>
Finally, Speybroeck, et al. [16], controlling for income
poverty, GDP and female literacy, found a positive relationship between the density of aggregate health workers
and the coverage of measles immunization and skilled
birth attendants. In the case of disaggregate densities,
they found a significant association between the density
of physicians and the dependent variables, while the
relationship was found not to be significant in the case
of nurses.
All the studies mentioned above have considered the
health outcomes related to mortality, the coverage of a
particular disease immunization or the coverage of
skilled birth attendants. Although all of these health
outcomes are related to the Millennium Development
Goals, in recent decades interest has grown in more
comprehensive indicators of population health, capable
of combining mortality and morbidity [28]. In this context, a measure of the overall burden of disease such as
DALYs (i.e. the aggregation between YLL (years of life
lost), and YLD (years lived with disability)), which can
capture the impact of fatal as well as non-fatal diseases,
is interesting to investigate as a health outcome or as a
dependent variable.
As it has been stated by the literature, these kinds of
health indicators (e.g. DALYs) may be influenced by factors outside the health care system [28], an idea captured by the concept of social determinants of health, or
social determinants of health inequalities [29,30]. This
implies that an analysis on the effect of any input (e.g.
health workers) or the characteristics of the health care
system on an indicator such as DALYs must control for
other factors such as socioeconomic variables.
Data and methods
The data from different public sources were collected in
order to conduct a cross country study to analyse
descriptively and econometrically the relationship
between the human resources for health and the health
outcomes. Previous studies have analysed this relationship considering the health outcomes such as child mortality or vaccination coverage. However, this study is
focused particularly on the burden of disease (i.e.
DALYs) as the health outcome of interest.
The availability of data on DALYs, as well as for
health workers (i.e. physicians, nurses, and midwives),
for all the WHO Member States allowed not only the
analysis of the statistical relationship between these
two variables, but also the inclusion of other variables,
for instance the mix between professionals (i.e. ratio
doctors/nurses and midwives) which is also considered
in the literature as an important determinant of the
health outcomes. The analysis also considers health
expenditure as a percentage of gross domestic product
(GDP) and socioeconomic variables in order to control
Page 4 of 11
and capture the effect of other factors that may affect
health.
The data on the number (and density per 1000 populations) of physicians, nurses, and midwives were
obtained from the World Health Statistics 2009 [15].
These data are part of the global WHO health workforce database and are derived from multiple sources
such as administrative records, establishment census/
surveys, labour force or other household surveys,
national population, and housing censuses. Dal Poz
et al. [31] present detailed information on the sources,
limitations, and distribution of these data.
The data on the nurses and midwives are presented in
an aggregated way in the report. As Anand and Bärnighausen mentioned [22], in some countries these two categories exist separately but have similar training and
overlapped tasks, while in other countries midwives do
not exist as a separate category, therefore it may be better to include them in an aggregated manner. The data
on the number of other cadres (i.e. dentistry personnel,
community health workers, and other health service
providers) are presented in the report. However, as data
were missed for several countries, and also considering
that previous studies focused just on the three categories
mentioned above, the other cadres were not included in
the analysis.
The total expenditure on health as a percentage of
GDP (2002) was extracted from the Global Health Atlas
[32]. Following Xu et al. [33], this variable was included
as a proxy of the relative degree of health system
capacity.
The socioeconomic variables included in the analysis
are the GDP per capita, the percentage of rural population with access to clean water, the GINI coefficient,
and the income share held by the lowest 10% of the
population. The former was included as a measure of
income, the second as a proxy of absolute poverty, and
the remaining variables as a measure of income distribution. The data for the year 2004 on the GDP per capita,
in terms of purchasing power parity, were taken from
the World Economic Outlook Database [34]. The data
for the latest available year on the percentage of rural
population with access to improve water source, the
GINI, and the income share held by the lowest 10%
were obtained from the World Development Indicators
[35,36].
The limited availability of socioeconomic data at
country level forced the reduction in the number of
countries included in the analysis. Starting with 193
countries (i.e. WHO Member States) for consideration,
the data on the GDP per capita purchasing power parity
(PPP) were available for only 173 countries (see additional file 1). Furthermore, when taking into account
income distribution variables, data were available just
Castillo-Laborde Human Resources for Health 2011, 9:4
/>
for 125 countries. The percentage of population that
lives with less than 2 dollars per day (PPP) would have
been preferable to consider as a measure of absolute
poverty, but it was available only for 102 countries.
Instead, the variable percentage of rural population with
access to clean water was included as a proxy of absolute poverty (allowing 157 observations).
Finally, the data for the year 2004 on the total DALYs
and the DALYs for each of the three groups of diseases
associated with the burden of disease (i.e. communicable, non-communicable and injuries) were obtained
from the WHO Health Statistics and Health Information
Systems web site [37]. These data represented an update
[38] of the previous global burden of disease analysis
[39]. In order to be consistent with the inclusion of a
variable, in terms of density per 1000 people, the total
DALYs of each category were converted into DALYs
per 1000 people using the data on population presented
along with the burden of disease data.
The econometric analysis consists of two sets of
regression equations with a semi-log functional form.
Following Anand and Bärnighausen [21,22], the first set
of regressions considers, as an independent variable, the
density per 1000 populations for the three categories of
health workers aggregated (i.e. physicians, nurses, and
midwives). On the other hand, the second set considers
the health workers as two different independent variables: the density of physicians and the density of the
aggregation of nurses and midwives.
The dependent variables in both sets of equations are
the total DALYs per 1000 people and the DALYs per
1000 people for each of the three aforementioned groups
of diseases. Considering the limited availability of data
for the socioeconomic variables, three different models
were estimated for each of the dependent variables; the
first one just includes the GDP per capita, the second
one includes the GDP and the income distribution variables (GINI and income share held by the lowest 10%),
and the third one includes the GDP and the percentage
of rural population with access to clear water.
Finally, the variable ‘skill mix’ was created as the ratio
between the number of physicians and the number of
nurses and midwives. This variable was included in all
the models as a way to capture the effect of the skill
mix on the burden of disease. The ‘skill mix-squared’
term was created as the square of the variable ‘skill mix’
and was also included in all the models in order to test
it for the concavity of the skill mix effect.
The following equations are examples of all the multiple regressions estimated for the dependent variable
DALYij, with i the group of disease (0: total; 1: communicable; 2: non-communicable; 3: injuries) and j the
country:
Page 5 of 11
Health workers
0 + 1 ⋅ Health _ Workers j + 2 ⋅ GDP j +
ln(DALYij ) = 3 ⋅ Health _ expenditure _ % _ GDP j +
4 ⋅ Skill _ Mix j + 5 ⋅ Skill _ Mix − Sq j
0 + 1 ⋅ Health _ Workers j + 2 ⋅ GDP j +
ln(DALYij ) = 3 ⋅ Health _ expenditure _ % _ GDP j +
4 ⋅ Skill _ Mix j + 5 ⋅ Skill _ Mix − Sq j +
6 ⋅ GINI j + 7 ⋅ Income _ share _ lowest _ 10% j
0 + 1 ⋅ Health _ Workers j + 2 ⋅ GDP j
ln(DALYij ) = 3 ⋅ Health _ expenditure _ % _ GDP j +
4 ⋅ Skill _ Mix j + 5 ⋅ Skill _ Mix − Sq j +
6 ⋅ % rural _ population _ access _ clean _ water
0 + 1 ⋅ Physicians j + 2 ⋅ Nurses _ and _ midwives +
ln(DALYij ) = 3 ⋅ GDP j + 4 ⋅ Health _ expenditure _ % _ GDP j +
5 ⋅ Skill _ Mix j + 6 ⋅ Skill _ Mix − Sq j
0 + 1 ⋅ Physicians j + 2 ⋅ Nurses _ and _ midwives +
ln(DALYij ) = 3 ⋅ GDP j + 4 ⋅ Health _ expenditure _ % _ GDP j +
5 ⋅ Skill _ Mix j + 6 ⋅ Skill _ Mix − Sq j + 7 ⋅ GINI +
8 ⋅ Income _ share _ lowest _ 10%
0 + 1 ⋅ Physicians j + 2 ⋅ Nurses _ and _ midwives +
ln(DALYij ) = 3 ⋅ GDP j + 4 ⋅ Health _ expenditure _ % _ GDP j +
5 ⋅ Skill _ Mix j + 6 ⋅ Skill _ Mix − Sq j +
7 ⋅ % rural _ population _ access _ clean _ water
0 + 1 ⋅ Health _ Wor ker s j + 2 ⋅ GDP j
ln(DALYij ) =
3 ⋅ Health _ exp enditure _ % _ GDP j +
+ 4 ⋅ Skill _ Mix j + 5 ⋅ Skill _ Mix − Sq j +
6 ⋅ % rural _ population _ access _ clean _ water
Physicians/nurses and midwives
0 + 1 ⋅ Physicians j + 2 ⋅ Nurses _ and _ midwives +
ln(DALYij ) = 3 ⋅ GDP j + 4 ⋅ Health _ exp enditure _ % _ GDP j +
5 ⋅ Skill _ Mix j + 6 ⋅ Skill _ Mix − Sq j
0 + 1 ⋅ Physicians j + 2 ⋅ Nurses _ and _ midwives +
ln(DALYij ) =
3 ⋅ GDP j + 4 ⋅ Health _ exp enditure _ % _ GDP j +
5 ⋅ Skill _ Mix j + 6 ⋅ Skill _ Mix − Sq j + 7 ⋅ GINI +
8 ⋅ Income _ share _ lowest _ 10%
0 + 1 ⋅ Physicians j + 2 ⋅ Nurses _ and _ midwives +
ln(DALYij ) =
3 ⋅ GDP j + 4 ⋅ Health _ exp enditure _ % _ GDP j +
5 ⋅ Skill _ Mix j + 6 ⋅ Skill _ Mix − Sq j +
7 ⋅ % rural _ population _ access _ clean _ water
Results
The additional file 2 shows the statistical description (i.e.
number of observation, mean, standard deviation, minimum and maximum) of each one of the dependent and
Castillo-Laborde Human Resources for Health 2011, 9:4
/>
Page 6 of 11
independent variables in general and also separated by
WHO region.
All the variables present wide ranges of values, showing the great heterogeneity throughout the countries
included in the analysis. For instance, the density of
health workers varies between 0.25 (Niger) and 22.4
(Ireland) per 1000 populations, while the number of
physicians per 1000 populations goes from 0.02
(Malawi) to 5.9 (Cuba). Furthermore, although on average a country has 0.63 physician per nurse or midwife,
when looking to the extremes this number can vary
between 0.02 (Swaziland) to 27.54 (The Netherlands)
physicians per nurse or midwife.
On the other hand, the differences in terms of burden
of disease are also dramatic, from a country with a burden of disease of less than 100 DALYs per 1000 populations (Iceland) to a country that presents a burden of
disease almost nine times higher (i.e. 824 DALYs per
1000 populations in Sierra Leone). The same significant
differences throughout the countries are observed for
the rest of the variables (i.e. health expenditure as percentage GDP, GDP, GINI, income share held by the
lowest 10%, and percentage of rural population with
access to clean water).
Not surprisingly, when we focus on the regional level,
although differences persist within regions, the differences throughout the regions are now much more evident. In general, the most developed regions have better
indicators than the regions that consist of the poorest
countries (i.e. higher density of health professionals and
lower burden of disease). Furthermore, the uneven distribution of health professionals, highly documented in
the literature, becomes manifest when we consider that
the average density of health workers in Africa is just
1.58 per 1000 while in Europe it is 10.78 per 1000.
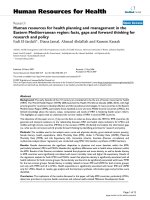
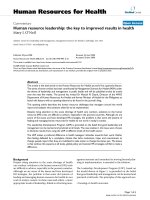
Figure 1 presents the relationship between the health
workers and the DALYs for the countries included in
DALYs per 1000 population
DALYs and health workforce
900
800
700
600
500
400
300
200
100
0
0
5
10
15
Health workforce
Figure 1 DALYs and health workers.
20
25
the analysis. It is clearly appreciated from the graph that
countries with lower relative need (i.e. burden of disease) are actually the countries with a higher number of
health professionals. This negative relationship has also
been presented in the literature as one of the strong
arguments that support the urgent need of scaling up
the health workforce [17]. However, this presentation
has always been descriptive, therefore the average marginal contribution of an extra health worker in terms of
DALY reduction has not been analysed quantitatively.
The present study represents a first attempt to measure
this relationship.
The Additional file 3 presents the results of the multiple regressions described in the previous section.
In the first set of equations, when we consider the
total DALYs (i.e. DALY 0 ) as the dependent variable,
the results show a negative and a significant effect for
the health workers (at 15% in the regression including
percentage of access to clean water), the GDP and the
Skill Mix. On the other hand, the ‘skill mix-squared’ had
a positive and a significant effect, the percentage of rural
population with access to clean water had a negative
and a significant effect, while the variables accounting
for income distribution (i.e. GINI and income share
held by lowest 10%) and health expenditure as percentage of GDP resulted in being not significant. In the second set of equations for the total DALYs, when we
consider the models including just GDP as the socioeconomic variable of control and the one including the
variables controlling for socioeconomic inequalities,
the results show a negative and a significant effect for
the variable ‘physicians’. However, the ‘physicians’ variable was found to be not significant in the model controlling for access to clean water. In the three models
the variable ‘nurses and midwives’ was found not to be
significant. The sign and the significance of the coefficients for the rest of the variables were the same as in
the first set of equations.
In terms of the disaggregation of the dependent variable the results are different depending on the groups of
diseases. The coefficients obtained for the group of
communicable diseases (i.e. DALY 1 as the dependent
variable) were similar in sign and in significance to the
coefficients for the aforementioned total DALYs for the
two sets of equations. The only exceptions were the
coefficient for ‘health workers and physicians’, which
was negative and significant (at 5%), and the coefficient
for the variable GINI which, in the case of this particular group of diseases, was found to be positive and
significant.
The findings for the other two groups (i.e. non communicable diseases and injuries) are totally different, not
only in terms of significance but surprisingly also in
terms of sign. The coefficients for the variables related
Castillo-Laborde Human Resources for Health 2011, 9:4
/>
Page 7 of 11
but as the percentage changes in the dependent variable
following a unit change in the independent variable.
Considering this, an increase of one unit in the density
of health workers per 1000 will decrease, on average,
the total burden of disease between 1% and 3%.
Focusing on the group of communicable diseases,
which presented the most consistent pattern of results,
the health workers seem to play an even more important role. An increase of one unit in the density of
health workers per 1000 will decrease, on average, the
DALYs associated to this group of diseases between 10%
and 15%. Moreover, if the density of physicians per
1000 populations is the one which increases in one unit,
the effect is even higher (i.e. between 30 and 45%).
The choice of the functional form may be subject to
discussion. Although most of the previous articles state
the use of some kind of linear functional form (e.g.
log-linear, arcsin-log), and the ones including vaccine
coverage or coverage with skilled birth attendants use a
logit-log form, the present study opted for the semi-log
functional form. The election of a semi-log functional
form relies on the idea that the relationship between the
independent variables included in the analysis and in
the DALYs is not linear. On the other hand, the logitlog forms are appropriate in the case of variables
accounting for coverage due to the scale from 0 to
100%, but this is not the case of the DALYs per 1000
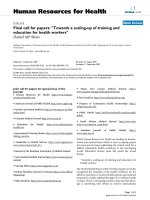
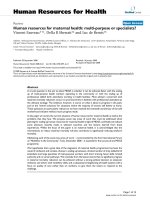
variables. The Figure 2 shows a graphic representation
of the relationship between the dependent variables for
the different models (i.e. DALY 0, DALY1 , DALY2 and
DALY3) and the measures of health workers. The graphics show an exponential relationship between them,
the main exception being the relationship between the
to human resources are more erratic and less consistent
between models than in the case of total DALYs, and
the DALYs associated with communicable diseases as
dependent variables. In all the cases, the variables
accounting for ‘health workers and physicians’ presented
a positive and a significant effect on the DALYs associated with non-communicable diseases. On the other
hand, when we considered the DALYs related to injuries, the coefficient for ‘health workers’ was negative and
significant in one of the models of the first set of equations, while the coefficient for ‘physicians’ resulted in
being negative and significant in two of the models, the
exception being the model controlling for the percentage of rural population with access to clean water (i.e.
with a not significant effect).
For the groups of DALYs related to non-communicable
diseases and injuries, the coefficients for the variables
‘skill mix’ and ‘skill mix-squared’ was found to be not
significant at 5% for any of the models, the same
occurred in the case of the variables ‘health expenditure
as percentage of GDP’ and ‘income share held by the
lowest 10%’. The percentage of rural population with
access to clean water resulted in being negative and
significant in the two models for the DALYs associated
to injuries. The only variable which presented a significant and a consistent behaviour in all the models for
these two groups was GDP (i.e. negative in all the cases).
Discussion
In terms of the strength of the relationship between
human resources for health and burden of disease, as
the functional form of the equations was semi-log, the
coefficients cannot be interpreted directly as elasticities,
DALYs and Health workers
5
10
15
20
900
800
700
600
500
400
300
200
100
0
25
DALYs per 1000 population
900
800
700
600
500
400
300
200
100
0
0
0
2
Health workforce
15
0
8
20
25
200
150
100
50
0
5
10
15
Health workers (density)
Figure 2 DALYs and health workers (aggregated and disaggregated).
10
15
20
25
Group III: DALYs and Health workers
250
0
5
Nurses and Midwifes (density)
DALYs per 1000 population
DALYs per 1000 population
DALYs per 1000 population
10
Health workers (density)
6
Group II: DALYs and Health workers
700
600
500
400
300
200
100
0
5
4
900
800
700
600
500
400
300
200
100
0
Physicians (density)
Group I: DALYs and Health workers
0
DALYs and Nurses and Midwifes
DALYs and Physicians
DALYs per 1000 population
DALYs per 1000 population
6
20
25
250
200
150
100
50
0
0
5
10
15
Health workers (density)
20
25
Castillo-Laborde Human Resources for Health 2011, 9:4
/>
DALYs in the group of non-communicable diseases and
health workers.
The aggregate analysis shows that health workers are
an important determinant of health outcomes. Even
when the functional forms and the health outcomes
considered are not necessarily the same, this result is in
accordance with previous findings, stating that health
workers significantly affect immunisation coverage,
infant and under-5 mortality, and the other health outcomes. The main finding presented in this article is that
the positive and significant relationship between human
resources and health outcomes can be extended to a
much broader measure of population health (i.e.
DALYs), and that this relationship may follow different
patterns according to the different groups of diseases.
The density of nurses and midwives is found to be not
significant in most of the models. The same results are
presented by Robinson and Wharrad [23] when they
measured the relationship between infant and under-5
mortality rates, and the density of nurses. Later Robinson and Wharrad [24] considered attendance at birth
and maternal mortality rates. This effect is what the
authors called ‘invisible nurses’. Anand and Bärninghausen [22], assessing the relationship between nurses and
maternal, infant and under-five mortality, found that
nurses were significantly associated just with maternal
mortality.
The importance of physicians, in contrast to nurses
and midwives in the reduction of the burden of disease,
is also reaffirmed by the significant and the negative
relationship between the independent variable ‘skill mix’
and the dependent variables ‘total DALYs’ and ‘DALYs
related to communicable diseases’. The variable was
constructed as the ratio between physicians, nurses, and
midwives. Therefore, a negative coefficient implies that
the higher the number of physicians, in relation to the
number of nurses and midwives, the greater the reduction of DALYs. However, the fact that ‘skill mix-squared’
presented a positive and a significant association with
the total DALYs and DALYs associated with communicable diseases confirms the concavity of the relationship
between the DALYs and the ratio physicians/nurses and
midwifes, meaning that despite increasing, it increases at
a decreasing rate.
As Robinson and Wharrad stated [[24], p.452], the
danger related to the ‘invisibility’ of nurses in the econometric analysis is its contribution ‘to the perceived dominance of medicine in the social construction of health
services worldwide’, underestimating the independent
contribution to health care of nursing and midwifery.
The article suggests that this is maybe because the quality of the data on these cadres and the ambiguity about
the definition of ‘registered nurse’. Although the data
used in the present study are the best data available, as
Page 8 of 11
the processes of collection and homogenisation of data
are improving every day, further studies will be able to
reassess this finding.
The variable GDP per capita (measured in terms of
purchasing power parity) was included in order to capture the effect of socioeconomic determinants of health.
It resulted to be the most consistently significant variable, showing, as mentioned in the previous section,
that health can be affected by factors beyond the health
care system. However, Robinson and Wharrad [[23],
p.36] state that ‘the use of GDP per capita as a measure
of a country’s wealth has several limitations’, for
instance it does not take into account the degree of
equity in the distribution of this wealth. The study, trying to overcome this deficiency, included two dependent
variables in order to control for income distribution (i.e.
‘GINI’ and ‘income share held by the lowest 10%’). However, these variables did not present a significant relationship with the burden of disease, the only exceptions
being the coefficients for the variable GINI when the
dependent variables were DALYs associated to communicable and non-communicable diseases, though the
effects were opposite (negative and positive respectively).
Therefore, the income distribution seems not to have a
consistent effect on the burden of disease while the
income does have a strong impact. However, this result
should be considered cautiously because about fifty
countries, mostly developing countries, were excluded
from the analysis (see additional file 1). The fact that
income distribution, regardless of the exclusion of many
countries from the sample, still has a negative impact
on the group of communicable is an interesting finding,
probably also related to the particularities of this group
of diseases (e.g. affecting more poor countries; access to
immunization probably related to income distribution).
As an alternative to the models including the income
distribution variables, the third type of model included
the variable ‘percentage of rural population with access
to clean water’ as a proxy of absolute poverty. When
included, the effect of the variable on total DALYs (and
DALYs related to the different groups of diseases)
always resulted in being negative and significant. This
finding shows, as well as with the GDP, the influence of
variables beyond the health system on the burden of disease. Furthermore, the inclusion of this proxy of absolute poverty allows us to consider a socioeconomic
variable for a larger sample of countries, avoiding the
aforementioned possible bias regarding the non availability of socioeconomic inequality data for an important
number of countries.
The variable ‘health expenditure’ as percentage of
GDP was included as a way to take into account the
health system capacity, but it was consistently found to
be not significant. In other words, how much of the
Castillo-Laborde Human Resources for Health 2011, 9:4
/>
DALYs and Health workers
DALYs per 1000 population
900
800
700
600
500
400
300
200
100
0
0
5
10
15
20
25
Health workforce
Birth attended by skilled staff
Birth attended by skilled staff and Health
workers
120
100
80
60
40
20
0
0
5
10
15
20
25
Health workers (density)
Inmunisation and Health workforce
120
Inmunisation (coverage)
total national income is going to health care does not
affect population health. As health workers generally
account for the most important part of the health budget and variables accounting for health workers and the
variable GDP are also included, one possible explanation
for the insignificance of the health expenditure as percentage of the GDP could be the multicollinearity. However, the variance inflation factor (VIF) analysis showed
that the multicollinearity is not a problem in this case
(VIF is lower than 2 for the specific variable and means
that VIF is lower than 10 on average considering all the
models).
The use of DALYs can be criticised as the dependent
variable. One of the main disadvantages of DALYs is all
the requirements for the estimation. For instance, mortality rates, prevalences and incidences related to specific
causes and groups of age, which are not available for all
the countries (especially developing countries), should
be estimated. On the other hand, there are also assumptions made on the constructions of the DALYs, like the
use of a discount rate (and which one to use) or the
inclusion of age weights that may change the results
obtained. Despite certain criticisms, the methodology
used to estimate the DALYs has been improved, and the
data used in this study correspond to an update of the
previous estimation for the year 2004, with more recent
registration data, improvements in methods used to estimate the parameters in countries with unavailable data,
and estimations based on epidemiological studies, diseases registers, etc. What is obtained from the briefly
aforementioned methodologies is a more comprehensive
indicator of health (comparable between regions and
countries), as it includes not only mortality but also disability; considering diseases that may not be captured
for the health outcomes which were considered in the
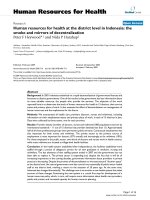
other studies. Furthermore, the ‘variables such as ‘coverage of immunization’ or ‘coverage of skilled birth attendants’ as dependent variables have a limit of 100% (see
Figure 3) and they could be considered as disadvantage
in the case of a cross-sectional analysis. As many countries reached the maximum possible coverage several
years ago and the cross-sectional analysis does not take
into account lagged relationships, the association
between the variables may be weakened. Although the
same argument might be applied in the case of DALYs,
as burden of disease, in theory, it does not have a limit
(below zero): it can always be diminished, even if it is at
a decreasing rate.
It was mentioned before that various assumptions are
made when we estimate the DALYs. It would be interesting to replicate the analysis proposed by this study
considering different sensitivities for DALYs (e.g. discount rate different to 3% or not considering age
weights) in order to check them if the results change
Page 9 of 11
100
80
60
40
20
0
0
5
10
15
20
25
Health Workforce (density)
Figure 3 Health outcomes and health workers.
when the assumptions made on the calculations of
DALYs change. However, the data on these different
sensitivities are not publicly available at the country
level, but just at the regional or groups of income level.
Although the results in terms of significance and direction (i.e. sign) of the relationship between human
resources and burden of disease were mainly in accordance with what was expected, especially considering the
group of communicable diseases, one interesting finding
of the study is the completely different behaviour of the
models considering DALYs for non-communicable
Castillo-Laborde Human Resources for Health 2011, 9:4
/>
diseases and injuries as dependent variables. This can
probably be explained because of the different nature of
the three groups of conditions and also because of the
totally different composition of the burden of disease
throughout different countries. While non-communicable are the most important causes in developed countries, in developing countries communicable diseases are
still the most important. On the other hand, it is intuitively easy to find a link between health care (i.e. health
workers) and communicable diseases, but when considering non-communicable diseases or injuries the link
appears to be less intuitive and other variables such as
life style or existence of specific risk factors in the population arise and take a place into the story.
It is likely, due to the limited availability of data, that
some variables have been omitted from the models,
especially in the case of the models for the dependent
variables for the groups II and III of diseases (i.e. noncommunicable and injuries). In these two particular
cases, the existence of omitted variables (e.g. life styles
and existence of risk factors) may be a possible explanation for the inconsistent results obtained in this study.
Further studies are necessary in this area, either to find
reasonable explanations for this finding or to improve
the methodology in order to find a better model to
assess the relationship between health workers and burden of disease related to non-communicable diseases
and injuries.
Even though the study presents the limitations mentioned throughout this section (e.g. cross-sectional analysis, availability of data, functional form, and omitted
variables) and the results must be interpreted cautiously,
it represents a first attempt to relate a broader concept
of health to human resources of health. Further
researches with improved methodologies are necessary
to generate empirical support in order to define most
accurate policies in this area.
Conclusion
The relationship between human resources for health
and health outcomes has been analysed mostly considering specific health outcomes such as mortality rate, coverage of vaccination or skilled birth attendance. The
effect of health workers on health has been proven to be
important for all of the outcomes analysed in the literature, particularly the effect of physicians on health.
However, health represents a much broader concept; it
includes not only mortality but also morbidity, and not
only preventive but also curative or improving quality of
life interventions. In this context, the analysis of the
relationship between health workers and DALYs represents the first attempt at measuring the link between
human resources for health and a more comprehensive
health outcome.
Page 10 of 11
This study presents evidence of a statistically negative
relationship between the density of health workers (specifically physicians) and the burden of disease when controlling for income and income distribution variables. In
terms of magnitudes, an increase of one unit in the density of health workers per 1000 will decrease, on average, the total burden of disease between 1% and 3%. In
the case of the density of physicians the impact is even
higher: an increase in one unit of this density can
decrease, on average, the total DALYs by about 10%. In
the case of nursing and midwifery, the findings are that,
in accordance with previous articles, the density of these
professionals does not affect the DALYs.
The analysis of the three groups of burden of disease
showed that the only group that presents the same
behaviour as total DALYs, in terms of significance and
sign of the coefficients (while the magnitude of the
effects are higher), is the group of communicable diseases. For the two other groups, health workers were
found not to be significant, even showing the opposite
sign (i.e. positive association between health workers
and DALYs).
In summary, if countries increase health worker density, they will be able to reduce significantly their burden
of disease, especially in the case of communicable diseases. The findings of the study have implications not
only for health and health policy, but also for research.
They represent supporting evidence of the importance
of health workers for health, and therefore they contribute to the development of policies in this area. Furthermore, the study limitations, as well as the unexpected
results for some of the variables, encourage future
research to improve methodologies and analysis.
Additional material
Additional file 1: Variables and countries with unavailable data.
Additional file 2: Statistical description (i.e. number of observation,
mean, standard deviation, minimum and maximum) of each one of
the dependent and independent variables in general and also
separated by WHO region.
Additional file 3: The results of the multiple regressions. Notes: [_]
Standard error; (*) Significant at 5%; (**) Significant at 10%; (***)
Significant at 15%
Acknowledgements
The author would like to thank Mario Dal Poz for his support during the
internship at the Department of Human Resources for Health (WHO). This
research was conducted during this period as the final essay of the LSE
Program MSc. in International Health Policy (Health Economics).
Competing interests
The authors declare that they have no competing interests.
Received: 5 March 2010 Accepted: 26 January 2011
Published: 26 January 2011
Castillo-Laborde Human Resources for Health 2011, 9:4
/>
References
1. Gupta N, Dal Poz M: Assessment of human resources for health using
cross-national comparison of facility surveys in six countries. Human
Resources for Health 2009, 7:22.
2. The World Health Report 2006: Working together for health. Geneva:
World Health Organization; 2006.
3. Hongoro Ch, McPake B: How to bridge the gap in human resources for
health. The Lancet 2004, 364:1451-1456.
4. Narasimhan V, Brown H, Pablos-Mendez A, Adams O, Dussault G, Elzinga G,
Nordstrom A, Habte D, Jacobs M, Solimano G, Sewankambo N,
Wibulpolprasert S, Evans T, Chen L: Responding to the Global Human
Resources Crisis. The Lancet 2004, 363:1469-1472.
5. Chen L, Evans T, Anand S, Boufford JI, Brown H, Chowdhury M, Cueto M,
Dare L, Dussault G, Elzinga G, Fee E, Habte D, Hanvoravongchai P,
Jacobs M, Kurowski C, Michael S, Pablos-Mendez A, Sewankambo N,
Solimano G, Stilwell B, de Waal A, Wibulpolprasert S: Human Resources for
Health: overcoming the crisis. The Lancet 2004, 364:1984-1990.
6. Speybroeck N, Ebener S, Sousa A, Paraje G, Evans D, Prasad A: Inequality in
access to human resources for health: measurement issues. Geneva:
World Health Organization; 2006 [ />whr06_background_papers/en/index.html], (background paper for The
World Health Report 2006).
7. Dussault G, Dubois CA: Human resources for health policies: a critical
component in health policies. Human Resources for Health 2003, 1:1.
8. Dräger S, Dal Poz M, Evans D: Health workers wages: an overview from
selected countries. Geneva: World Health Organization; 2006 [http://www.
who.int/hrh/documents/whr06_background_papers/en/index.html],
(background paper for The World Health Report 2006.
9. Vujicic M, Zurn P, Diallo K, Adams O, Dal Poz M: The role of wages in the
migration of health care professionals from developing countries.
Human Resources for Health 2004, 2:3.
10. Scheffler R, Liu JX, Kinfu Y, Dal Poz M: Forecasting the global shortage of
physicians: an economic- and needs-based approach. Bulletin of the
World Health Organization 2008, 86(7):516-523.
11. Dovlo D: Using mid level cadres as substitutes for internationally mobile
health professionals in Africa. A desk review. Human Resources for Health
2004, 2:7.
12. Lehmann U, Van Damme W, Barten F, Sanders D: Task shifting: the answer
to the human resources crisis in Africa? Human Resources for Health 2009,
7:49.
13. Buchan J, Dal Poz M: Skill mix in the health care workforce: reviewing
the evidence. Bulletin of the World Health Organization 2002, 80(7):575-580.
14. WHO Human Resources for Health Minimum Data Set. Geneva 2008.
15. World Health Organization. World Health Statistics 2009. Health
workforce, infrastructure, essential medicines. Table 6. [.
int/whosis/whostat/EN_WHS09_Table6.pdf].
16. Speybroeck N, Kinfu Y, Dal Poz M, Evans D: Reassessing the relationship
between human resources for health, intervention coverage and health
outcomes. Geneva: World Health Organization; 2006 [ />hrh/documents/whr06_background_papers/en/index.html], (background
paper for The World Health Report 2006).
17. Scaling up health workforce production: a concept paper towards the
implementation of World Health Assembly resolution WHZ59.23.
Geneva: World Health Organization; 2006.
18. Scheffler R, Mahoney C, Fulton B, Dal Poz M, Preker A: Estimates of Health
Care Professional Shortages in Sub Saharan Africa by 2015. Health Affairs
2009, 28(5):849-862.
19. Diallo K, Zurn P, Gupta N, Dal Poz M: Monitoring and evaluation of
human resources for health: an international perspective. Human
Resources for Health 2003, 1:3.
20. Smith PC, Mossialos E, Papanicolas : Performance measurement for health
system improvement: experiences, challenges and prospects. Denmark:
World Health Organization Europe; 2008.
21. Anand S, Bärnighausen T: Health workers and vaccination coverage in
developing countries: an econometric analysis. The Lancet 2007,
369:1277-1285.
22. Anand S, Bärnighausen T: Human resources and health outcomes: crosscountry econometric study. The Lancet 2004, 364:1603-1609.
23. Robinson J, Wharrad H: Invisible nursing: exploring health outcomes at a
global level–relationships between infant and under-5 mortality rates
Page 11 of 11
24.
25.
26.
27.
28.
29.
30.
31.
32.
33.
34.
35.
36.
37.
38.
39.
and the distribution of health professionals, GNP per capita, and female
literacy. Journal of Advanced Nursing 2000, 32(1):28-40.
Robinson J, Wharrad H: The relationship between attendance at birth
and maternal mortality rates: an exploration of United Nations’ data sets
including the ratios of physicians and nurses to population, GNP per
capita and female literacy. Journal of Advanced Nursing 2001,
34(4):445-455.
Kim K, Moody PM: More resources better health? A cross-national
perspective. Social Science and Medicine 1992, 34(8):837-842.
Hertz E, Hebert JR, Landon J: Social and environmental factors and life
expectancy, infant mortality, and maternal mortality rates: results of a
cross-national comparison. Social Science and Medicine 1994, 39:105-114.
Cochrane AL, St Leger AS, Moore F: Health service ‘input’ and mortality
‘output’ in developed countries. Journal of Epidemiology and Community
Health 1997, 51:344-348.
Nolte E, Bain C, McKee M: Population Health. In Performance Measurement
for Health System Improvement: Experiences, Challenges and Prospects. 1
edition. Edited by: Smith PC, Mossialos E, Leatherman S, Papanicolas I.
Cambridge: Cambridge University Press; 2009:27-62.
Social determinants of health: the solid facts. Edited by: Wilkinson R,
Marmot M. Denmark: World Health Organization Europe; , 2 2003.
Marmot M: Social determinants of health inequalities. The Lancet 2005,
365:1099-1104.
Dal Poz M, Kinfu Y, Drager S, Kunjumen T: Counting health workers:
definitions, data, methods and global results. Geneva: World Health
Organization; 2006 [ />whr06_background_papers/en/index.html], (background paper for The
World Health Report 2006).
Global Health Atlas. [ />Xu K, Evans D, Kawabata K, Zeramdini R, Klavus J, Murray C: Household
catastrophic health expenditure: a multicountry analysis. The Lancet 2003,
362:111-117.
World Economic Outlook Database. 2004 [ />pubs/ft/weo/2004/02/data/dbginim.cfm].
World Development Indicators. Improved water source, rural (% of rural
population with access). [ />RU.ZS].
2007 World Development Indicators. Distribution of Income or
Consumption. Table 2.7. [ />DATASTATISTICS/Resources/table2_7.pdf].
Health Statistics and Health Information Systems. Death and DALY
estimates for 2004 by cause for WHO Member States. [.
int/healthinfo/global_burden_disease/estimates_country/en/index.html].
The Global Burden of Disease: Geneva: World Health Organization; 2008,
2004 Update.
Global burden of disease and risk factors:Edited by: Lopez AD, Mathers CD,
Ezzati M, Jamison DT, Murray CJL. New York, Washington, DC: Oxford
University Press; World Bank; 2006.
doi:10.1186/1478-4491-9-4
Cite this article as: Castillo-Laborde: Human resources for health and
burden of disease: an econometric approach. Human Resources for Health
2011 9:4.
Submit your next manuscript to BioMed Central
and take full advantage of:
• Convenient online submission
• Thorough peer review
• No space constraints or color figure charges
• Immediate publication on acceptance
• Inclusion in PubMed, CAS, Scopus and Google Scholar
• Research which is freely available for redistribution
Submit your manuscript at
www.biomedcentral.com/submit