– THE GRE QUANTITATIVE SECTION – The area of a sector is found in a similar way to finding the pptx
Bạn đang xem bản rút gọn của tài liệu. Xem và tải ngay bản đầy đủ của tài liệu tại đây (361.61 KB, 25 trang )
– THE GRE QUANTITATIVE SECTION–
191
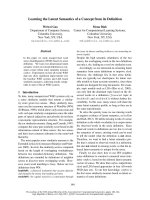
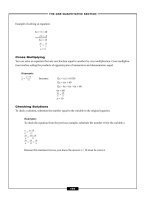
The area of a sector is found in a similar way to finding the length of an arc. To find the area of a sector, sim-
ply multiply the area of a circle, πr
2
, by the fraction
ᎏ
36
x
0
ᎏ
, again using x as the degree measure of the central angle.
Example:
Given x = 60
º
and r = 8, find the area of the sector:
A =
ᎏ
3
6
6
0
0
ᎏ
ϫ (
)8
2
A =
ᎏ
1
6
ᎏ
ϫ 64(
)
A =
ᎏ
6
6
4
ᎏ
(
)
A =
ᎏ
3
2
2
ᎏ
(
)
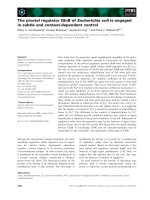
Polygons and Parallelograms
A polygon is a closed figure with three or more sides.
TERMS RELATED TO POLYGONS
■
Ve rt ice s are corner points, also called endpoints, of a polygon. The vertices in the previous polygon are
A, B, C, D, E, and F.
■
A diagonal of a polygon is a line segment between two nonadjacent vertices. The two diagonals indi-
cated in the previous polygon are line segments BF and AE.
■
A regular (or equilateral) polygon’s sides are all equal.
■
An equiangular polygon’s angles are all equal.
FE
D
C
B
A
r
x
r
o
– THE GRE QUANTITATIVE SECTION–
192
ANGLES OF A
QUADRILATERAL
A quadrilateral is a four-sided polygon. Since a quadrilateral can be divided by a diagonal into two trian-
gles, the sum of its angles will equal 180 + 180 = 360 degrees.
INTERIOR ANGLES
To find the sum of the interior angles of any polygon, use this formula:
S = 180(x – 2)
where x is the number of polygon sides.
Example:
Find the sum of the angles in the following polygon.
S = (5 – 2) ϫ 180
S = 3 ϫ 180
S = 540
EXTERIOR ANGLES
Similar to the exterior angles of a triangle, the sum of the exterior angles of any polygon equals 360 degrees.
5
1
2
3
4
1
2
3
4
m∠1 + m∠2 + m∠3 + m∠4 = 360°
SIMILAR POLYGONS
If two polygons are similar, their corresponding angles are equal and the ratio of the corresponding sides is
in proportion.
Example:
These two polygons are similar because their angles are equal and the ratio of the corresponding sides
is in proportion.
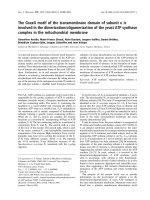
Parallelograms
A parallelogram is a quadrilateral with two pairs of parallel sides.
In this figure, A
ෆ
B
ෆ
ʈ C
ෆ
D
ෆ
and B
ෆ
C
ෆ
ʈ A
ෆ
D
ෆ
.
A parallelogram has the following characteristics:
■
Opposite sides are equal (AB = CD and BC = AD).
■
Opposite angles are equal (mЄA = mЄC and mЄB = mЄD).
■
Consecutive angles are supplementary (mЄA + mЄB = 180
º
,mЄB + mЄC = 180
º
,
mЄC + mЄD = 180
º
,mЄD + mЄA = 180
º
).
■
Diagonals bisect each other.
SPECIAL TYPES OF PARALLELOGRAMS
There are three types of special parallelograms:
■
A rectangle is a parallelogram that has four right angles.
D
A
B
C
60°
10
4
6
18
120°
60°
120°
5
2
3
9
– THE GRE QUANTITATIVE SECTION–
193
■
A rhombus is a parallelogram that has four equal sides.
■
A square is a paralleloram in which all angles are equal to 90 degrees and all sides are equal to each other.
DIAGONALS
In all parallelograms, diagonals cut each other in two equal halves.
■
In a rectangle, diagonals are the same length.
■
In a rhombus, diagonals intersect to form 90-degree angles.
DC
AB
AC = DB
D
CB
A
AB = BC = CD = DA
∠A = m∠B = m∠C = m∠D
m
D
C
B
A
AB = BC = CD = DA
D
A
B
C
AB = CD
BC =
AD
m∠A = m∠B = m∠C = m∠D
– THE GRE QUANTITATIVE SECTION–
194
■
In a square, diagonals have both the same length and intersect at 90-degree angles.
Solid Figures, Perimeter, and Area
You will need to know some basic formulas for finding area, perimeter, and volume on the GRE. It is impor-
tant that you can recognize the figures by their names and understand when to use which formula. To begin,
it is necessary to explain five kinds of measurement:
P
ERIMETER
The perimeter of an object is simply the sum of the lengths of all its sides.
6
7
4
10
Perimeter = 6 + 7 + 4 + 10 = 27
B
C
A
D
AC = DB
and
AC DB
B
C
A
D
BD AC
– THE GRE QUANTITATIVE SECTION–
195
AREA
Area is the space inside of the lines defining the shape.
You will need to know how to find the area of several geometric shapes and figures. The formulas needed
for each are listed here:
■
To find the area of a triangle, use the formula A =
ᎏ
1
2
ᎏ
bh.
■
To find the area of a circle, use the formula A =
r
2
.
■
To find the area of a parallelogram, use the formula A = bh.
■
To find the area of a rectangle, use the formula A = lw.
■
To find the area of a square, use the formula A = s
2
or A =
ᎏ
1
2
ᎏ
d
2
.
w
l
h
b
r
h
b
= Area
– THE GRE QUANTITATIVE SECTION–
196
■
To find the area of a trapezoid, use the formula A =
ᎏ
1
2
ᎏ
(b
1
+ b
2
)h.
V
OLUME
Volume is a measurement of a three-dimensional object such as a cube or a rectangular solid.An easy way to envi-
sion volume is to think about filling an object with water. The volume measures how much water can fit inside.
■
To find the volume of a rectangular solid, use the formula V = lwh.
■
To find the volume of a cube, use the formula V = e
3
.
e
e = edge
width
length
height
h
b
1
b
2
d
s
s
s
s
– THE GRE QUANTITATIVE SECTION–
197
■
To find the volume of a cylinder, use the formula V =
r
2
h.
SURFACE
AREA
The surface area of an object measures the combined area of each of its faces. The total surface area of a rec-
tangular solid is double the sum of the area of the three different faces. For a cube, simply multiply the sur-
face area of one of its sides by 6.
■
To find the surface area of a rectangular solid, use the formula A = 2(lw ϩ lh ϩ wh).
■
To find the surface area of a cube, use the formula A = 6e
2
.
e
e = edge
V = lwh
width
length
height
4
4
Surface area of front side = 16.
Therefore, the surface area
of the cube = 16 ϫ 6 = 96.
r
h
– THE GRE QUANTITATIVE SECTION–
198
■
To find the surface area of a right circular cylinder, use the formula A = 2
r
2
+ 2
rh.
CIRCUMFERENCE
Circumference is the measure of the distance around a circle.
■
To find the circumference of a circle, use the formula C = 2
r.
Coordinate Geometry
Coordinate geometry is a form of geometrical operations in relation to a coordinate plane. A coordinate plane
is a grid of square boxes divided into four quadrants by both a horizontal (x) and vertical (y) axis. These two
axes intersect at one coordinate point—(0,0)—the origin. A coordinate pair, also called an ordered pair, is a
specific point on the coordinate plane with the first number representing the horizontal placement and sec-
ond number representing the vertical. Coordinate points are given in the form of (x,y).
GRAPHING ORDERED PAIRS
To graph ordered pairs, follow these guidelines:
■
The x-coordinate is listed first in the ordered pair and tells you how many units to move either to the
left or to the right. If the x-coordinate is positive, move to the right. If the x-coordinate is negative,
move to the left.
■
The y-coordinate is listed second and tells you how many units to move up or down. If the y-coordinate
is positive, move up. If the y-coordinate is negative, move down.
Example:
Graph the following points: (–2,3), (2,3), (3,–2), and (–3,–2).
Circumference
– THE GRE QUANTITATIVE SECTION–
199
■
Notice that the graph is broken into four quadrants with one point plotted in each one. Here is a chart
to indicate which quadrants contain which ordered pairs, based on their signs:
LENGTHS OF HORIZONTAL AND VERTICAL SEGMENTS
Two points with the same y-coordinate lie on the same horizontal line, and two points with the same
x-coordinate lie on the same vertical line. Find the distance between a horizontal or vertical segment by
taking the absolute value of the difference of the two points.
Example:
Find the length of the line segment AB and the line segment BC.
Points
Sign of
Coordinates
Quadrant
(2,3)
(–2,3)
(–3,–2)
(3,–2)
(+,+)
(–,+)
(–,–)
(+,–)
I
II
III
IV
II
I
III IV
(−2,3) (2,3)
(−3,−2)
(3,−2)
– THE GRE QUANTITATIVE SECTION–
200
Solution:
| 2 – 7 | = 5 = AB
| 1 – 5 | = 4 = BC
DISTANCE OF COORDINATE POINTS
To fine the distance between two points, use this variation of the Pythagorean theorem:
d = ͙(x
2
– x
ෆ
1
)
2
+ (y
ෆ
2
– y
1
)
2
ෆ
Example:
Find the distance between points (2,3) and (1,–2).
Solution:
d = ͙(1 – 2)
ෆ
2
+ (–2
ෆ
– 3)
2
ෆ
d = ͙(1 + –2
ෆ
)
2
+ (–
ෆ
2 + –3
ෆ
)
2
ෆ
d = ͙(–1)
2
+
ෆ
(–5)
2
ෆ
d = ͙1 + 25
ෆ
d = ͙26
ෆ
(1,–2)
(2,3)
(2,1)
(7,5)
C
BA
(7,1)
– THE GRE QUANTITATIVE SECTION–
201
MIDPOINT
To find the midpoint of a segment, use the following formula:
Midpoint x =
ᎏ
x
1
+
2
x
2
ᎏ
Midpoint y =
ᎏ
y
1
+
2
y
2
ᎏ
Example:
Find the midpoint of the segment AB.
Solution:
Midpoint x =
ᎏ
1+
2
5
ᎏ
=
ᎏ
6
2
ᎏ
= 3 Midpoint y =
ᎏ
2+
2
10
ᎏ
=
ᎏ
1
2
2
ᎏ
= 6
Therefore the midpoint of A
–
B
—
is (3,6).
Slope
The slope of a line measures its steepness. It is found by writing the change in y-coordinates of any two points
on the line over the change of the corresponding x-coordinates. (This is also known as the rise over the run.)
The last step is to simplify the fraction that results.
Example:
Find the slope of a line containing the points (3,2) and (8,9).
(5,10)
Midpoint
(1,2)
B
A
– THE GRE QUANTITATIVE SECTION–
202
Solution:
ᎏ
9
8
–
–
2
3
ᎏ
=
ᎏ
7
5
ᎏ
Therefore, the slope of the line is
ᎏ
7
5
ᎏ
.
NOTE: If you know the slope and at least one point on a line, you can find the coordinate
point of other points on the line. Simply move the required units determined by the slope. In
the example above, from (8,9), given the slope
ᎏ
7
5
ᎏ
, move up seven units and to the right five
units. Another point on the line, thus, is (13,16).
IMPORTANT INFORMATION ABOUT SLOPE
The following are a few rules about slope that you should keep in mind:
■
A line that rises to the right has a positive slope and a line that falls to the right has a negative slope.
■
A horizontal line has a slope of 0 and a vertical line does not have a slope at all
—
it is undefined.
■
Parallel lines have equal slopes.
■
Perpendicular lines have slopes that are negative reciprocals.
Data Analysis Review
Many questions on the GRE will test your ability to analyze data. Analyzing data can be in the form of sta-
tistical analysis (as in using measures of central location), finding probability, and reading charts and graphs.
All these topics, and a few more, are covered in the following section. Don’t worry, you are almost done! This
is the last review section before practice problems. Sharpen your pencil and brush off your eraser one more
time before the fun begins. Next stop…statistical analysis!
(3,2)
(8,9)
– THE GRE QUANTITATIVE SECTION–
203
Measures of Central Location
Three important measures of central location will be tested on the GRE. The central location of a set of
numeric values is defined by the value that appears most frequently (the mode), the number that represents
the middle value (the median), and/or the average of all the values (the mean).
MEAN AND
MEDIAN
To find the average, or the mean, of a set of numbers, add all the numbers together and divide by the quan-
tity of numbers in the set.
Average =
ᎏ
nu
s
m
um
be
o
r
f
o
v
f
a
v
lu
al
e
u
s
es
ᎏ
Example:
Find the average of 9, 4, 7, 6, and 4.
ᎏ
9+4+7
5
+6+4
ᎏ
=
ᎏ
3
5
0
ᎏ
= 6
The denominator is 5 because there are 5 numbers in the set.
To find the median of a set of numbers, arrange the numbers in ascending order and find the middle
value.
■
If the set contains an odd number of elements, then simply choose the middle value.
Example:
Find the median of the number set: 1, 5, 3, 7, 2.
First, arrange the set in ascending order: 1, 2, 3, 5, 7.
Then, choose the middle value: 3.
The answer is 3.
■
If the set contains an even number of elements, simply average the two middle values.
Example:
Find the median of the number set: 1, 5, 3, 7, 2, 8.
First, arrange the set in ascending order: 1, 2, 3, 5, 7, 8.
Then, choose the middle values 3 and 5.
Find the average of the numbers
ᎏ
3+
2
5
ᎏ
= 4.
The answer is 4.
MODE
The mode of a set of numbers is the number that occurs the greatest number of times.
Example:
For the number set 1, 2, 5, 3, 4, 2, 3, 6, 3, 7, the number 3 is the mode because it occurs the most num-
ber of times.
– THE GRE QUANTITATIVE SECTION–
204
Measures of Dispersion
Measures of dispersion, or the spread of a number set, can be in many different forms. The two forms covered
on the GRE test are range and standard deviation.
RANGE
The range of a data set is the greatest measurement minus the least measurement. For example, given the fol-
lowing values: 5, 9, 14, 16, and 11, the range would be 16 – 5 = 11.
STANDARD
DEVIATION
As you can see, the range is affected by only the two most extreme values in the data set. Standard deviation
is a measure of dispersion that is affected by every measurement. To find the standard deviation of n meas-
urements, follow these steps:
1. First, find the mean of the measurements.
2. Subtract the mean from each measurement.
3. Square each of the differences.
4. Sum the square values.
5. Divide the sum by n.
6. Choose the nonnegative square root of the quotient.
Example:
When you find the standard deviation of a data set, you are finding the average distance from the mean
for the n measurements. It cannot be negative, and when two sets of measurements are compared, the larger
the standard deviation, the larger the dispersion.
x
6
7
7
9
15
16
x Ϫ 10
Ϫ4
Ϫ3
Ϫ3
Ϫ1
5
6
(x Ϫ 10)
2
16
9
9
1
25
36
96
STANDARD DEVIATION =
Ί
¯¯¯
96
6
= 4
In the first column, the mean is 10.
– THE GRE QUANTITATIVE SECTION–
205
FREQUENCY
DISTRIBUTION
The frequency distribution is essentially the number of times, or how frequently, a measurement appears in
a data set. It is represented by a chart like the one below. The x represents a measurement, and the f repre-
sents the number of times that measurement occurs.
To use the chart, simply list each measurement only once in the x column and then write how many
times it occurs in the f column.
For example, show the frequency distribution of the following data set that represents the number of
students enrolled in 15 classes at Middleton Technical Institute:
12, 10, 15, 10, 7, 13, 15, 12, 7, 13, 10, 10, 12, 7, 12
Be sure that the total number of measurements taken is equal to the total at the bottom of the frequency
distribution chart.
DATA REPRESENTATION AND INTERPRETATION
The GRE will test your ability to analyze graphs and tables. It is important to read each graph or table very
carefully before reading the question. This will help you process the information that is presented. It is
extremely important to read all the information presented, paying special attention to headings and units of
measure. On the next page is an overview of the types of graphs you will encounter.
Circle Graphs or Pie Charts
This type of graph is representative of a whole and is usually divided into percentages. Each section of the
chart represents a portion of the whole, and all of these sections added together will equal 100% of the whole.
x
f
total:
7
10
12
13
15
3
4
4
2
2
15
x
f
total:
– THE GRE QUANTITATIVE SECTION–
206
Bar Graphs
Bar graphs compare similar things by using different length bars to represent different values. On the GRE,
these graphs frequently contain differently shaded bars used to represent different elements. Therefore, it is
important to pay attention to both the size and shading of the graph.
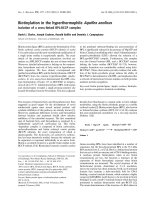
Broken-Line Graphs
Broken-line graphs illustrate a measurable change over time. If a line is slanted up, it represents an
increase, whereas a line sloping down represents a decrease. A flat line indicates no change as time elapses.
Increase
Decrease
No Change
Increase
Decrease
Change in Time
Unit of Measure
Comparison of Road Work Funds
of New York and California
1990–1995
New York
California
KEY
0
10
20
30
40
50
60
70
80
90
1991 1992 1993 1994 1995
Money Spent on New Road Work
in Millions of Dollars
Year
25%
40%
35%
– THE GRE QUANTITATIVE SECTION–
207
Percentage and Probability
Part of data analysis is being able to calculate and apply percentages and probability. Further review and exam-
ples of these two concepts are covered further in the following sections.
PERCENTAGE
PROBLEMS
There is one formula that is useful for solving the three types of percentage problems:
When reading a percentage problem, substitute the necessary information into the previous formula
based on the following:
■
100 is always written in the denominator of the percentage-sign column.
■
If given a percentage, write it in the numerator position of the number column. If you are not given a
percentage, then the variable should be placed there.
■
The denominator of the number column represents the number that is equal to the whole, or 100%.
This number always follows the word of in a word problem. For example: “ 13 of20 apples ”
■
The numerator of the number column represents the number that is the percent.
■
In the formula, the equal sign can be interchanged with the word is.
Example:
Finding a percentage of a given number:
What number is equal to 40% of 50?
Solve by cross multiplying.
100(x) = (40)(50)
100x = 2,000
ᎏ
1
1
0
0
0
0
x
ᎏ
=
ᎏ
2
1
,0
0
0
0
0
ᎏ
x = 20
Therefore, 20 is 40% of 50.
Example:
Finding a number when a percentage is given:
# %
__ = ___
50 100
40
x
# %
100
=
– THE GRE QUANTITATIVE SECTION–
208
40% of what number is 24?
Cross multiply:
(24)(100) = 40x
2,400 = 40x
ᎏ
2,
4
4
0
00
ᎏ
=
ᎏ
4
4
0
0
x
ᎏ
60 = x
Therefore, 40% of 60 is 24.
Example:
Finding what percentage one number is of another:
What percentage of 75 is 15?
Cross multiply:
15(100) ϭ (75)(x)
1,500 ϭ 75x
ᎏ
1,
7
5
5
00
ᎏ
ϭ
ᎏ
7
7
5
5
x
ᎏ
20 ϭ x
Therefore, 20% of 75 is 15.
Probability
Probability is expressed as a fraction; it measures the likelihood that a specific event will occur. To find the
probability of a specific outcome, use this formula:
Probability of an event =
Example:
If a bag contains 5 blue marbles, 3 red marbles, and 6 green marbles, find the probability of
selecting a red marble:
Probability of an event = =
ᎏ
5+
3
3+6
ᎏ
Therefore, the probability of selecting a red marble is
ᎏ
1
3
4
ᎏ
.
Number or specific outcomes
ᎏᎏᎏᎏ
Total number of possible outcomes
Number of specific outcomes
ᎏᎏᎏᎏ
Total number of possible outcomes
# %
__ = ___
75 100
x15
# %
__ = ___
x 100
40
24
– THE GRE QUANTITATIVE SECTION–
209
MULTIPLE
PROBABILITIES
To find the probability that two or more events will occur, add the probabilities of each. For example, in the
problem above, if we wanted to find the probability of drawing either a red or blue marble, we would add the
probabilities together.
The probability of drawing a red marble =
ᎏ
1
3
4
ᎏ
. And the probability of drawing a blue marble =
ᎏ
1
5
4
ᎏ
.
Add the two together:
ᎏ
1
3
4
ᎏ
+
ᎏ
1
5
4
ᎏ
=
ᎏ
1
8
4
ᎏ
=
ᎏ
4
7
ᎏ
.
So, the probability for selecting either a blue or a red would be 8 in 14, or 4 in 7.
Helpful Hints about Probability
■
If an event is certain to occur, the probability is 1.
■
If an event is certain not to occur, the probability is 0.
■
If you know the probability an event will occur, you can find the probability of the event not occurring
by subtracting the probability that the event will occur from 1.
Special Symbols Problems
The last topic to be covered is the concept of special symbol problems. The GRE will sometimes invent a new
arithmetic operation symbol. Don’t let this confuse you. These problems are generally very easy. Just pay atten-
tion to the placement of the variables and operations being performed.
Example:
Given a ⌬ b ϭ (a ϫ b ϩ 3)
2
, find the value of 1 ⌬ 2.
Solution:
Fill in the formula with 1 being equal to a and 2 being equal to b.
(1 ϫ 2 ϩ 3)
2
ϭ (2 ϩ 3)
2
ϭ (5)
2
ϭ 25. So, 1 ⌬ 2 ϭ 25.
Example:
Solution:
Fill in variables according to the placement of number in the triangular figure: a ϭ 1, b ϭ 2,
and c ϭ 3.
ᎏ
1–
3
2
ᎏ
+
ᎏ
1–
2
3
ᎏ
+
ᎏ
2–
1
3
ᎏ
=
ᎏ
–
3
1
ᎏ
+ –1 + –1 = –2
ᎏ
1
3
ᎏ
b
c
a
2
31
If =
_____
+
_____
+
____
_
a − b a − c b − c
c b a
Then what is the value of . . .
– THE GRE QUANTITATIVE SECTION–
210
Tips and Strategies for the Official Test
You are almost ready to begin practicing. But before you begin the practice problems, read through this sec-
tion to learn some tips and strategies for working with each problem type.
Quantitative Comparison Questions
■
It is not necessary to find the exact value of the two variables, and often, it is important not to waste
time doing so. It is important to use estimating, rounding, and the eliminating unnecessary informa-
tion to determine the relationship.
■
Attempt to make the two columns look as similar as possible. For example, make sure all units are equal.
This is similar to a strategy given in the problem solving section, and it is even more applicable here.
This is also true if one of the answer choices is a fraction or a decimal. If this is the case, make the other
answer into an improper fraction or a decimal, which ever is going to make the choices the most similar.
■
Eliminate any information the two columns share. This will leave you with an easier comparison. For exam-
ple, if you are given the two quantities: 5(x ϩ 1) and 3 (x ϩ 1), and told that x is positive, you would select the
first quantity because you can eliminate the (x ϩ 1) from both. That leaves you to decide which is greater, 5 or
3. This has become a very easy problem resulting from eliminating information the two quantities shared.
■
Substitute real values for unknowns or variables. If you can do so quickly, many of the comparisons
will be straightforward and clear. The process of substituting numbers should be used in most QC
questions when given a variable. However, be sure to simplify the equation or expression as much as
possible before plugging in.
■
The QC section tests how quick, creative, and accurate you can be. Do not get stuck doing complex
computations. If you feel yourself doing a lot of computations, stop and try another method. There is
often more than one way to solve a problem. Try to pick the easiest way.
■
Make no assumptions about the information listed in the columns. If the question requires you to
make assumptions, then choose answer d. For example, if one of the questions asks for the root of x
2
,
you cannot assume that the answer is a positive root. Remember that x
2
will have two roots, one posi-
tive and one negative. Do not let the test fool you. Be aware of the possibility of multiple answers.
■
If one or both of the expressions being compared have parentheses, be sure to evaluate the expression(s) to
remove the parentheses before proceeding. This is a simple technique that can make a large difference in
the similarity of the two comparisons. For example, if you are comparing the binomial (x Ϫ 2)(x Ϫ 2) with
the trinomial x
2
Ϫ 4x ϩ 4, first remove the parentheses from the product of (x Ϫ 2)(x Ϫ 2) by multiplying
the two binomials. The product will be the trinomial x
2
Ϫ 4x ϩ 4. You can clearly see that they are equal.
■
Perform the same operation to both columns. This is especially useful when working with fractions.
Often, finding an LCD and multiplying both columns by that number helps to make the comparison
easier. Just keep in mind that, like working in an equation, the operation must be performed exactly the
same in each column.
– THE GRE QUANTITATIVE SECTION–
211
Problem-Solving Questions
Problem-solving questions test your mathematical reasoning skills. This means that you will be required to
apply several basic math techniques for each problem. Here are some helpful strategies to help you improve
your math score on the problem-solving questions:
■
Read questions carefully and know the answer being sought. In many problems you will be asked to
solve an equation and then perform an operation with the resulting variable to get an answer. In this
situation, it is easy to solve the equation and feel like you have the answer. Paying special attention to
what each question is asking, and then double-checking that your answer satisfies this, is an important
technique for performing well on the GRE.
■
Sometimes it may be best to try one of the answers. Many times it is quicker to pick an answer and
check to see if it is a solution. When you do this, use response c. It will be the middle number and you
can adjust the outcome to the problem as needed by choosing b or d next, depending on whether you
– THE GRE QUANTITATIVE SECTION–
212
ANSWER SHEET
1. abcde
2. abcde
3. abcde
4. abcde
5. abcde
6. abcde
7. abcde
8. abcde
9. abcde
10. abcde
11. abcde
12. abcde
13. abcde
14. abcde
15. abcde
16. abcde
17. abcde
18. abcde
19. abcde
20. abcde
21. abcde
22. abcde
23. abcde
24. abcde
25. abcde
26. abcde
27. abcde
28. abcde
29. abcde
30. abcde
31. abcde
32. abcde
33. abcde
34. abcde
35. abcde
36. abcde
37. abcde
38. abcde
39. abcde
40. abcde
41. abcde
42. abcde
43. abcde
44. abcde
45. abcde
46. abcde
47. abcde
48. abcde
49. abcde
50. abcde
51. abcde
52. abcde
53. abcde
54. abcde
55. abcde
56 abcde
57. abcde
58. abcde
59. abcde
60. abcde
61 abcde
62. abcde
63. abcde
64. abcde
65. abcde
66. abcde
67. abcde
68. abcde
69. abcde
70. abcde
71. abcde
72. abcde
73. abcde
74. abcde
75. abcde
76. abcde
77. abcde
78. abcde
79. abcde
80. abcde
need a larger or smaller answer. This is also a good strategy when you are unfamiliar with the informa-
tion the problem is asking.
■
When solving word problems, look at each phrase individually, then rewrite each in math language.
This is very similar to creating and assigning variables, as addressed earlier in the word-problem sec-
tion. In addition to identifying what is “known” and “unknown,” also take time to translate operation
words into actual symbols. It is best when working with a word problem to represent every part of it,
phrase by phrase, in mathematical language.
■
Make sure all the units are equal before you begin. This will save a great deal of time doing conversions.
This is a very effective way to save time. Almost all conversions are easier to make at the beginning of a
problem rather than at the end. Sometimes a person can get so excited about getting an answer that he
or she forgets to make the conversion at all, resulting in an incorrect answer. Making the conversions at
the start of the problem is definitely more advantageous for this reason.
■
Draw pictures when solving word problems if needed. Pictures are always helpful when a word problem
doesn’t have one already, especially when the problem is dealing with a geometrical figure or location.
Many students are also better at solving problems when they see a visual representation. Do not make
the drawings too elaborate; unfortunately, the GRE does not give points for artistic flair. A simple draw-
ing, labeled correctly, is usually all it takes.
■
Avoid lengthy calculations. It is seldom, if ever, necessary to spend a great deal of time doing calculations.
This is a test of mathematical concepts, not calculations. If you find yourself doing a very complex, lengthy
calculation
—
stop! Either you are not doing the problem correctly or you are missing a much easier solution.
■
Be careful when solving Roman numeral problems. Roman numeral problems will give you several answer
possibilities that list a few different combinations of solutions. You will have five options: a, b, c, d, and e.To
solve a Roman numeral problem, treat each Roman numeral as a true or false statement. Mark each
Roman numeral with a “T” or “F” on scrap paper, then select the answer that matches your “T’s” and “F’s.”
These strategies will help you to do well on the GRE, but simply reading them will not.You must practice, prac-
tice, and practice. That is why there are 80 problems in the following section for you to solve. Keep in mind that on
the actual GRE, you will only have 28 problems in the Quantitative section. By doing 80 problems now, it will seem
easy to do only 28 questions on the test. Keep this in mind as you work through the practice problems.
Now the time has come for all of your studying to be applied; the practice problems are next. Good luck!
– THE GRE QUANTITATIVE SECTION–
213
Practice
Directions: In each of the questions 1–40, compare the two quantities given. Select the appropriate choice
for each one according to the following:
a. The quantity in column A is greater.
b. The quantity in column B is greater.
c. The two main quantities are equal.
d. There is not enough information given to determine the relationship of the two quantities.
Column A Column B
1. n Ͼ 1
ᎏ
n +
3
7
ᎏ
+
ᎏ
n
4
–3
ᎏ
ᎏ
7n +
7
19
ᎏ
2. 0.1y + 0.01y = 2.2
0.1y 20
3. the reciprocal of 4
Ί
4. 3 feet, 5 inches 1.5 yards
5.
x = 6 + 7 + 8 + 9 + 10
y = 5 + 6 + 7+ 8+ 9
5(15) x ϩ y
6. 5678
ϫ 73
170▲4
3974ٗ0
414,494
value of ▲ value of ٗ
7. 4x = 4(14) – 4
x 14
1
ᎏ
16
– THE GRE QUANTITATIVE SECTION–
214
8. Cindy covered 36 miles in 45 minutes.
Cindy’s average speed 48 miles/hour
(in miles/hour)
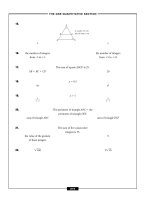
9.
length of AB length of BC
10. 120 ͙1,440
ෆ
11. Page is older than Max and Max is younger than Gracie.
Page’s age Gracie’s age
12.
4 inches length of DC
13.
z – y 40
14. a Ͼ b Ͼ c Ͼ d Ͼ 0
a Ϫ dbϪ c
A
B
D
C
x˚
x˚
y˚
y˚
z˚
y = 50
ABCD is a
parallelogram
A
B
D
C
AREA OF
= 20 in.
2
ABC
AD
= 5 INCHES AND
AD
BC
A
B
C
AB
BC
ABC
AREA OF
= 18
– THE GRE QUANTITATIVE SECTION–
215