báo cáo hóa học: " Validation of an abbreviated Treatment Satisfaction Questionnaire for Medication (TSQM-9) among patients on antihypertensive medications" doc
Bạn đang xem bản rút gọn của tài liệu. Xem và tải ngay bản đầy đủ của tài liệu tại đây (289.06 KB, 10 trang )
BioMed Central
Page 1 of 10
(page number not for citation purposes)
Health and Quality of Life Outcomes
Open Access
Research
Validation of an abbreviated Treatment Satisfaction Questionnaire
for Medication (TSQM-9) among patients on antihypertensive
medications
Murtuza Bharmal*
1
, Krista Payne
2
, Mark J Atkinson
3
, Marie-
Pierre Desrosiers
2
, Donald E Morisky
4
and Eric Gemmen
1
Address:
1
Quintiles Inc, Falls Church, Virginia, USA,
2
United BioSource Corporation, Montreal, Canada,
3
University of California, San Diego,
California, USA and
4
UCLA School of Public Health, Los Angeles, California, USA
Email: Murtuza Bharmal* - ; Krista Payne - ;
Mark J Atkinson - ; Marie-Pierre Desrosiers - ;
Donald E Morisky - ; Eric Gemmen -
* Corresponding author
Abstract
Background: The 14-item Treatment Satisfaction Questionnaire for Medication (TSQM) Version 1.4 is a reliable and valid
instrument to assess patients' satisfaction with medication, providing scores on four scales – side effects, effectiveness,
convenience and global satisfaction. In naturalistic studies, administering the TSQM with the side effects domain could provoke
the physician to assess the presence or absence of adverse events in a way that is clinically atypical, carrying the potential to
interfere with routine medical care. As a result, an abbreviated 9-item TSQM (TSQM-9), derived from the TSQM Version 1.4
but without the five items of the side effects domain was created. In this study, an interactive voice response system (IVRS)-
administered TSQM-9 was psychometrically evaluated among patients taking antihypertensive medication.
Methods: A total of 3,387 subjects were invited to participate in the study from an online panel who self-reported taking a
prescribed antihypertensive medication. The subjects were asked to complete the IVRS-administered TSQM-9 at the start of
the study, along with the modified Morisky scale, and again within 7 to 14 days. Standard psychometric analyses were conducted;
including Cronbach's alpha, intraclass correlation coefficients, structural equation modeling, Spearman correlation coefficients
and analysis of covariance (ANCOVA).
Results: A total of 396 subjects completed all the study procedures. Approximately 50% subjects were male with a good racial/
ethnic mix: 58.3% white, 18.9% black, 17.7% Hispanic and 5.1% either Asian or other. There was evidence of construct validity
of the TSQM-9 based on the structural equation modeling findings of the observed data fitting the Decisional Balance Model of
Treatment Satisfaction even without the side effects domain. TSQM-9 domains had high internal consistency as evident from
Cronbach's alpha values of 0.84 and greater. TSQM-9 domains also demonstrated good test-retest reliability with high intraclass
correlation coefficients exceeding 0.70. As expected, the TSQM-9 domains were able to differentiate between individuals who
were low, medium and high compliers of medication, with moderate to high effect sizes. There was evidence of convergent
validity with significant correlations with the medication adherence scale.
Conclusion: The IVRS-administered TSQM-9 was found to be a reliable and valid measure to assess treatment satisfaction in
naturalistic study designs, in which there is potential that the administration of the side effects domain of the TSQM would
interfere with routine clinical care.
Published: 27 April 2009
Health and Quality of Life Outcomes 2009, 7:36 doi:10.1186/1477-7525-7-36
Received: 8 August 2008
Accepted: 27 April 2009
This article is available from: />© 2009 Bharmal et al; licensee BioMed Central Ltd.
This is an Open Access article distributed under the terms of the Creative Commons Attribution License ( />),
which permits unrestricted use, distribution, and reproduction in any medium, provided the original work is properly cited.
Health and Quality of Life Outcomes 2009, 7:36 />Page 2 of 10
(page number not for citation purposes)
Background
Patient satisfaction with their medication is shown to
affect treatment-related behaviors, such as their likelihood
of continuing to use their medication, to use their medi-
cation correctly and to adhere with medication regimens
[1-7]. Although a number of disease-specific measures of
patients' treatment satisfaction (TS) and treatment satis-
faction with their medication (TS-M) have been reported
in the literature [8-18], very few studies have attempted to
assess a more general measure of TS-M that would permit
comparisons across medication types and patient condi-
tions. The Treatment Satisfaction Questionnaire for Med-
ication (TSQM) is a widely used generic measure to assess
TS-M and has been psychometrically validated in a heter-
ogeneous sample [19,20].
The development of the TSQM along with the conceptual
framework of TS and patients' satisfaction with their med-
ication has been described in detail earlier [19,20]. In the
development of the TSQM, an initial set of 55 items were
drafted to represent the conceptual framework of TS-M
identified based on qualitative research which included
the concepts of effectiveness, symptom relief, side effects,
convenience, tolerability, impact on daily life and func-
tioning and global satisfaction [19]. After item refinement
and psychometric validation, the TSQM Version 1.4 is
comprised of 14 questions that provide scores on four
scales: effectiveness (3 items), side effects (5 items), con-
venience (3 items) and global satisfaction (3 items) [19].
Based on the conceptual framework of TS-M, patients' per-
ception of side effects with their medication is an impor-
tant component of satisfaction with their medication.
However, the use of the TSQM with the side effects
domain has a potential to interfere with real-world out-
comes which are central to naturalistic study designs. For
example, a recent study in patients treated with antiepi-
leptic drugs found that a significant higher rate of adverse
event reporting occurred among patients who were
administered a checklist versus those reporting them
spontaneously. The study also found that reporting of
adverse events resulted in changing treatment adminis-
tered [21]. The study findings demonstrate the potential
of a questionnaire like the TSQM with its side effect
domain to interfere with naturalistic studies which are
designed to collect data from the usual clinical practice
environment with minimum interference to the behaviors
of study participants (both patients and physicians).
In the real world, physicians must collect and report sus-
pected adverse events to medications already on the mar-
ket according to established guidelines for adverse event
reporting and their own professional discretion. Thus, in
a naturalistic study of the usual care of hypertension man-
agement, the administration of a questionnaire, such as
the TSQM, which queries the patient about their experi-
ence in relation to side effects, has a potential to provoke
the physician to assess the presence or absence of adverse
events in a way that is not typical for clinical practice, as
demonstrated in the study by Carreño and colleagues
[21]. This artificial trigger for adverse event questioning
has the potential to impact naturalistic study outcomes –
particularly those that relate to care patterns, treatment
satisfaction and medication compliance [21].
This study discusses the psychometric validation of the
TSQM-9, which uses nine of the 14 TSQM Version 1.4
items not including five TSQM questions (ie, questions 4
to 8) related to side effects of medication. The TSQM-9
has been developed to provide a suitable measure of treat-
ment satisfaction with medication in such naturalistic
studies where measuring patient-reported side effects has
a potential to interfere with the study objectives. The
objective of this study was to psychometrically validate
the interactive voice response system (IVRS)-administered
abbreviated 9-item TSQM (TSQM-9) in a sample of
patients taking hypertensive medications.
Methods
Study sample
Study subjects were recruited from an online population
of patients, reporting to be hypertensive, identified by
Synovate Healthcare (Chicago, Illinois, USA). Synovate
has recruited a large number of U.S. subjects to participate
in surveys of different healthcare related topics. These sub-
jects, considered healthcare panelists, must consent and
be 18 years of age or older to participate.
This study was approved by an independent ethics com-
mittee. The study recruited subjects with a goal of achiev-
ing at least 300 completed subjects as an accepted sample
size for validation studies [22].
Study design
Out of the 25,600 healthcare panelists that met the inclu-
sion criteria for the study, a random sample of 3,387 sub-
jects were sent an email invitation in which a web link
directed them to the TSQM-9 study enrollment website,
within which the study rationale, objectives and proce-
dures were fully described. To participate in the TSQM-9
validation study, subjects confirmed in this website that
they had read the description of the study design and
required procedures and they wished to continue with the
enrollment process. If so, the subject opted-in via a web
link, which was considered as an informed consent. Upon
receipt of the 'opt-in' response, subjects were automati-
cally directed to a confirmation of study eligibility web
page, where they answered a few brief questions confirm-
ing study eligibility and provided their primary contact
telephone number. The eligibility questions included
Health and Quality of Life Outcomes 2009, 7:36 />Page 3 of 10
(page number not for citation purposes)
confirmation on whether they had hypertension and
whether they were taking prescription medications for
their hypertension.
Once eligibility was confirmed via the website, the subject
was sent a confirmation email that provided a reiteration
of study procedures, a toll-free telephone number and a
unique randomized access code which enabled secure
access to the telephone-based interactive voice response
system (IVRS) within which the study questions were
implemented. Subjects were invited to call the IVRS as
soon as possible (preferably the same day as study enroll-
ment). Each study subject was instructed to call the IVRS
and enter study data twice: the first assessment (time 1)
and a second assessment within 7 to 14 days (time 2).
During the first call, subjects completed the TSQM-9 and
the modified Morisky Scale questions [23]. In the second
assessment only the TSQM-9 questions were completed.
Study measures
Abbreviated Treatment Satisfaction Questionnaire for Medication
(TSQM-9)
The TSQM Version 1.4 is a 14-item psychometrically
robust and validated instrument consisting of four scales
[19]. The 14 questions were selected from an original set
of 55 questions obtained from literature review and focus
groups. The four scales of the TSQM include the effective-
ness scale (questions 1 to 3), the side effects scale (ques-
tions 4 to 8), the convenience scale (questions 9 to 11)
and the global satisfaction scale (questions 12 to 14). In
the TSQM-9, the five items related to side effects of medi-
cation were not included, which creates a need to psycho-
metrically assess the performance of the abbreviated
instrument.
The TSQM-9 domain scores were calculated as recom-
mended by the instrument authors, which is described in
detail elsewhere [19,20]. The TSQM-9 domain scores
range from 0 to 100 with higher scores representing
higher satisfaction on that domain.
Modified Morisky scale
The modified Morisky scale is a 7-item instrument to
assess self-reported patient adherence modified from the
validated 8-item Morisky scale developed to assess adher-
ence related to antihypertensive medication [23]. Items of
the 8-item Morisky scale are described in Table 1. Further
description and psychometric data on the 8-item Morisky
scale are described in detail elsewhere [23].
One item of the 8-item Morisky scale related to stopping
medication because of feeling worse with the medication
('Have you ever cut back or stopped taking your medica-
tion without telling your doctor, because you felt worse
when you took it?' was not included in the modified
Morisky scale due to similar concerns about the item
interfering with the treatment process in a naturalistic
study design. Based on communication with the author of
the Morisky scale, deleting this item resulted in only a very
minor change in the internal consistency of the scale from
0.83 to 0.82. Sensitivity and specificity of the 7-item mod-
ified Morisky scale for identifying lower vs. higher adher-
ers was 91% and 50%, respectively, which was close to the
Table 1: Items of the Modified Morisky Scale
Items Response format
Do you sometimes forget to take your [health concern] pills? Yes or No
People sometimes miss taking their medications for reasons other than
forgetting. Thinking over the past two weeks, were there any days when you did
not take your [health concern] medicine?
Yes or No
When you travel or leave home, do you sometimes forget to bring along your
[health concern] medication?
Yes or No
Did you take your [health concern] medicine yesterday? Yes or No
When you feel like your [health concern] is under control, do you sometimes
stop taking your medicine?
Yes or No
Taking medication everyday is a real inconvenience for some people. Do you
ever feel hassled about sticking to your [health concern] treatment plan?
Yes or No
How often do you have difficulty remembering to take all your medications? Never/Rarely, Once in a while, Sometimes, Usually, All the time
All translations, adaptations, computer programs, and scoring algorithms, and any other related documents of the Morisky Medication Adherence
Scale (MMAS 4- and 8-item versions), are owned and copyrighted by, and the intellectual property of, Donald E. Morisky, ScD, ScM, MSPH.
Professor of Community Health Sciences, UCLA School of Public Health, Los Angeles, CA 90095-1772.
Health and Quality of Life Outcomes 2009, 7:36 />Page 4 of 10
(page number not for citation purposes)
estimates reported for the original 8-item scale at 93% and
53%, respectively.
The modified Morisky scale yield a total score with a range
of 0 to 7, with higher scores indicating higher adherence
to medication. The scores of the modified Morisky scale
can be categorized as low compliers (< 6), medium com-
pliers (> = 6 but <7) and high compliers (= 7) based on its
criterion validity with blood pressure control.
Statistical methods
The construct validity of the TSQM-9 was evaluated using
structural equation modeling (SEM) based on the factor
structure outlined by the Decisional Balance Model of
Treatment Satisfaction used by Atkinson et al. (2005) for
the TSQM [20]. Briefly, based on the Decisional Balance
Model of Treatment Satisfaction, dimensions of treatment
experience (effectiveness, convenience and side effects)
are weighted by individuals to predict global satisfaction
and subsequent treatment adherence. In the TSQM-9,
since the side effect domain of the TSQM is not included,
it becomes important to assess the construct validity of the
TSQM-9 using the Decisional Balance Model of Treatment
Satisfaction, with respect to the ability of its scales to pre-
dict treatment satisfaction even without the side effect
domain.
Structural equation modeling (SEM) helps to model the
hypothetical relationships between observed and latent
variables. The measurement and structural model to be
tested is pre-specified by defining the relationships among
the variables (ie, items) and latent constructs (ie, scales),
and then tested by examining the fit between the specified
model and the correlation or covariance patterns that are
observed in the data. If the proposed model fits the
observed data, it is said to be confirmed. The fit of the
specified model was evaluated by reviewing two criteria,
the global fit measures including the Bentler's compara-
tive fit index (CFI), the Bentler and Bonett's non-normed
fit index (NNFI) and chi-square, and the magnitude of the
individual standardized parameter estimates for the paths
in the model. To demonstrate a good model fit, the chi-
square test should be non-significant, and the CFI and
NNFI should be close to or exceeding 0.90 [24,25]. The
magnitude of the individual standardized parameter esti-
mates for the paths in the model should be statistically
significant and ideally be greater than or equal to 0.70
[24].
Internal consistency of the three scales of the TSQM-9 (ie,
effectiveness, convenience and global satisfaction) was
assessed using Cronbach's alpha at time 1 and time 2 [26].
Test-retest reliability of the TSQM-9 was assessed using the
intraclass correlation coefficient using data from the two
time periods (time 1 and time 2) that were separated by 7
to 14 days. Assuming that there is no significant change in
the factors that affect patient satisfaction with medication
during the short time interval in the two administrations
of the TSQM-9, patient responses from the two time peri-
ods were expected to have a high correlation.
Known-group validity analysis was conducted to deter-
mine the ability of the TSQM-9 to discriminate among
patients known to differ in their satisfaction with medica-
tion. It is expected that individuals that are more compli-
ant are likely to be more satisfied with their medication.
TSQM-9 domain scores at time 1 were compared between
low compliers (modified Morisky scale score<6) and
medium compliers (modified Morisky scale score > = 6
but <7) using analysis of covariance (ANCOVA) control-
ling for covariates which were significantly related to treat-
ment satisfaction in bivariate analysis (patient age, gender
and race/ethnicity). Since only one individual was classi-
fied as high complier (modified Morisky scale score = 7),
this group was excluded from the known-group validity
analysis.
Effect size based on Cohen's d (difference between the
mean score of the groups/pooled standard deviation)
were calculated to assess the magnitude of group differ-
ences [27]. An effect size of ≥ 0.50–<0.80 is considered as
moderate while an effect size ≥ 0.80 is considered as large
[28]. Convergent validity of the TSQM-9 was assessed by
the correlation of the modified Morisky scale score and
the TSQM-9 domain scores at time 1 using the Spearman
rank-order correlation coefficients. As satisfaction with
medication is expected to be positively associated with
medication compliance, a moderate to high positive cor-
relation (> = 0.25) between the scores was expected [19].
All analyses were conducted in SAS version 9.1 for Win-
dows [29].
Results
Study subjects
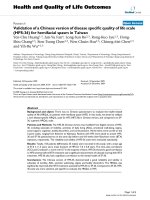
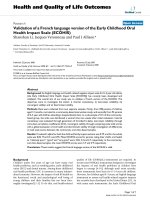
A total of 2,135 subjects (63.0%) out of the 3,387 subjects
that were contacted, agreed to participate in the study. A
total 968 subjects (45.3%) out of the 2,135 responders
were screen failures since they did not pass the study eligi-
bility questions. Of the 1,167 that were enrolled in the
study, a total of 396 subjects (33.9%) completed all the
study procedures (required assessments at time 1 and
time 2) and were used in the current analysis (see Figure
1).
The mean (standard deviation) age of the study subjects
was 55.1 (11.4) years. Approximately 50% of the subjects
were male. There was a good racial/ethnic mix among the
subjects with 58.3% white, 18.9% black, 17.7% Hispanic
and the rest belonging to Asian or other non-Hispanic cat-
egory.
Health and Quality of Life Outcomes 2009, 7:36 />Page 5 of 10
(page number not for citation purposes)
Comparisons of responders versus non-responders
Significant differences were observed between responders
to the study invitation (n = 2,135) and non-responders (n
= 1,252) on age, gender and race/ethnicity. Responders
were older (55.1 years versus 52.5 years; p < 0.0001),
more likely to be male (50.2% versus 36.1%; p < 0.0001),
more likely to be white (56.1% versus 45.9%) and less
likely to be black (15.1% versus 20.1%) (p < 0.0001)
compared to non-responders.
Comparisons of study subjects versus non-completers
No significant differences were observed between study
subjects (n = 396) and non-completers (n = 771) on gen-
der and age. However, study subjects were less likely to be
Hispanic (17.7% versus 23.7%) and more likely to be
white (58.3% versus 51.0%) (p < 0.0001) compared to
non-completers.
Comparisons of study subjects versus subjects invited to
participate in the study
No significant differences were observed between study
subjects (n = 396) and individuals initially invited to par-
ticipate in the study (n = 3,387) on gender and age. How-
ever, study subjects were less likely to be Hispanic (17.7%
versus 25.6%) and more likely to be white (58.3% versus
52.3%) (p < 0.0001) compared to those invited to partic-
ipate in the study.
TSQM-9 observed scores
Table 2 describes the TSQM-9 domain scores at time 1 and
time 2. TSQM scores have a range of 0 to 100, with higher
scores indicating higher satisfaction. Similar scores were
observed at time 1 and time 2 for all the TSQM-9
domains. Mean (SD) score on the effectiveness domain
was 73.4 (18.5) at time 1 and 73.7 (17.3) at time 2. Mean
(SD) score on the convenience domain was 78.7 (15.9) at
time 1 and 79.3 (15.5) at time 2. Mean (SD) score on the
global satisfaction domain was 75.5 (18.6) at time 1 and
76.6 (18.8) at time 2.
Modified Morisky scale observed scores
Table 2 also describes the modified Morisky scale score at
time 1. Modified Morisky scale score has a range of 0 to 7,
with higher scores indicating higher adherence to medica-
tion. The mean (SD) adherence to medication among the
study subjects was at 5.0 (1.3).
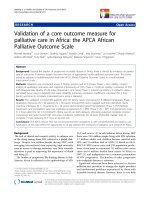
Construct validity of the TSQM-9
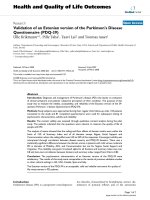
Figure 2 depicts a diagrammatic representation of the
structural equation modeling analysis of the TSQM-9
based on the Decisional Balance Model of Treatment Sat-
isfaction (without the side effects domain). The model
tested included a measurement model, which described
the relationship of the manifest variables that measure the
latent constructs (Effectiveness, Convenience and Global
Satisfaction), and a causal model, which described the
relationship of the latent constructs with each other. For
testing the above model using structural equation mode-
ling (SEM), as recommended by Hatcher, the variances of
the exogenous variables (latent constructs) need to be
specified as free parameters to be estimated [24]. To solve
the resulting scale indeterminancy issue caused by esti-
mating the variances of the exogenous variables in the
above model, one factor loading for each latent construct
was fixed to 1 (Item # Relieve for Effectiveness; Item # To
Plan for Convenience; Item # Overall for Global Satisfac-
tion) [24]. The specified model was confirmed as overi-
dentified with number of data points (information = 45)
exceeding the number of parameters to be estimated
(parameters estimated = 20) [24].
As seen in Figure 2, the model fit is acceptable for most of
the criteria. Although the observed chi-square test was sig-
nificant (Chi-square: 117.4; df = 25; Chi-square/df = 4.7;
p-value < 0.0001), this test is regarded as being very sensi-
tive to sample size, rendering it unclear in many situations
whether the statistical significance of the chi-square statis-
tic is due to poor fit of the model or to the size of the sam-
ple, warranting the need to use other indices to assess
model fit [24]. Both, the CFI value of 0.9712 and NNFI
Study SampleFigure 1
Study Sample.
Contacted to participate in
the study (n=3,387) –
Invited
Agreed to
participate in
the study
(n=2,135) –
Responders
Did not agree
to participate
in the study
(n=1,252) –
Non-
Responders
Passed the study eligibility
questions (n=1,167)
Completed
all study
procedures
(n=396) –
Study
Subjects
Did not
complete
all study
procedures
(n=771) –
Non-
completer s
Health and Quality of Life Outcomes 2009, 7:36 />Page 6 of 10
(page number not for citation purposes)
value of 0.9585 exceeded 0.90, suggesting a model with
adequate fit. The individual standardized parameter esti-
mates for the paths in the model were high and most
greater than 0.70. All the t-values for parameter estimates
were greater than 15.43, far exceeding the critical value of
1.96 required for statistical significance at an alpha of
0.05. The model results indicated that independently
86.3% and 67.6% of the variance in global satisfaction is
explained by effectiveness and convenience domains,
respectively.
Based on these results, there is evidence to suggest that the
observed data fits the specified Decisional Balance Model
of Treatment Satisfaction (without the side effects
domain), demonstrating construct validity of the TSQM-
9, even without the side effects domain of the TSQM.
Internal consistency of the TSQM-9
As described in Table 3, all the item-total correlations
were greater than 0.65. All Cronbach's alpha values
exceeded 0.80 at time 1 and time 2, demonstrating good
internal consistency [30]. The Cronbach's alpha values at
time 1 and time 2, respectively, were 0.94 and 0.92 for the
effectiveness domain, 0.91 and 0.92 for the convenience
domain, and 0.84 and 0.85 for the global satisfaction
domain.
Test-retest reliability of the TSQM-9
Table 2 describes the test-retest reliability of each of the
domains of the TSQM-9 using the intraclass correlation
coefficient (ICC). As expected, the ICC values were high:
0.784 for the effectiveness domain, 0.737 for the conven-
ience domain and 0.759 for the global satisfaction
domain, demonstrating test-retest reliability of the TSQM-
9. Given the 4-week recall period used in the TSQM-9,
subjects completing TSQM-9 at time 1 and a second
assessment within 7 to 14 days had a sufficient overlap in
time period for assessing satisfaction between the two
time periods, and thus not expected to have any bias in
the test-retest reliability analysis.
Known-group validity of the TSQM-9
Known-group validity analysis determines the ability of
the TSQM-9 to discriminate among patients known to dif-
fer in their satisfaction with medication. Table 4 compares
TSQM-9 domains among low, medium and high compli-
ers at time 1. Since only one individual was classified as
high complier (modified Morisky scale score = 7), this
Table 2: Summary Scores on TSQM-9 Domains and Modified Morisky Scale and Test-Retest Reliability of the TSQM-9
Scale Time 1 Time 2 Intraclass Correlation Coefficient, ICC (95% CI of ICC)
TSQM-9
Effectiveness 0.784 (0.757, 0.811)
N396396
Mean (SD) 73.44 (18.51) 73.74 (17.27)
Median 72.22 72.22
Minimum, maximum 5.56, 100 0, 100
Convenience 0.737 (0.704, 0.768)
N396396
Mean (SD) 78.69 (15.89) 79.32 (15.46)
Median 83.33 83.33
Minimum, maximum 16.67, 100 16.67, 100
Global Satisfaction 0.759 (0.729, 0.788)
N396396
Mean (SD) 75.52 (18.61) 76.57 (18.79)
Median 78.57 78.57
Minimum, maximum 0, 100 0, 100
Modified Morisky Scale
N396NA
Mean (SD) 5.02 (1.27)
Median 5.25
Minimum, maximum 0.25, 7
Time 1 = Day of first IVRS call after enrollment; Time 2 = Time 1 + 7 to 14 days.
Intraclass correlation coefficient (ICC) computed using TSQM-9 scores at Time 1 (Day of first IVRS call after enrollment) and Time 2 (Time 1 + 7
to 14 days)
Possible range on TSQM-9 domain scores is 0 to 100.
Possible range on modified Morisky Scale score is 0 to 7
Health and Quality of Life Outcomes 2009, 7:36 />Page 7 of 10
(page number not for citation purposes)
group was excluded from the known-group validity anal-
ysis. As expected, TSQM-9 domain scores were signifi-
cantly different between the two groups, with higher
scores (greater satisfaction) among medium compliers
compared to low compliers. The analysis controlled for
patient age, gender and race/ethnicity, which were found
to be significantly related to treatment satisfaction in
bivariate analysis. Adjusted mean scores (lsmean) on the
effectiveness domain were 66.1 among low compliers and
were significantly higher at 77.1 among medium compli-
ers. Adjusted mean scores on the convenience domain
were 71.7 among low compliers and were significantly
higher at 84.0 among medium compliers. Adjusted mean
scores on the global satisfaction domain were 68.4 among
low compliers and were significantly higher at 79.3
among medium compliers. The effect size for the mean
differences in the TSQM-9 domain scores was moderate to
large and ranged from 0.65 to 0.88 when comparing
medium compliers with low compliers [28].
Convergent validity of the TSQM-9
Convergent validity of the TSQM-9 was assessed by corre-
lation of the modified Morisky scale score and the TSQM-
9 domain scores at time 1 using the Spearman rank-order
correlation coefficient. As satisfaction with medication is
expected to be positively associated with medication
adherence, a moderate-to-high positive correlation
between the scores is expected. TSQM-9 convenience
domain had the largest correlation with the medication
adherence score at 0.46, followed by effectiveness domain
scores at 0.38 and global satisfaction at 0.34.
Discussion
This study provides evidence of the reliability and validity
of the IVRS-administered abbreviated 9-item TSQM with-
out the side effects domain (TSQM-9). There was evidence
of construct validity based on structural equation mode-
ling findings of the observed data fitting the Decisional
Balance Model of Treatment Satisfaction even without the
side effects domain. TSQM-9 domains had high internal
consistency as evident from Cronbach's alpha values of
0.84 and over. TSQM-9 domains also demonstrated good
test-retest reliability, with high intraclass correlation coef-
ficients exceeding 0.70. As expected, the TSQM-9 domains
were able to differentiate between individuals who were
medium and low compliers with a moderate effect size.
There was also evidence of convergent validity, with sig-
nificant correlations with the medication adherence scale.
Structural Equation Modeling Analysis for the TSQM-9Figure 2
Structural Equation Modeling Analysis for the TSQM-9.
Prevent
Relieve
Time
Current
For
m
To Plan
As
I
nstructed
Overall
Outweigh
Confident
Effectiveness
Convenience
Global
Satisfaction
0.93
0.95
0.86
0.83
0.90
0.90
0.77
0.67
0.88
0.78
0.26
0.12
0.14
0.
09
0.26
0.30
0.18
0.
18
0.
40
0.
55
0.22
0.93
0.82
Boxes represents manifest variables.
Circles represents latent variables.
The values on the arrow represents
standardized estimates from
confirmatory factor analysis. Values
on recursive arrows represent error
estimates.
t-values for parameter estimates of
all the paths were greater than 15.43
(ranging from 15.43 to 35.93).
Health and Quality of Life Outcomes 2009, 7:36 />Page 8 of 10
(page number not for citation purposes)
The TSQM-9 was developed due to the need for using a
measure of treatment satisfaction that was designated to
minimize interference in routine clinical care in the con-
text of naturalistic study designs. The side effect domain of
the TSQM Version 1.4 queries the patient about their
experience in relation to side effects and has a potential to
provoke the physician to assess the presence or absence of
adverse events in a way that is clinically atypical, affecting
the naturalistic design of a study [21]. It should be noted
that we do not recommend the use of TSQM-9 over the
earlier versions of the TSQM in clinical studies where
there is no such possibility of the side effects domains
interfering with study objectives and where the outcome
of investigational drugs are being studied. Clearly, based
on the conceptual framework of TS-M, patient's percep-
tion of side effects with their medication is an important
component of satisfaction with their medication. How-
ever, there are specialized studies in which the side effects
domain has potential to interfere with objectives of the
study; the TSQM-9 is intended to provide a validated
instrument for such scenarios.
It is important to note that although the side effects
domain was not included in TSQM-9, any unpleasant
experiences with a medication are likely to be captured in
the TSQM global satisfaction items. As a result, even with-
out the side effects items, the TSQM-9 allows for patients
to weigh the pros and cons of medication and the less
favorable aspects of patients' experiences with their medi-
cations would be captured.
In this study, we found that the convenience domain had
strongest association with medication adherence followed
by effectiveness and global satisfaction. In previous TSQM
validation analysis, global satisfaction had the strongest
association with medication adherence [20]. This associa-
tion may be reflective of the hypertensive patient popula-
tion. In an asymptomatic chronic condition like
hypertension, the convenience domain becomes an
important factor for medication adherence given that the
patient has to take their medications daily without any
apparent symptomatic changes in their condition.
One of the limitations of this study was that it was con-
ducted in a homogenous sample of patients using hyper-
tensive medications. Since the TSQM is a generic measure
of patients' satisfaction with their medication, validation
in a more heterogeneous representative sample, contain-
ing, for example, patients with different chronic medical
conditions would have improved the robustness of
results. Future studies on the performance of the TSQM-9
in other patient populations are recommended. In this
study, differences were observed on demographic charac-
teristic between responders to the study invitation and
non-responders. Further, there were some differences on
race/ethnicity between study completers and non-compl-
Table 3: Internal Consistency of the TSQM-9 Items
Time 1 Time 2
Items and Domains Item-total correlation Cronbach's Alpha Item-total correlation Cronbach's Alpha
Effectiveness 0.935 0.924
How satisfied or dissatisfied are you with the ability of
the medication to prevent or treat your condition?
0.878 0.840
How satisfied or dissatisfied are you with the way the
medication relieves your symptoms?
0.904 0.892
How satisfied or dissatisfied are you with the amount of
time it takes the medication to start working?
0.819 0.805
Convenience 0.911 0.915
How easy or difficult is it to use the medication in its
current form?
0.791 0.799
How easy or difficult is it to plan when you will use the
medication each time?
0.841 0.854
How convenient or inconvenient is it to take the
medication as instructed?
0.834 0.833
Global Satisfaction 0.837 0.848
Overall, how confident are you that taking this
medication is a good thing for you?
0.755 0.768
How certain are you that the good things about your
medication outweigh the bad things?
0.684 0.698
Taking all things into account, how satisfied or
dissatisfied are you with this medication?
0.694 0.684
Time 1 = Day of first IVRS call after enrollment; Time 2 = Time 1 + 7 to 14 days
Health and Quality of Life Outcomes 2009, 7:36 />Page 9 of 10
(page number not for citation purposes)
eters. However, given that the purpose of this study was
instrument validation and that the study subjects used in
the analysis had a good gender and racial/ethnic mix,
these differences are unlikely to bias the study results.
Another potential limitation of this study is the use of a 7-
item modified Morisky scale for the validation of TSQM-
9. An item from the original Morisky scale related to stop-
ping medication because of feeling worse with the medi-
cation was dropped due to similar concerns about the
item interfering with the treatment process in a naturalis-
tic study design [21]. However, as discussed earlier, delet-
ing this item resulted in minimal change in the internal
consistency of scale as well as the sensitivity and specifi-
city of the scale for identifying lower vs. higher adherers.
Despite these limitations, the TSQM-9 may prove to be a
useful measure to assess treatment satisfaction with med-
ication in patients with hypertension when real-world
outcomes are of interest and there is a need to minimize
interference to the behaviors of health care providers and
patients alike.
Conclusion
The IVRS-administered TSQM-9 was found to be a reliable
and valid measure to assess treatment satisfaction in nat-
uralistic study designs, when there is potential for the side
effects domain of the TSQM to interfere with routine clin-
ical care and the objectives of the study.
Competing interests
The study was funded by Novartis Pharmaceuticals.
Authors' contributions
MB: Psychometric Design and Analysis, Project Manage-
ment, Primary Authorship
KP: Project Management, Study Design and Planning, Sec-
ond Authorship
MA: Study Design and Planning, Contributing Author
MPD: Study Design and Planning, Contributing Author
DM: Study Design and Planning, Contributing Author
EG: Psychometric Design and Analysis, Project Manage-
ment, Contributing Author
Acknowledgements
The authors would like to acknowledge the participation of Christina
McCormack of Synovate ViewsCast (Chicago, Illinois) for her role as a Sen-
ior Project Manager in the implementation and conduct of this study.
Table 4: Known-group Validity of the TSQM-9
Effect Size
Domain Low Compliers
(Modified Morisky Scale
< 6)
Medium Compliers
(Modified Morisky Scale >
= 6 but < 7)
High Compliers
(Modified Morisky Scale
= 7)
p-value Medium Compliers –
Low Compliers
Effectiveness < 0.0001 0.68
n 200 195 1
Lsmean (SE) 66.08 (1.93) 77.11 (1.97) NA
Mean (SD) 67.53 (18.85) 79.37 (16.07) 100 (-)
Median 66.67 83.33 100
Minimum, maximum 5.56, 100 11.11, 100 100, 100
Convenience < 0.0001 0.88
n 200 195 1
Lsmean (SE) 71.67 (1.60) 84.02 (1.64) NA
Mean (SD) 72.31 (16.42) 85.13 (12.31) 100 (-)
Median 72.22 83.33 100
Minimum, maximum 16.68, 100 50, 100 100, 100
Global Satisfaction < 0.0001 0.65
n 200 195 1
Lsmean (SE) 68.36 (1.94) 79.27 (1.98) NA
Mean (SD) 69.82 (19.86) 81.25 (15.19) 100 (-)
Median 71.43 85.71 100
Minimum, maximum 0, 100 21.43, 100 100, 100
p-value and lsmean for compliance level based on analysis of covariance (ANCOVA) model controlling for patient age, gender and race/ethnicity;
Since only one individual in the study was classified as a high complier, analyses were conducted among low and medium compliers only.
Effect size based on Cohen's d;
Publish with BioMed Central and every
scientist can read your work free of charge
"BioMed Central will be the most significant development for
disseminating the results of biomedical research in our lifetime."
Sir Paul Nurse, Cancer Research UK
Your research papers will be:
available free of charge to the entire biomedical community
peer reviewed and published immediately upon acceptance
cited in PubMed and archived on PubMed Central
yours — you keep the copyright
Submit your manuscript here:
/>BioMedcentral
Health and Quality of Life Outcomes 2009, 7:36 />Page 10 of 10
(page number not for citation purposes)
Copyrights of the TSQM-9 are held by Quintiles, Inc. To obtain the
approved formatted versions of the instrument as well as numerous trans-
lations, please contact Murtuza Bharmal, Ph.D. Quintiles Inc., 3130 Fairview
Park Drive, Suite 501, Falls Church, Virginia 22041, USA. Email: mur-
References
1. Zhiwei Zhang, Gerstein DR, Friedmann PD: Patient satisfaction
and sustained outcomes of drug abuse treatment. J Health Psy-
chol 2008, 13:388-400.
2. Martin LR, Williams SL, Haskard KB, Dimatteo MR: The challenge
of patient adherence. Ther Clin Risk Manag 2005, 1:189-99.
3. DiMatteo MR, Giordani PJ, Lepper HS, Croghan TW: Patient
adherence and medical treatment outcomes: a meta-analy-
sis. Med Care 2002, 40:794-811.
4. Testa MA, Simonson DC: Satisfaction and quality of life with
premeal inhaled versus injected insulin in adolescents and
adults with type 1 diabetes. Diabetes Care 2007, 30:1399-405.
5. Joosten EA, DeFuentes-Merillas L, de Weert GH, Sensky T, van der
Staak CP, de Jong CA: Systematic review of the effects of
shared decision-making on patient satisfaction, treatment
adherence and health status. Psychother Psychosom 2008,
77:219-26.
6. Wroth TH, Pathman DE: Primary medication adherence in a
rural population: the role of the patient-physician relation-
ship and satisfaction with care. J Am Board Fam Med 2006,
19:478-86.
7. Kumar RN, Kirking DM, Hass SL, Vinokur AD, Taylor SD, Atkinson
MJ, McKercher PL: The association of consumer expectations,
experiences and satisfaction with newly prescribed medica-
tions. Qual Life Res 2007, 16(7):1127-36.
8. Gill KJ: Social psychological artifacts in the measurement of
consumer satisfaction with health care. Dissertation Abstracts
International: Section B: The Sciences & Engineering 1996, 57(2-B):1495.
9. Chatterton ML, Scott-Lennox J, Wu AW, Vinokur AD, Taylor SD,
Atkinson MJ, McKercher PL: Quality of life and treatment satis-
faction after the addition of lamivudine or lamivudine plus
loviride to zidovudine-containing regimens in treatment-
experienced patients with HIV infection. PharmacoEcon 1999,
15(Suppl 1):67-74.
10. Cohen JA, Beall D, Beck A, Rawlings J, Miller DW, Clements B, Pait
DG, Batenhorst A: Sumatriptan treatment for migraine in a
health maintenance organization: economic, humanistic,
and clinical outcomes. Clinical Therapeutics 1999, 21(1):190-204.
11. Colman SS, Brod MI, Krishnamurthy A, Rowland CR, Jirgens KJ,
Gomez-Mancilla B: Treatment satisfaction, functional status,
and health-related quality of life of migraine patients treated
with almotriptan or sumatriptan. Clinical Therapeutics 2001,
23(1):127-145.
12. Lewis R, Bennett CJ, Borkon WD, J Boykin WH, Althof SE, Stecher
VJ, Siegel RL: Patient and partner satisfaction with Viagra
(sildenafil citrate) treatment as determined by the Erectile
Dysfunction Inventory of Treatment Satisfaction Question-
naire. Urology 2001, 57(5):960-965.
13. Mathias SD, Warren EH, Colwell HH, Sung JC: A new treatment
satisfaction measure for asthmatics: a validation study. Qual
Life Res 2000, 9(7):873-882.
14. Atkinson MJ, Lennox RD: Extending basic principles of meas-
urement models to the design and validation of Patient
Reported Outcomes. Health Qual Life Outcomes 2006, 4:65.
15. Revicki DA: Patient assessment of treatment satisfaction:
methods and practical issues. Gut 2004, 53(Suppl 4):iv40-4.
16. Shikiar R, Rentz AM: Satisfaction with medication: an overview
of conceptual, methodologic, and regulatory issues. Value
Health 2004, 7(2):204-15.
17. Baró E, Casado A, García-Cases C, Clerch L, Ribas S: Assessing sat-
isfaction with pain medication in primary care patients:
development and psychometric validation of a new measure.
Clin Ther 2004, 26(7):1124-36.
18. Anderson RT, Girman CJ, Pawaskar MD, Camacho FT, Calles J, Kelly
WS, Demuro C, Balkrishnan R: The Diabetes Medication Satis-
faction Tool (DMSAT): A Focus on Treatment Regimens.
Diabetes Care 2008 in press.
19. Atkinson MJ, Sinha A, Hass SL, Colman SS, Kumar RN, Brod M, Row-
land CR: Validation of a general measure of treatment satis-
faction, the Treatment Satisfaction Questionnaire for
Medication (TSQM), using a national panel study of chronic
disease. Health Qual Life Outcomes 2004, 2:12.
20. Atkinson MJ, Kumar R, Cappelleri JC, Hass SL: Hierarchical con-
struct validity of the treatment satisfaction questionnaire for
medication (TSQM version II) among outpatient pharmacy
consumers. Value Health 2005, 8(Suppl 1):S9-S24.
21. Carreño M, Gil-Nagel A, Sánchez JC, Elices E, Serratosa JM, Salas-Puig
J, Villanueva V, Porcel J: Strategies to detect adverse effects of
antiepileptic drugs in clinical practice. Epilepsy Behav 2008,
13(1):178-83.
22. U.S. Department of Health and Human Services, Food and Drug
Administration: Guidance for Industry: Patient-Reported Out-
come Measures: Use in Medical Product Development to
Support Labeling Claims. 2006.
23. Morisky DE, Ang A, Krousel-Wood M, Ward H: Predictive Validity
of a Medication Adherence Measure in an Outpatient Set-
ting. The Journal of Clinical Hypertension 2008, 10(5):348-354.
24. Hatcher L: A Step-by-Step Approach to Using the SAS Sys-
tem for Factor Analysis and Structural Equation Modeling.
SAS Publishing; 1994.
25. Browne M, Cudeck R: Alternative ways of assessing model fit.
Socio Methods Res 1992, 21:230-59.
26. Cronbach LJ: Coefficient alpha and the internal structure of
tests. Psychometrika 1951, 16:297-334.
27. Cohen J: A power primer. Psychological Bulletin 1992,
112(1):155-159.
28. Landis JR, Koch GG: The measurement of observer agreement
for categorical data. Biometrics 1977, 33:159-174.
29. SAS 9.1 for Windows. SAS Institute, Cary, NC; 2004.
30. Nunnally J, Bernstein I: Psychometric Theory 3rd edition. New York:
McGraw Hill; 1994.