báo cáo hóa học:" Validation of a HLA-A2 tetramer flow cytometric method, IFNgamma real time RT-PCR, and IFNgamma ELISPOT for detection of immunologic response to gp100 and MelanA/MART-1 in melanoma patients" doc
Bạn đang xem bản rút gọn của tài liệu. Xem và tải ngay bản đầy đủ của tài liệu tại đây (621.15 KB, 25 trang )
BioMed Central
Page 1 of 25
(page number not for citation purposes)
Journal of Translational Medicine
Open Access
Research
Validation of a HLA-A2 tetramer flow cytometric method,
IFNgamma real time RT-PCR, and IFNgamma ELISPOT for
detection of immunologic response to gp100 and MelanA/MART-1
in melanoma patients
Yuanxin Xu*, Valerie Theobald, Crystal Sung, Kathleen DePalma,
Laura Atwater, Keirsten Seiger, Michael A Perricone and Susan M Richards
Address: Genzyme Corporation, One Mountain Road, Framingham, Massachusetts, MA 01701, USA
Email: Yuanxin Xu* - ; Valerie Theobald - ;
Crystal Sung - ; Kathleen DePalma - ; Laura Atwater - ;
Keirsten Seiger - ; Michael A Perricone - ;
Susan M Richards -
* Corresponding author
Abstract
Background: HLA-A2 tetramer flow cytometry, IFNγ real time RT-PCR and IFNγ ELISPOT assays
are commonly used as surrogate immunological endpoints for cancer immunotherapy. While these
are often used as research assays to assess patient's immunologic response, assay validation is
necessary to ensure reliable and reproducible results and enable more accurate data interpretation.
Here we describe a rigorous validation approach for each of these assays prior to their use for
clinical sample analysis.
Methods: Standard operating procedures for each assay were established. HLA-A2 (A*0201)
tetramer assay specific for gp100
209(210M)
and MART-1
26–35(27L)
, IFNγ real time RT-PCR and
ELISPOT methods were validated using tumor infiltrating lymphocyte cell lines (TIL) isolated from
HLA-A2 melanoma patients. TIL cells, specific for gp100 (TIL 1520) or MART-1 (TIL 1143 and
TIL1235), were used alone or spiked into cryopreserved HLA-A2 PBMC from healthy subjects.
TIL/PBMC were stimulated with peptides (gp100
209
, gp100
pool
, MART-1
27–35
, or influenza-M1 and
negative control peptide HIV) to further assess assay performance characteristics for real time RT-
PCR and ELISPOT methods. Validation parameters included specificity, accuracy, precision,
linearity of dilution, limit of detection (LOD) and limit of quantification (LOQ). In addition,
distribution was established in normal HLA-A2 PBMC samples. Reference ranges for assay controls
were established.
Results: The validation process demonstrated that the HLA-A2 tetramer, IFNγ real time RT-PCR,
and IFNγ ELISPOT were highly specific for each antigen, with minimal cross-reactivity between
gp100 and MelanA/MART-1. The assays were sensitive; detection could be achieved at as few as 1/
4545–1/6667 cells by tetramer analysis, 1/50,000 cells by real time RT-PCR, and 1/10,000–1/20,000
by ELISPOT. The assays met criteria for precision with %CV < 20% (except ELISPOT using high
PBMC numbers with %CV < 25%) although flow cytometric assays and cell based functional assays
are known to have high assay variability. Most importantly, assays were demonstrated to be
Published: 22 October 2008
Journal of Translational Medicine 2008, 6:61 doi:10.1186/1479-5876-6-61
Received: 3 October 2008
Accepted: 22 October 2008
This article is available from: />© 2008 Xu et al; licensee BioMed Central Ltd.
This is an Open Access article distributed under the terms of the Creative Commons Attribution License ( />),
which permits unrestricted use, distribution, and reproduction in any medium, provided the original work is properly cited.
Journal of Translational Medicine 2008, 6:61 />Page 2 of 25
(page number not for citation purposes)
effective for their intended use. A positive IFNγ response (by RT-PCR and ELISPOT) to gp100 was
demonstrated in PBMC from 3 melanoma patients. Another patient showed a positive MART-1
response measured by all 3 validated methods.
Conclusion: Our results demonstrated the tetramer flow cytometry assay, IFNγ real-time RT-
PCR, and INFγ ELISPOT met validation criteria. Validation approaches provide a guide for others
in the field to validate these and other similar assays for assessment of patient T cell response.
These methods can be applied not only to cancer vaccines but to other therapeutic proteins as part
of immunogenicity and safety analyses.
Background
Cancer immunotherapy clinical trials often use immuno-
logical assessment as secondary endpoints to evaluate vac-
cine potency. A number of techniques have been
established to monitor antigen specific immunologic
responses in patients. Many of these assays monitor T cell
responses and were comprehensively reviewed by Keil-
holz et al. [1]. Most commonly used methods include: (1)
direct measurement of serological cytokines, (2) T cell
functional analysis for cell proliferative response, CTL,
and cell associated cytokine production by Flow Cytome-
try and ELISPOT, and cytokine gene expression by real
time RT-PCR, (3) cell phenotypic analysis (multi-color
Flow Cytometry) including antigen specific T cell detec-
tion using HLA tetramers and additional cell phenotypic
analysis for activated T cells, regulatory T cells (Treg), and
naïve/memory T cells. Assay development studies (IFNγ
Real Time RT-PCR and ELISPOT, HLA-A2 Tetramer analy-
sis) and monitoring specific vaccine response in cancer
patients are described by a number of investigators [2-10].
Although many different assays are used to monitor
immune response in cancer patients, few of these assays
are validated when used for clinical applications
[1,3,11,12]. Furthermore, the validation of immu-
noassays was identified as one of the critical areas for
improvement when using these assays to evaluate
immune responses in the clinic [1].
Unlike assays used for research studies, clinical assays
need to be simple and robust, with reasonable turn
around time, and high throughput. Minimal sample
manipulation during sample collection, processing, ship-
ment, storage, and testing are added advantages. Assays
requiring small sample volume are also preferable. Meth-
ods that meet these criteria are optimized for each compo-
nent and step during assay development/pre-validation
studies. Standard Operating Procedures (SOP) and assay
validation plans with acceptance criteria are followed in
validation studies to further assess assay performance
characteristics. Regulatory agencies and published white
papers provide guidance on validation of analytical meth-
ods and immunogenicity methods to monitor anti-pro-
tein drug antibody response. Less information is available
for validation of flow cytometry and T cell functional
assays, which are generally more challenging.
We developed and validated HLA-A2 flow cytometry,
IFNγ real time RT-PCR, and IFNγ ELISPOT assays to mon-
itor specific CD8
+
T cell responses in HLA-A2 melanoma
patients immunized with genetic vaccines encoding glyc-
oprotein 100 (gp100) or MART-1, two melanoma-associ-
ated antigens. We report our study on validation of the
three methods using TIL cells alone or spiked into normal
PBMC samples. The performances of the assays were fur-
ther confirmed using PBMC from immunized patients.
Assay performance met validation criteria and all three
assays were shown to be effective for their intended use,
monitoring patient's antigen specific T cell response.
Methods
TIL cells, Jurkat cells, and frozen PBMCs from healthy
subjects and melanoma patients
TIL cells
Frozen CD8
+
TIL cells (isolated from HLA-A2 melanoma
patients) were generously provided by Dr. Steven A.
Rosenberg (NCI, NIH, Bethesda, MD) including TIL1520
(gp100 specific), TIL1235 (MART-1 specific), and
TIL1143 (MART-1 specific). Each TIL cell line was
expanded to generate a working cell bank. Cells were
stored at -120°C in single use aliquots. Freshly thawed
cells were used in all studies.
Jurkat cells
MART-1 Jurkat cells recognizing HLA-A2/MART-1
tetramer and negative control Jurkat cells were kindly pro-
vided by Ray Zane and Judi Baker (Beckman Coulter
Immunomics, San Diego, CA).
Frozen PBMC Samples: Frozen peripheral blood mono-
nuclear cells (PBMCs), screened HIV negative, were used
in this study. PBMC from blood of HLA-A2 healthy sub-
jects (AllCells, LLC, Emeryville, CA and American Red
Cross) were isolated using Ficoll gradient centrifugation
method. Cells were stored at -120°C and freshly thawed
for analysis following standard procedures. PBMC was
used as negative matrix in TIL cell spiking studies and also
Journal of Translational Medicine 2008, 6:61 />Page 3 of 25
(page number not for citation purposes)
serve as antigen presenting cells (APC) in real time RT-
PCR and ELISPOT analysis. Proof of principle studies were
performed using frozen PBMC from three melanoma
patients (kindly provided by Dr. Francesco Marincola,
NCI, NIH, Bethesda, Maryland).
Patient PBMC samples
Frozen PBMC from the fourth melanoma patient which
demonstrated immunologic response is also included as
an example; samples from this patient are part of the clin-
ical testing to monitor cancer vaccine potency of a Phase
I/II clinical trial conducted by Genzyme Corporation.
Antibodies, peptides, tetramers, oligonucleotides, and
other critical reagents
Antibodies
The following antibodies and reagents were used: anti-
CD8-FITC (BD Bioscience, San Jose, CA), anti-human
IFNγ (Pharmingen, San Diego, CA), biotinylated anti-
human IFNγ (Pharmingen),
Peptides
HLA-A2 (*0201) restricted peptides for gp100 included
peptides beginning with amino acid (aa) number 154,
209 (native or 210M-modified), 280, 457, and 476. HLA-
A2 restricted antigenic peptide for MART-1 included pep-
tide 26–35 (native)/26–35 (27L, modified). The peptides
were synthesized by New England Peptides, Inc. (Gardner,
MA) and their aa sequences are shown, gp100
209
(IDTQVPFSV), gp100 peptide pool [gp100
209
, gp100
154
(KTWGQYWQV), gp100
280
(YLEPGPVTA), gp100
457
(LLOGTATLRL), and gp100
476
(VLYRYGSFSV)], MART-
1
27–35
(AAGIGILTV), Flu (GILGFVFTL), and HIV
(ILKEPVHGV). All PBMC samples were screened negative
for HIV, allowing use of HIV peptide as negative controls.
All peptides are HLA-A2 (Class I) restricted, therefore,
CD8
+
T cell IFNγ response is expected upon peptide stim-
ulation.
Tetramers
The following HLA-A2 (A*0201) tetramers (Beckman
Coulter Immunomics, San Diego, CA) were used includ-
ing Negative Control (T01044, containing a proprietary
irrelevant peptide not being recognized by human TCR),
gp100
209–217(210M)
(T01012, IMDQVPFSV), MART-1
26–
35(27L)
(T01008, ELAGIGILTV), and Influenza-Flu
(T01011, GILGFVFTL) tetramer. Modified gp100 and
MART-1 tetramers with prolonged stability and high affin-
ity were used. To minimize assay variability, tetramers
used here for assay validation were from the same lot as
the ones for clinical sample testing. All three tetramers
(gp100, MART-1, and Negative) were assembled from the
same Biotinylated HLA-A2 monomer lot and the same
Streptavidin-PE lot. Stability of the tetramers was moni-
tored using TIL cells. All tetramers contain HLA-A2
restricted peptides, therefore only CD8
+
T cells are
expected to be detected.
Oligonucleotides
Oligonucleotide primers for real time RT-PCR were syn-
thesized by Life Technologies. For IFNγ and CD8 cDNA
synthesis, human IFNγ reverse transcription (RT) primer
(5'-CTTTCCAATTCTTCAAAATG-3') and CD8 RT primer
(5'-GACAGGGGCTGCGAC-3') were used, respectively.
For Real Time RT-PCR analysis, the following primer pairs
were used, human IFNγ forward primer (5'-ACGTCT-
GCATCGTTT TGGGTT-3')/reverse primer (5'-GTTCCAT-
TATCCGCTACATCTGAA-3') and human CD8 forward
primer (5'-CCCTGAGCAACTCCATCA TGT-3')/reverse
primer (5'-GTGGGCTTCGCTG GCA-3'). Probes were syn-
thesized by IDT for detection of IFNγ (5'-TCTTGGCTGT-
TACT GCCAGGACCCA-3') and CD8 (5'-TCAGCCACTT
CGTGCCG GTCTTC-3').
Additional critical reagents
Streptavidin-Alkaline Phosphatase (Pharmingen) for
ELISPOT; PHA (Sigma, St Louis, MO) as positive controls
for real time RT-PCR and ELISPOT; Qiagen Rneasy Mini
Kit (74106, Qiagen), Promega Reverse Transcription Kit
(A3500, Promega), and TaqMan Universal Mix (4304437,
Applied Biosystems) for RT-PCR.
Equipment
FACSCalibur with CellQuest Pro software (BD Bio-
sciences, San Jose, CA) was used for Tetramer analysis.
ABI Prism 7700 division sequence detector (Perkin Elmer/
Applied Biosystem was used for real time PCR studies.
The FACSCalibur and ABI Prism 7700 division sequence
detector were calibrated and maintained under GLP com-
pliance. Analysts were trained on equipment SOPs prior
to performing the studies.
Zeiss stereomicroscope (Carl Zeiss, Germany) was used
for ELISPOT analysis.
Additional equipment (pipettes, balance, incubator,
biosafety cabinet, centrifuge, freezer, and refrigerator, etc)
were all calibrated and maintained under GLP compli-
ance.
Tetramer assay
The tetramer assay was optimized prior to initiation of the
validation study (data not shown). Tetramer (0.1 μg/mL)
titration (2.5, 5, 10, and 20 μL) was performed and the
use of 10 μL was found to be optimal. Long term perform-
ance of the tetramer was monitored to achieve optimal
binding and to assure longitudinal assay performance.
Tetramer binding temperature (room temperature-RT or
Journal of Translational Medicine 2008, 6:61 />Page 4 of 25
(page number not for citation purposes)
2–8°C) was also evaluated and RT was chosen. Co-stain-
ing with anti-CD3 showed decrease tetramer binding
probably due to proximity of CD3 and TCR, therefore
anti-CD3 staining was not used. Fixed cells were shown to
have decreased binding as compared to fresh. Therefore,
freshly thawed, unfixed PBMC were used for validation
study and clinical sample testing.
Since there is a very low percentage of gp100 and MART-1
tetramer positive cells in healthy subjects, TIL cells were
used for method validation studies. TIL1520 (gp100 spe-
cific) or TIL1143 (MART-1 specific) at 1–5 × 10
4
cells/100
μL/tube were stained in FACS buffer (PBS without Ca
2+
and Mg
2+
, 1% BSA, 0.1% Sodium Azide) with 10 μL of
tetramer-PE (0.1 μg/μL) and 10 μL of anti-CD8-FITC at
room temperature (RT) for 1 hour in a 23–25°C incuba-
tor. Cells were washed with 3 mL of FACS buffer and har-
vested by centrifugation at 290 g (1500 rpm) for 7
minutes. Cells were re-suspended in 0.5 mL of FACS
buffer. Ten μL of Propidium Iodide (PI) was added before
acquisition for viable cell gating. Total of 10,000 to
20,000 TIL cells (un-gated events) were acquired. For fro-
zen PBMC analysis, same staining procedure was used
except that a total of 10
6
freshly thawed cells were stained
and 500,000 cells were acquired. Data was analyzed using
Cell Quest Pro Software. Percent tetramer positive cells
among viable CD8
+
cells were shown in quadrant statistics
from CD8-FITC vs. Tetramer-PE dot blot. Viable CD8
+
cells were defined by simultaneous gating on the triple
regions, region 1 (lymphocytes from FSC vs. SSC), region
2 (viable cells-PI negative cells from FSC vs. PI), and
region 3 (CD8+ cells from FSC vs. CD8). Assay validation
was performed under GLP and following the method
SOP.
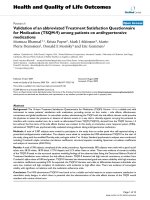
As an example, Flu tetramer binding to frozen PBMC from
a HLA-A2 healthy subject is shown in Figure 1, including
gating sequence (A) lymphocyte-FSC vs. SSC, (B) viable
cells (PI negative)-FSC vs. PI, and (C) CD8
+
T cells-FSC vs.
CD8 FITC. Tetramer positive cells are illustrated in (D) on
gated viable lymphocytes-CD8 FITC vs. Flu Tetramer PE
gated on viable lymphocytes, CD8 negative cells that lack
tetramer binding are also shown.
IFN
γ
real time PCR assay
Freshly thawed HLA-A2 PBMCs at 10
6
cells/mL/well,
duplicate wells in 24-well plate, were cultured for 2 hours
at 37°C with 5% CO
2
and 95% humidity in serum free
medium (AIM-V, GIBCO/BRL) stimulated with gp100
209
,
gp100
pool
, MART-1, Flu, PHA (positive control), or HIV
(negative control). Peptides were used at 10 μg/mL/well
for gp100
209
, gp100
pool
, MART-1, Flu, or HIV. TIL1520
(gp100 specific) and TIL1235 (MART-1 specific) spiked
into PBMC at various cell numbers were used as positive
controls. After stimulation, cells were harvested and RNA
prepared following Qiagen RNA extraction protocol. RNA
was stored at <-60°C until use. RNA was thawed and con-
centration and purity were determined by spectropho-
tometer at wavelength A
260/280
(OD
260
/OD
280
ratio).
Synthesis of cDNA was done following manufacturer's
protocol (Promega) using AMV Reverse Transcriptase
with 25 μM of RT primer for IFNγ or CD8. Samples were
stored at -15°C until further analysis.
Real Time RT-PCR analysis was performed using forward
and reverses primer (each at 25 μM) for IFNγ or CD8. The
probes were used at 0.2 and 0.3 μL for IFNγ and CD8,
respectively.
Positive control cDNA (IFNγ and CD8 plasmid, Invitro-
gen) were run in duplicate at various concentrations to
generate standard curves for IFNγ and CD8. Copy num-
bers for IFNγ and CD8 was determined.
For clinical data analysis, ratio of IFNγ over CD8 copy
numbers (IFNγ/CD8) upon stimulation with gp100
209
,
gp100
pool
, MART-1, Flu, or PHA (a positive control) was
compared with the ratio from HIV stimulation (negative
control). Data was analyzed using mRNA copy number
fold increase, defined as [(IFNγ/CD8)
gp100, MART-1, Flu, or
PHA
/(IFNγ/CD8)
HIV
].
IFN
γ
ELISPOT analysis
ELISPOT 96-well plates (MIP-S4510, Millipore) were
coated with 100 μL of anti-human IFNγ antibody at 10 μg/
mL in Carbonate buffer (Poly Sciences) overnight at 2–
8°C. Plates were washed, blocked with PBS containing
2.5% BSA (2.5 g/100 mL) for 1–2 hours at 36–38°C in an
incubator with 5% CO
2
and ~95% humidity, and washed
a second time prior to use.
Freshly thawed PBMC alone or TIL cell [TIL1520 (gp100
specific) or TIL1235 (MART-1 specific)] spiked at different
levels into PBMC (4 × 10
5
cells/100 μL/well, PBMC High)
were used. Due to the limited supply of clinical samples,
the assay was also validated using a lower concentration
of PBMC (10
5
/100 μL/well, PBMC Low). In this assay,
freshly thawed patient PBMC (10
5
/100 μL/well) was used.
Cells were cultured in triplicate wells for 24 hours at 36–
38°C with 5% CO
2
and 95% humidity in AIM-V media
with Penicillin and Streptomycin. Peptides were added at
10 μg/mL including gp100
209
, gp100
pool
, MART-1
27–35
,
Flu, or HIV. PHA was used as positive control.
Following culture, the cells were discarded and plates were
washed with PBS. Biotinylated anti-human IFNγ was
added at 100 μL/well (1.5 μg/mL, Pharmingen) and plates
were incubated for 2 hours at room temperature (in a 22–
26°C incubator). Plates were washed and 100 μl of
Strepavidin-Alkaline Phosphatase (Pharmingen)at
Journal of Translational Medicine 2008, 6:61 />Page 5 of 25
(page number not for citation purposes)
1:1000 dilution was added. Plates were incubated for 30
minutes at room temperature and washed. Substrate
BCIP/NBT (KPL) was added following the manufacturer's
protocol and spots were allowed to develop for approxi-
mately 4 minutes or until spots were visible. The reaction
was stopped with dH
2
O. Plates were dried overnight in
the dark and IFNγ secreting cells (spots/well) were
counted under a dissecting microscope with a video mon-
itor. Data was analyzed using average spot number/well/
10
5
cells, PBMC Low (or 4 × 10
5
, PBMC High) from trip-
licate wells. The final data was presented as number of
IFNγ secreting cells (stimulated with gp100
209
, MART-1
27–
35
, gp100
pool
, Flu, or PHA) – IFNγ secreting cells (stimu-
lated with HIV as negative control).
Statistical analysis
Tetramer flow cytometric analysis was performed using
Cell Quest Pro software (BD Biosciences) and % tetramer
positive cells were obtained from quadrant statistics
among gated viable CD8
+
T cells.
Detection of tetramer positive cells among PBMCFigure 1
Detection of tetramer positive cells among PBMC. Gating sequence is shown in the upper panel. (A) R1-Lymphocyte
gate, FSC (x-axis) vs. SSC (y-axis). (B) R2-Viable cell gate, FSC (x-axis) vs. PI (y-axis). (C) R3-CD8
+
cell gate, FSC (x-axis) vs.
CD8 FITC (y-axis). Flu-tetramer positive cells are shown in (D) Flu tetramer positive cells, CD8 FITC (x-axis) vs. Flu tetramer
PE (y-axis), gated on R1 and R2 for viable lymphocyte. CD8 negative cells are shown (with R3 off), demonstrating assay specif-
icity.
(A) Lymphocyte (B) Viable cells (C) CD8
+
cells
-FSC vs. SSC -FSC vs. PI -FSC vs. CD8 FITC
(D) Flu tetr amer positive cells
-CD8 FITC vs. Flu tetramer PE
Journal of Translational Medicine 2008, 6:61 />Page 6 of 25
(page number not for citation purposes)
IFNγ Real Time PCR analysis was done using ABI Prism
7700 software for mRNA quantification.
Additional statistical analysis was performed to examine
assay accuracy and precision using Microsoft Excel. Accu-
racy was assessed by % Recovery, (detected value/expected
reference value) × 100. Precision was examined using %
CV (coefficient of variation), (SD/Mean) × 100. Linearity
of Dilution (linear regression analysis) was performed
using GraphPad Prism 4 (Version 4.02). Regression anal-
ysis of post-vaccine immunologic response in the repre-
sentative melanoma patient was performed using JMP 7
software.
Results
Part 1: Tetramer assay validation
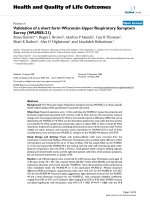
Specificity
Specificity (Selectivity) is the ability of an analytical
method to differentiate and quantify the analyte in the
presence of other components in the sample.
Tetramer assay specificity is defined as TIL cells which lack
binding to negative tetramer and irrelevant tetramer and
show specific binding to the relevant tetramer (TIL1520
binding to gp100 and TIL1143 binding to MART-1). Low
background binding was observed from cells with no
tetramer (0.00% for TIL1520 and 0.02% for TIL1143, data
not shown) or stained with the negative tetramer (0.09%
for TIL1520 and 0.02% for TIL1143), Figure 2(A).
Tetramer binding specificity is demonstrated, Figure 2(A);
the gp100 tetramer showed specific binding to TIL1520
cells (61.22%) and not TIL1143 cells (0.06%, data not
shown); similarly, MART-1 tetramer bound specifically to
TIL1143 (4.40%) and not TIL1520 cells (0.19%, data not
shown).
Unlike the high percentage of binding of gp100 tetramer
to TIL1520, MART-1 tetramer binding to TIL1143 was at a
much lower percentage probably due to activation associ-
ated TCR down modulation on TIL1143 (data not
shown). To confirm that MART-1 tetramer can maximally
detect all of the MART-1 specific T cells under the assay
conditions used, Jurkat cells that were genetically modi-
fied to express TCR that recognizes MART-1/HLA-A2 (gen-
erously provided by Judi Baker and Ray Zane, Beckman
Coulter Immunomics, San Diego, CA) were used and 97%
of MART-1 tetramer positive cells were detected; irrelevant
gp100 tetramer binding to the MART-1 Jurkat cells was
minimal (0.04%), Figure 2(B). Control Jurkat cells did
not show binding to MART-1 tetramer while there was
some background binding to the gp100, Figure 2(B). Due
to the following acquisition sequence (MART-1 Jurkat/
gp100, MART-1 Jurkat/MART-1, Control Jurkat/gp100,
and Control Jurkat/MART-1), we believe that carry over of
the MART-1 Jurkat/MART-1 tetramer sample caused back-
ground staining in Control Jurkat/gp100 tetramer. This
experiment could not be repeated due to an insufficient
number of cells.
Accuracy
The accuracy of an analytical method describes the close-
ness of mean test results (detected) obtained by the
method to the true value (expected) of the analyte. Accu-
racy was assessed by percent recovery [(detected value/
expected value) × 100] and 80–120% is considered
acceptable.
Due to the lack of true value from a standard reference
material for the tetramer assay and lymphocyte pheno-
type analysis using flow cytometric methods in general,
our attempt at assessing accuracy was unsuccessful. We
used detected data values from undiluted TIL cells to
establish reference true value for the diluted samples (by
multiplying the dilution factor); % tetramer positive cells
detected especially at the low level, were found to be out-
side of 80–120% of the reference value, data not shown.
TIL cells showed tetramer binding variability due to cul-
ture conditions and cell passages; this variability makes
establishing a true value using detected values from undi-
luted samples challenging.
To monitor long term assay performance, we generated
TIL1520 and TIL1143 working cell banks stored in liquid
N
2
in a single using aliquot and used freshly thawed cells
(no additional cell culture) as assay quality control mate-
rial. (data is shown under precision-long term inter-assay
performance assessment).
Precision
The precision of an analytical method describes the close-
ness of agreement (degree of scatter) between a series of
measurements obtained from multiple sampling of the
same homogenous sample under the prescribed condi-
tions.
Intra assay precision (repeatability) expresses the preci-
sion under the same operating conditions over a short
interval of time (in a single assay). Intra assay precision is
determined by % CV (coefficient of variation) as (SD/
Mean) × 100 tested multiple times by one analyst in a sin-
gle assay. Inter assay precision (Intermediate Precision) is
defined as the variability of a sample (% CV) tested in
multiple assays on more than one day. For example, fac-
tors that contribute to inter assay variability for the
tetramer assay include cell preparation, staining methods,
machine setting, gating during acquisition and data anal-
ysis. Percent CV <20% is considered acceptable for analyt-
ical assays in general. For flow cytometry assays to detect
cells at a very low level, a higher %CV is expected. Since a
low frequency of tetramer positive cells is expected among
Journal of Translational Medicine 2008, 6:61 />Page 7 of 25
(page number not for citation purposes)
Tetramer assay specificityFigure 2
Tetramer assay specificity. (A) TIL cell binding: % tetramer positive cells are shown based on data in the upper right quad-
rant from each of the 4 blots. TIL1520 (top panel) were stained with negative tetramer (left) and gp100 tetramer (right).
TIL1143 (bottom panel) were stained with negative tetramer (left) and MART-1 tetramer (right). (B) MART-1 Jurkat cell bind-
ing: % tetramer positive cells are shown based on data in the upper right quadrant from MART-1 Jurkat cell blots (lower panel)
stained with irrelevant gp100 tetramer (left) or relevant MART-1 tetramer (right). Control Jukat cells (upper panel) were
stained with both tetramers (% tetramer positive cells are <0.05%, data not shown).
(A) TIL cell binding
-Percent CD8 positive/tetramer positive cells from upper right quadrant in each blot are
shown.
TIL1520 (upper left) TIL1520 (upper r ight)
- CD8 FITC vs. Negative PE -CD8 FITC vs. gp100 PE
TIL1143 (lower left) TIL1143 (lower r ight)
-CD8 FITC vs. Negative PE -CD8 FITC vs. MART-1 PE
(B) MART-1 J ur kat cell binding
-% CD8 positive/tetramer positive cells from upper right quadrant for MART-1 Jurkat
cells are shown
Control Jurkat (upper left) Control J ur kat (upper right)
-CD8 FITC vs. gp100 PE -CD8 FITC vs. MART-1 PE
0.09% 61.22%
0.02% 4.40%
0.04% 97%
MART-1 J ur kat (lower left) MART-1 J ur kat (lower r ight)
-CD8 FITC vs. gp100 PE -CD8 FITC vs. MART-1 PE
Journal of Translational Medicine 2008, 6:61 />Page 8 of 25
(page number not for citation purposes)
patient PBMC, using a high percentage of gp100 tetramer
positive cells among TIL1520 is not suitable for assess-
ment of assay precision at the low level. TIL1520 was also
spiked into the negative population (TIL1520 stained
with the negative tetramer) to generate two samples con-
taining a low percentage of gp100 tetramer positive cells
(Low 1 and Low 2) for assessment of assay precision.
Undiluted TIL cells were included as a high control
(High).
Intra assay precision (% CV) for both gp100 and MART-1
tetramer are acceptable (<20% CV). Representative data is
shown in Table 1. Precision for gp100 tetramer showed
precision of 2%CV using undiluted TIL1520 (High). Per-
cent CV was 16 and 10% when TIL1520 were further
diluted to generate samples with a lower percentage of
tetramer positive cells. For MART-1, % CV is 6%.
Inter assay precision (% CV) for gp100 was 18% and
MART-1 was 15%, and therefore both met the validation
criteria (<20%), Table 1. Analyst variability (%CV)
between 2 operators is 12% (gp100) and 20% (MART-1);
equipment shut down/re-start variability (% CV = 2% for
MART-1) was minimal (data not shown). Due to high
assay variability inherent in flow cytometric methods and
the low level of tetramer positive cells (expected in
patients), we a designed clinical testing regimen to mini-
mize assay variability. In this testing regimen, frozen lon-
gitudinal PBMC samples from each patient were tested in
a single assay by a single operator.
TIL cells maintained in culture at different passages expe-
rience variation in TCR expression level which could con-
tribute to variability in the tetramer assay. To monitor
long term assay performance, a working cell bank was pre-
pared for each line (TIL1520 and TIL1143) and cells were
frozen in single use aliquots. Freshly thawed cells (with-
out additional culturing) were analyzed in each assay for
clinical sample testing, serving as quality controls. This
practice allows us to analyze long term (2 year) inter-assay
precision (February 2003 to May 2005) which was not
feasible during assay validation. Precision (%CV) from 48
assays performed by three different operators showed that
gp100 tetramer analysis had acceptable %CV (7%), Table
1. MART-1 tetramer analysis variability was high with %
CV of 45%, probably due to the low level of tetramer pos-
itive cells in combination with the high inter-assay varia-
bility that is expected in flow cytometric methods. This
finding supported our clinical testing regimen; all longitu-
dinal frozen PBMC samples from each patient were tested
in a single assay by a single operator, allowing assessment
of vaccine potency compared to pre-treatment baseline
values in each patient.
Table 1: Tetramer assay precision
Tetramer gp100 MART-1
Cells TIL1520 TIL1143
Intra assay
High Range 54.48–57.21 3.33–3.96
Mean (n = 5) 56.15 3.64
SD 1.14 0.23
%CV 2 6
Low 1 Individual Value 1.05, 1.32
Mean (n = 2) 1.19
SD 0.19
%CV 16
Low 2 Individual Value 0.52, 0.60
Mean (n = 2) 0.56
SD 0.06
%CV 10
Inter assay
High Range 41.86–62.63 3.26–4.65
Mean (n = 5) 53.38 3.74
SD 9.44 0.55
%CV 18 15
Long term
High Range 62.69–99.49 1.45–7.75
Mean (n = 48) 93.24 4.10
SD 6.48 1.85
%CV 7 45
Data is shown as % Tetramer positive cells (Range, Mean, n, SD, and %CV). Cells are
used as undiluted (High) or diluted in the negative population (Low 1 and Low 2 for
TIL1520). Long term assay precision (inter assay) is shown using data collected in 48
tests.
Journal of Translational Medicine 2008, 6:61 />Page 9 of 25
(page number not for citation purposes)
Spike and recovery
Assessment of spike and recovery of an analyte in biolog-
ical matrix (matrix effect) is defined as the direct or indi-
rect alteration or interference in response due to the
presence of unintended analytes or other interfering sub-
stances in the sample.
Due to the lack of a standard reference material to estab-
lish a true value, recovery (% tetramer positive cells
detected) could not be assessed. In addition, the TIL cells
showed unexpected FSC vs. SSC properties. Compared to
resting T cells among PBMC, TIL cells resembled activated
lymphocytes. (lymphocyte blasts). The use of a single gate
to analyze the mixed cell population (TIL spiked in
PBMC) was also found to be challenging (data not
shown). Although TIL cells have the same HLA-A2 allele
as the PBMC used here, the non-A2 alleles are expected to
be different for other HLA loci (DR and DQ, for example),
which could result in cell-cell interaction (aggregation).
Limit of detection (LOD) and limit of quantification (LOQ)
LOD is defined as the lowest concentration of an analyte
that the bioanalytical procedure can reliably differentiate
from background noise.
LOQ is defined as the lowest amount of an analyte in a
sample that can be quantitatively determined with suita-
ble precision and accuracy.
Due to the lack of a standard reference material to estab-
lish a true value, LOQ was not examined for the tetramer
assay. Assay LOD and sensitivity was examined.
MART-1 (27L) tetramer is known to be recognized by
CD8
+
T cells in healthy subjects, therefore, % MART-1
tetramer positive cells in normal PBMC samples (endog-
enous level), shown in distribution study (Table 2), could
not be used to assess background signal. Low % positive
cells were detected among 20 PBMC samples using the
negative control tetramer and gp100 tetramer, 0.11% and
0.07%, respectively (Mean value from 20 samples,
described in Normal Distribution studies). At such low
level, assay variability is expected to be higher and SD was
found to be 0.11% (negative tetramer) and 0.09%
(gp100). It is not a common practice in the field to use the
negative control tetramer binding to establish assay back-
ground noise level; most laboratories use values from
unstained cells. Our data showed that unstained cells had
0% tetramer positive cells in most cases. However, on
occasion, positive cells were found with values less than
0.06% (data not shown).
Assay sensitivity can be improved by collecting a larger
number of events on the cytometer. Due to the limited
supply of TIL cells and clinical PBMC samples from
patients and the need for reasonable assay throughput/
turn around time to maintain cell viability during acquisi-
tion, we evaluated total acquisition events vs. cell quality
(viability by PI and % tetramer positive cells). Our data
supported collection of 10,000–20,000 TIL cells and
200,000–500,000 PBMC. To further assess assay sensitiv-
ity under our assay condition, we spiked Flu positive
donor PBMC at various percentages (100, 50, 25, 12.5,
6.3, 3.1, and 0) into the negative PBMC (unstained cells
from the same donor) and % Flu tetramer positive cells
were analyzed from total of 200,000 events collected. At
the lowest level assessed (3.1% Flu positive PBMC among
negative PBMC), Flu tetramer positive cells were detected
in 2 tests at 0.022 % (1/4545) and 0.015 (1/6667). We
expect that with increased total acquisition events, our
assay sensitivity could reach the level found by other lab-
oratories (0.01–0.0125%, equivalent to 1/8000–1/
10,000). Studies were also performed using TIL1520
spiked into TIL1143 stained for gp100 and TIL1143
spiked into TIL1520 stained for MART-1. Assay sensitivity
was 1/1000 to 1/2000 due to the lower number of events
(10,000) collected. We believe our assay sensitivity is
equivalent to the level found by other laboratories. Due to
limited volume of samples collected in melanoma
patients, we were limited to acquiring the number of
events as described in this manuscript.
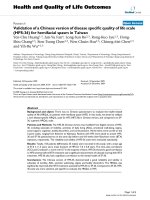
Calibration standard curve and linearity of dilution
Due to the lack of a standard reference material and know-
ing that TIL cells have different binding characteristics
(affinity, specificity, etc) compared to patient PBMC, a cal-
ibration standard curve was not used to quantify tetramer
positive cells.
The highest % tetramer positive cells were detected using
undiluted TIL cells. TIL cells were further diluted into the
negative cell population to assess assay linearity.
TIL1520 cells (gp100 positive) were spiked into a negative
population at 12.5%, 6.25%, 3.1%, 1.56%, 0.78%,
0.39%, and 0% (x-axis) and %gp100 positive cells (y-axis)
were analyzed. Sample dilution linearity is shown in Fig-
ure 3(A). TIL1520 cell dilution (x) vs. % gp100 positive
cells (y) showed good correlation (r
2
0.9977, y = 0.28× +
0.06), using linear regression analysis. Similarly, TIL1143
cells (MART-1 positive) were spiked into a negative popu-
lation at 100, 50, 25, 12.5, 6.25, 3.1, 1.56, 0.78, 0.39, and
0% (x-axis) and the % MART-1 tetramer positive cells (y-
axis) were analyzed. TIL1143 cell dilution linearity is
shown in Figure 3(B), also with good correlation (r
2
0.9754, y = 0.04× + 0.14). Compared to TIL1520 (gp100),
a lower degree of linearity was observed for TIL1143
(MART-1). Dashed line illustrates the best fit from linear
regression analysis.
Journal of Translational Medicine 2008, 6:61 />Page 10 of 25
(page number not for citation purposes)
Sample stability
Sample stability was assessed and a summary is described
here (data not shown). Short-term stability (room tem-
perature and 2–8°C) was poor for both fresh blood (<48
hour) and PBMC (<24 hour); such storage is not recom-
mended. Clinical blood samples were processed at the site
upon collection using the Ficoll gradient method for
PBMC isolation. The PBMC were then cryopreserved and
stored in liquid nitrogen (LN
2
) until shipment to Gen-
zyme (on dry ice). Upon thawing, long term stability
(LN
2
, -120°C) was evaluated using trypan blue exclusion
and by additional T cell functional analysis (proliferative
response to mitogen PHA using
3
H-TdR incorporation).
Frozen PBMC were found to be stable for at least 5 years
and we continue to evaluate the stored PBMC samples
over time. Freeze/thaw stability is limited to 1 cycle, which
is well-documented. Freshly thawed samples were ana-
lyzed immediately in Tetramer, Real time RT-PCR, and
ELISPOT assays.
PBMC stability for real time RT-PCR and ELISPOT will not
be discussed separately.
Normal distribution
HLA-A2 PBMCs from 20 healthy subjects were tested in
the tetramer assay to define normal distribution (Table 2).
Among 20 normal individuals, binding to negative
tetramer (0.11%) and gp100 (0.07%) was low. Higher
MART-1 (27L) binding (0.55%) was observed. MART-1
tetramer is known to be cross-reactive in healthy PBMC
samples, described previously by Pittet et al. [13]. MART-
1 positive cells detected in normal PBMC samples were
found to have low MFI (median fluorescent intensity), in
contrast to MART-1 positive cells detected in TIL1143. It is
difficult to distinguish MART-1 positive cells with low MFI
from the negative cells and the percent is largely depend-
ent on quadrant position. Therefore, defining the tetramer
positive cell population in patients cannot rely solely on
the percentage of positive cells especially those with low
MFI. Identification of a distinct population, well sepa-
rated from the negative population, and with high MFI is
also important.
Determining reference ranges for assay controls
Assay controls consisted of single use aliquots of TIL1520
(gp100 control) and TIL1143 (MART-1 control) working
cell banks stored frozen in LN
2
. Freshly thawed longitudi-
nal PBMC samples from each patient were analyzed for
gp100 and MART-1 tetramer binding in a single assay
using these positive controls. Data from TIL controls was
compared to historical data. Negative control tetramer
binding to TIL cells and PBMC was also used as negative
controls.
PBMC viability (>80% viable by trypan blue exclusion
after thaw) and PI exclusion during flow cytometry data
analysis were additional cell quality controls.
Table 2: Normal distribution, tetramer binding among 20
healthy subjects
Donors Negative gp100 MART-1
1 0.07 0.07 0.42
2 0.04 0.02 0.49
3 0.02 0.02 0.47
4 0.05 0.02 0.43
5 0.04 0.02 0.54
6 0.12 0.02 0.59
7 0.03 0.04 0.40
8 0.13 0.02 0.58
9 0.24 0.07 0.48
10 0.07 0.06 0.63
11 0.04 0.07 0.82
12 0.07 0.02 0.55
13 0.11 0.05 0.39
14 0.03 0.02 0.63
15 0.10 0.04 0.39
16 0.06 0.02 0.26
17 0.03 0.06 0.35
18 0.06 0.24 ND
19 0.40 0.35 1.15
20 0.40 0.25 0.82
Mean 0.11 0.07 0.55
SD 0.11 0.09 0.21
Range 0.02–0.40 0.02–0.35 0.21–1.15
ND, not determined due to insufficient cells.
% Tetramer positive cells for negative tetramer, gp100, and MART-1
are shown.
Journal of Translational Medicine 2008, 6:61 />Page 11 of 25
(page number not for citation purposes)
Tetramer assay linearity of dilutionFigure 3
Tetramer assay linearity of dilution. (A) TIL1520 binding to gp100 tetramer. Correlation of % TIL1520 used (x-axis) vs. %
gp100 tetramer positive cells detected (y-axis) is shown. (B) TIL1143 binding to MART-1 tetramer. Correlation between %
TIL1143 used (x-axis) vs. % MART-1 tetramer positive cells (y-axis) is illustrated.
(A) TIL1520 binding to gp100 tetramer
TIL1520 Linearity of Dilution
0.0 2.5 5.0 7.5 10.0 12.5 15.0
0
1
2
3
4
% TIL1520
% gp100+ Cells
(B) TIL1143 binding to MART-1 tetr amer
TIL1143 Linearity of Dilution
0 25 50 75 100 125
0
1
2
3
4
% TIL1143
% MART-1+ Cells
Journal of Translational Medicine 2008, 6:61 />Page 12 of 25
(page number not for citation purposes)
Part 2: IFN
γ
real time RT-PCR validation
Specificity
IFNγ real time RT-PCR specificity is defined as lack of
response to irrelevant peptides and HIV negative control
peptide and positive response to relevant peptide stimula-
tion (TIL1520 with gp100 peptides and TIL1235 with
MART-1 peptide).
The real-time RT-PCR assay showed a high level of specif-
icity through the validation process. HLA A2 PBMC alone
from healthy subjects did not show response to
melanoma peptides; a dose dependent IFNγ response,
fold increase (IFNγ relevant peptide/CD8)/(IFNγ
HIV
/
CD8), was only seen in PBMC with spiked TIL cells stim-
ulated with relevant peptide, TIL1520 stimulated with
gp100
209
and gp100
pool
and TIL1235 stimulated with the
MART-1 peptide (Figure 4). As expected, these TIL cells
did not respond to the irrelevant peptide (data not
shown) or the negative control (HIV) peptide. The posi-
tive control PHA response produced consistently high
IFNγ expression levels indicating cell viability and
expected cell function (described later in Spike and recov-
ery, LOD and LOQ, and Normal distribution studies).
Variability was observed among individual donors, which
was probably due to differences in % CD8
+
T cells and
antigen presenting cells as well as cell functionality. A
complete data set will be shown and discussed in normal
distribution studies.
Accuracy and precision
The real time RT-PCR assay was examined for assay accu-
racy and precision by spiking 1000 copies of IFNγ plasmid
per sample in 80 repeats (n = 80) for intra-assay and 18
repeats (n = 18) for inter-assay performance characteris-
tics. Two analysts performed the analysis. Assay was found
to be both accurate and precise with % recovery between
80–120% (analyst 2 had a 123%) and % CV < 20%,
respectively (Table 3).
Calibration standard curve and linearity of dilution
A standard curve was run using plasmid (10 to 10
8
copies,
1:10 serial dilution) and no-template controls (Figure 5).
Linearity was determined by using a standard curve (start-
ing quantity vs. threshold cycle-Ct) generated using plas-
mid IFNγ at 10–10
8
copies. Linear amplification of log
serial dilutions was observed with Slope (-3.368), Y-inter-
cept (40.155), and Correlation Coefficient (1.000).
Standard curve was determined on 6 TaqMan plates and
no significant differences were found.
Spike and recovery
TIL 1520 and TIL1235 spiked in HLA A2 PBMC (from 10
healthy subjects) and stimulated with peptides were used
to further assess real time RT-PCR assay performance char-
acteristics. Dose (number of TIL cells) dependent IFNγ
response was observed (Table 4). IFNγ response, [(IFNγ/
CD8)
peptideorPHA
/(IFNγ/CD8)
HIV
], correlated with
increased number of TIL cells spiked. TIL1520 responded
to gp100 peptides, Table 4(A) and TIL1235 responded to
MART-1 peptide, Table 4(B). Response to HIV, Flu, and
PHA was also observed as expected. HIV response was low
in all donors. Flu and PHA response vary among different
individuals, which may due to difference in number of
CD8
+
T cells and antigen presenting cells, as well as cell
function.
LOD and LOQ
LOQ and LOD were determined by spiking IFNγ plasmid
and internal control CD8 plasmid at various copy num-
bers (1 to 10
5
). Each sample was measured in 12 repeats
and assay results were summarized in Table 5. LOQ for
both IFNγ and CD8 is determined as 1000 copies where
quantification was achieved with acceptable accuracy (%
Recovery within 80–120%) and precision (% CV < 20%).
LOD for IFNγ and CD8 is 100 copies where all 12 repeats
tested positive above the background.
LOD for gp100 and MART-1 specific IFNγ response was
further assessed using TIL1520 and TIL1235 spiked in
PBMC, also described in normal distribution studies
(Table 4).
LOD was determined as 1/50,000 cells where IFNγ
response was detected above the HIV control (fold
increase of 1.0) and PBMC only (no TIL spiked).
Normal distribution
Normal distribution of real time RT-PCR (PBMC only, no
spiked TIL cells) is shown in Table 4. Average IFNγ
response (fold increase) to gp100 (209 and pool) and
MART-1 from healthy subjects (n = 10) is <1.1.
Part 3: IFN
γ
ELISPOT validation
This assay was first validated using 80 TIL cells spiked into
4 × 10
5
PBMC per well (96 well plate), designated as High
PBMC Assay. Due to the limited volume of blood col-
lected from clinical melanoma patients, we also validated
the assay using a lower number of PBMC (80 TIL cells
spiked into 10
5
PBMC/well), designated as Low PBMC
Assay. Peptide concentrations remained the same. Com-
pared to the Low PBMC Assay, IFNγ secreting cells among
the same number of TIL cells were found to be slightly
higher in the High PBMC Assay, probably due to a higher
number of antigen presenting cells in the PBMC popula-
tion.
Data presented here are from the low PBMC assay except
in LOD and LOQ; data from both high and low PBMC
assays are shown.
Journal of Translational Medicine 2008, 6:61 />Page 13 of 25
(page number not for citation purposes)
IFNγ real time RT-PCR specificityFigure 4
IFNγ real time RT-PCR specificity. TIL cells at different numbers were spiked into 10
6
PBMC; response (Fold Increase
over HIV, normalized by CD8 copy numbers) vs. TIL cell frequency is shown. (A) Full TIL dose range (0 to 1 TIL/1000 PBMC)
and (B) Response at lower dose range (0 to 0.2 TIL/1000 PBMC)
(A) Dose response: IFNJresponse is TIL cell dose dependent (0 to 1 TIL/1000
PBMC)
(B) Expanded dose response: Graph in (A) is expanded to show details at the lower
doses
Journal of Translational Medicine 2008, 6:61 />Page 14 of 25
(page number not for citation purposes)
Specificity
ELISPOT specificity is defined as the lack of response to
irrelevant peptides and HIV peptide together with a posi-
tive response to relevant peptide stimulation (TIL1520
with gp100 peptides and TIL1235 with MART-1 peptide).
To evaluate assay specificity, a total of 80 TIL cells were
spiked into PBMC (10
5
cells/well) and the number of
IFNγ secreting cells following peptide stimulation was
examined. Two analysts, each using two PBMC lots, per-
formed five assays each. Data from two PBMC lots were
comparable and variability between the two analysts was
low. Data from PBMC lot 1 by analyst one is shown in
Table 6. Among TIL1520, IFNγ secreting cells/well (aver-
age from triplicate wells), were detected upon gp100
209
stimulation at an average of 41 secreting cells/well. Stim-
ulation with gp100
pool
containing gp100
209
did not result
in an increased frequency of IFNγ secreting cells (39 cells/
well) compared to gp100
209
alone, confirming that the
TIL1520 is gp100
209
specific. This is consistent with the
real time RT-PCR findings (described in Part 2). Similarly,
IFNγ secreting cells were detected among TIL1235 follow-
ing MART-1 peptide stimulation at an average of 9 secret-
ing cells/well. Lower numbers of secreting cells (<2) were
detected upon irrelevant peptide stimulation, further
demonstrating assay specificity. PBMC stimulated with
Flu peptide showed IFNγ response at 212 IFNγ secreting
cells/well while HIV response was low with 0.9 IFNγ
secreting cells/well (data not shown).
Precision
Cell based functional assays such as ELISPOT are expected
to have high assay variability. We consider intra assay pre-
cision acceptable with % CV < 20% and inter assay preci-
sion acceptable with % CV < 25%.
Assay precision was assessed using 80 TIL cells spiked in 4
× 10
5
PBMC per well (High PBMC assay) and the data is
summarized below. For intra assay, two analysts each
tested samples in eight repeats. Average IFNγ secreting
cells/well (n = 8) from 2 PBMC lots by two analysts were
found to be 37–67 (TIL1520 stimulated with gp100
209
),
39–63 (TIL1520 stimulated with gp100
pool
), and 22–39
(TIL1235 stimulated with MART-1). Percent CV ranged
from 8.3–17.6% for intra assay precision which is consid-
ered acceptable (%CV < 20%). Inter assay precision was
examined and each analyst assessed two PBMC lots in five
assays. Average secreting cells (n = 5) was found to be 41–
52 (TIL1520 with gp100
209
), 37–52 (TIL1520 with
gp100
pool
), 18–31 (TIL1235 with MART-1). Among 12
runs (2 PBMC lots, 2 analysts, 3 peptides), % CV from
nine runs showed % CV ranged from 8.7–20.3%. Three
tests had % CV > 20% including 21.3% (TIL1520/PBMC1
with gp100 pool by Analyst 1), 21.6% (TIL1235/PBMC1
with MART-1 by Analyst 2), and 22.6% (TIL1235/PBMC2
with MART-1 by Analyst 2). Inter assay precision (%CV <
25%) is considered acceptable.
Data from 80 TIL cells spiked into two PBMC lots at 10
5
cells (low PBMC assay) were analyzed by two analysts
each performed eight intra-day assays and 10 inter-day
assays. Cells were stimulated with relevant peptide
(gp100
209
and gp100
pool
to TIL1520 and MART-1 to
TIL1235) and IFNγ secreting cells were examined. Data
(Table 7) from PBMC lot 1 and Analyst one is shown as
an example. Both intra assay (% CV < 20%) and inter
assay (% CV < 20%) precision was found to be acceptable,
except TIL1520 stimulated with gp100
pool
showed %CV of
20.8% Cells stimulated with irrelevant peptide and HIV
had very low background signal and % CV was high, as
expected.
Accuracy, spike and recovery, and LOQ
Due to the lack of a reference standard material to estab-
lish a true value, assay accuracy, spike and recovery, and
LOQ were not examined.
Table 3: IFNγ real time RT-PCR accuracy and precision
Analysts 1 Analysts 2
Intra Assay (n = 80)
Expected Value 1000 1000
Detected Value (Mean) 954 1233
SD 109 216
Precision (% CV) 11.4% 17.5%
Accuracy (% Recovery) 95% 123%
Inter Assay (n = 18)
Expected Value 1000 1000
Detected Value (Mean) 1100 1133
SD 14 65
Precision (% CV) 10.3% 5.8%
Accuracy (% Recovery) 110% 113%
Data is shown as IFNγ gcopy numbers determined by 2 analysts to
assess accuracy and precision for intra assay (a single assay with 80
repeats) and inter assay (in 18 inter day runs). Expected value is the
copy number used as PCR template. Accuracy is examined using %
Recovery (Detected/Expected) and precision is examined using %CV
(SD/Mean).
Journal of Translational Medicine 2008, 6:61 />Page 15 of 25
(page number not for citation purposes)
Plate homogeneity
Samples loaded at different locations across a 96-well
microtiter plate showed comparable results (data not
shown).
LOD and assay sensitivity
LOD (assay sensitivity) was assessed by spiking diminish-
ing numbers of TIL1520 and TIL1235 cells into 4 × 10
5
PBMC (High) or 10
5
PBMC (Low) per well. TIL1520/
PBMC were stimulated with gp100
209
and gp100
pool
and
TIL1235/PBMC were stimulated with MART-1. The LOD
was determined to be the least number of secreting cells
that could be distinguished from the background (>10
cells/well) upon stimulation with relevant peptide. The
acceptable level of background secreting cells was
obtained from irrelevant peptide stimulation, HIV pep-
tide stimulation and from the results of the normal distri-
bution study (Table 8). Data from the normal distribution
study showed the number of background IFNγ secreting
cells (Mean + 2 SD) to be as follows: gp100
209
(8.9),
gp100
pool
(5.2), MART-1 (6.5), and HIV (6.7). Therefore,
we consider background to be 10 IFNγ secreting cells/well.
For the High PBMC assay, the LOD for gp100 was defined
as the ability to detect IFNγ secreting cells at frequency of
1/20,000 (15 secreting cells/well) among TIL1520. The
LOD for MART-1 is at 1/10,000 (14 secreting cells/well).
The data shown in Table 9 demonstrates that the assay
sensitivity from the high PBMC assay is similar to the
results published by other laboratories.
At first glance, assay sensitivity does not appear to be as
good when the lower number of PBMC was used (10
5
cells/well), Table 8. Although we could still detect 10–13
spots, the detection frequency was found to be 1/8000 (10
secreting cells/well) for gp100 and 1/2000 (11 secreting
cells/well) for MART-1. This finding is due to the fact that
the PBMC cell count is used as the denominator when cal-
culating the detection frequency. The lower cell number in
the denominator creates a mathematical artifact of dimin-
ishing assay sensitivity. The number of secreting cells
(spots) detected per well is also related to the TIL cells
used. With high TIL cell numbers, we could generate 100–
200 spots per well, however, resolution for counting the
spots was decreased. In summary, 10–50 spots/well give
us a reliable assessment of the counts, either by manual
counting or computer assisted counting (data not shown).
Sensitivity of our assay is similar to what described in the
field when High PBMC was evaluated.
Calibration standard curve and linearity of dilution
Due to the lack of a standard reference material, calibra-
tion standard curves were not evaluated for quantification
of cellular IFNγ response.
Linearity of dilution was evaluated using various TIL cells
spiked into 4 × 10
5
(High PBMC) and 10
5
(Low PBMC)
per well. IFNγ secreting cells/well at various TIL/PBMC
ratios were examined. At High PBMC level, TIL1520 at 1/
1250, 1/2500, 1/5000, and 1/10,000 stimulated with
gp100
209
showed dose dependent response; IFNγ secret-
ing cells diluted from the highest number (>100 cells/
well) to ~20. Good correlation was demonstrated (r
2
at
0.997 and 0.998 from 2 PBMC lots) using linear regres-
sion. TIL1235 at 1/625, 1/1250, 1/2500, 1/5000, 1/
10,000 stimulated with MART-1 also showed dose
IFNγ real time RT-PCR standard curve (linearity)Figure 5
IFNγ real time RT-PCR standard curve (linearity). Linear response (IFNγ plasmid copy number vs. Ct) is shown. Curve
characteristics are also indicated.
Journal of Translational Medicine 2008, 6:61 />Page 16 of 25
(page number not for citation purposes)
dependent response. Correlation (r
2
) is 0.989 and 0.897
from 2 PBMC lots.
Data from Low PBMC (10
5
cells/well) is shown in Figure
6. Correlation (r
2
) was found to be 0.944 (gp100209) and
0.967 (MART-1).
Normal distribution
Eight normal PBMC samples (10
5
/well) were evaluated in
normal distribution studies. Response to gp100
209
,
gp100
pool
, MART-1 and HIV in all samples are below 10
IFNγ secreting cells/well. The mean (n = 8) and SD are
shown in Table 8. Two samples showed low and high
level of Flu response, with secreting cells at 15 and 241,
respectively.
Determining reference ranges for assay controls
A control HLA-A2 PBMC working cell bank was estab-
lished for use as an assay control. To assure plate to plate
consistency, TIL1520 and TIL1235 (80 cells/well) were
spiked into 10
5
HLA-A2 PBMC/well and were evaluated
for the number of IFNγ secreting cells upon stimulation
with gp100
209
, gp100
pool
, and MART-1 peptide. HIV pep-
tide was used as a negative controls and PHA (mitogen
stimulation) as positive control. Control reference ranges
(Mean +/- 2 SD) were established to monitor assay per-
formance.
Table 4: Real time RT-PCR spike and recovery and normal distribution: IFNγ response from TIL cells spiked in normal PBMC
(A) TIL1520 response to gp100 peptides
Flu gp100
209
gp100
pool
PHA
TIL1520/PBMC Mean SD Mean SD Mean SD Mean SD
PBMC only 40.1 95.0 0.9 0.4 1.1 0.4 337.4 316.4
1/50000 56.7 148.0 4.0 4.2 2.8 1.6 261.9 238.9
1/20000 33.5 76.4 16.1 18.3 8.9 8.2 347.3 439.2
1/10000 40.0 100.4 14.1 8.6 34.5 65.7 168.4 163.8
1/5000 40.9 99.9 24.2 21.4 21.4 15.0 258.8 227.3
1/1000 25.9 63.4 55.2 30.3 49.8 36.9 126.1 95.8
(B) TIL1235 response to MART-1 peptide
Flu MART-1 PHA
TIL1235/PBMC Mean SD Mean SD Mean SD
PBMC only 28.2 51.7 1.1 0.5 366.3 516.5
1/50000 36.1 101.3 1.8 1.1 162.2 142.6
1/20000 56.8 113.8 3.1 1.8 161.1 145.1
1/10000 58.7 125.1 3.7 1.8 183.7 197.9
1/5000 41.3 86.3 5.2 2.2 163.6 199.1
1/1000 46.1 98.0 17.8 12.3 168.1 221.7
TIL cells at different numbers were spiked into PBMC from individual healthy donors and IFNγ response examined. Response (average from 10
different donors) is shown as fold increase. All donors are HLA-A2 positive screened and confirmed to be HIV negative. Peptide stimulation is HLA-
A2 restricted and specific for CD8
+
T cells. The SD is high due to variability in individual response among 10 healthy subjects. This finding is
expected. Fold increase is calculated as follows using CD8 as internal controls: (IFNγ from peptide and mitogen stimulation/CD8)/(IFNγ from HIV
stimulation/CD8).
Journal of Translational Medicine 2008, 6:61 />Page 17 of 25
(page number not for citation purposes)
Part 4: Three validated assays demonstrated their intended
use: detection of CD8+ T cell response in melanoma
patients
Post-treatment PBMC obtained from three melanoma
patients treated in an IRB approved melanoma vaccine
protocol of the National Cancer Institute, Bethesda, MD
(generously provided by Francesco Marincola) were ana-
lyzed for IFNγ response by real time RT-PCR and ELIS-
POT, Table 10(A) and 10(B). Response to gp100 was
observed while MART-1 response was low. Tetramer anal-
ysis was not performed in our laboratory due to limited
supply of the PBMC samples. Communication with Dr.
Marincola confirmed that these patients demonstrated
presence of gp100 tetramer positive cells (measured by
Dr. F Marincola's tetramer method).
A representative melanoma patient who received Ad2/
gp100v2 and Ad2/MART-1v2 gene therapy cancer vaccine
in Genzyme Phase I/II clinical study demonstrated posi-
tive MART-1 responses measured by all three assays, Table
10(C). No gp100 specific response was observed in this
patient. Compared to pre-treatment baseline response,
increased MART-1 response [% MART-1 positive cells
(Tetramer Assay), IFNγ fold increase (Real time RT-PCR),
and IFNγ secreting cells (ELISPOT)], was observed
approximately 21 days after the first dose. Increased
MART-1 specific response were sustained out to study
completion (after this patient received total of planned 6
doses, at ~day 140) and follow up (~day 256). Percent
MART-1 tetramer positive cells are also shown in dot blots
(Figure 7).
A regression analysis showed that in the tetramer assay,
there is a significant linear trend between time (days) and
% MART-1 positive cells with p-value of 0.0071, and the
relation could be expressed as:
% MART-1 Tetramer Positive Cells = 0.0013 × days + 0.68
Table 5: IFNγ real time RT-PCR LOQ and LOD
Expected copies Detected copies (Mean, n = 12) SD Number of positive results/total 12 tests % Recovery %CV
IFNγ 12/12
100,000 104,508 15,676 12/12 105% 15%
10,000 9,032 1,174 12/12 90.3% 13%
1,000 942 198 12/12 94.2% 21%
100 80 27.2 12/12 80% 34%
10 10 NA 8/12 NA NA
1 1 NA 3/12 NA NA
CD8
100,000 93,334 8,400 12/12 93% 9%
10,000 10,533 2,001 12/12 105% 19%
1,000 1,035 134 12/12 103% 13%
100 109 41.4 12/12 109% 38%
10 14 NA 10/12 NA NA
1 2 NA 3/12 NA NA
NA, not applicable (spiked copy number at 10 and 1 did not show detection in all 12 tests, therefore SD, % Recovery, and %CV is not analyzed).
IFNγ plasmid at different copy numbers were used for assessment of LOQ and LOD. Expected and detected values are shown. % Recovery
(Detected/Expected) and % CV (SD/Mean) are calculated to assess assay accuracy and precision, respectively.
Journal of Translational Medicine 2008, 6:61 />Page 18 of 25
(page number not for citation purposes)
In the other two assays (IFNγ Real Time RT-PCR and ELIS-
POT), samples that were collected at the last patient's visit
demonstrated a IFNγ response much higher than both the
baseline response (by ELISPOT only, no RT-PCR baseline
data) and earlier post vaccine time points. However, there
is no statistically significant linear trend between time
(days) and the IFNγ response with a p-value > 0.05
(0.3506 for Real Time RT-PCR and 0.1441 for ELISPOT).
In summary, assay performance of each assay met the val-
idation criteria and the three validated assays demon-
strated that they served their intended use.
Discussion
The use of a wide variety of different immunoassays to
assess immunological endpoints in cancer immuno-
therapy clinical trials has provoked recommendations
that standardization and rigorous validation of these
immunoassays is needed [1,11]. In response to these rec-
ommendations, we put three immunoassays, the
tetramer, ELISPOT, and real time RT-PCR assays through
a rigorous validation process in preparation for our cancer
vaccine clinical trials. These assays met key validation cri-
teria necessary for generating reliable clinical data. The
assays were determined to be specific for each antigen,
gp100 or MART-1. Assay precision for cell based func-
tional assays met the criteria with % CV < 20% (intra day)
and < 25% (inter day).
Assays were found to be sensitive with the real time RT-
PCR being the most sensitive at 1 in 50,000 PBMCs. The
tetramer flow cytometric method sensitivity was deter-
mined to be 1/4545–6667 (Tetramer Assay collecting 1
million events) and the ELISPOT sensitivity was at 1/
10,000–20,000 (using high PBMC assay), similar to data
reported by others [1]. For ELISPOT, assessment of assay
sensitivity depends on number of TIL cells spiked into the
number of PBMCs as the negative cell population. Due to
the limited number of PBMC that could be obtained from
melanoma patients, we also validated the ELISPOT assay
using a low PBMC number and assay sensitivity was poor
(1/2000); this is due to a mathematical calculation where
responder TIL cells were spiked into a smaller PBMC pop-
ulation and this smaller number served as the denomina-
tor. Higher TIL cell numbers resulted in a larger number
of secreting cells (100–200 cells/well), which were diffi-
cult to count due to poor resolution. We performed a TIL
cell titration study and demonstrated that 10–50 cells/
well provided significant resolution to achieve a reliable
assessment of cell numbers.
Similarly, a larger number of total events collected for the
tetramer assay will improve assay sensitivity. With limited
patient PBMC samples and the need for assay throughput
and cell quality (viability) during sample acquisition, we
validated the tetramer assay with ~500,000 total events
collected. When one million PBMC was collected, assay
Table 6: IFNγ ELISPOT assay specificity
TIL TIL1520 TIL1235
TIL specificity gp100
209
MART-1
Peptide specificity Relevant Relevant Irrelevant Relevant Irrelevant Irrelevant
Peptide gp100
209
gp100
pool
MART-1 MART-1 gp100
209
gp100
pool
144411822
242311901
3374011021
4433211011
538522711
Mean (n = 5) 41 39 1.1 9 1.3 1.3
SD 3.1 8.5 0.4 1.2 0.8 0.6
TIL cells (80 cells/well) were spiked in two different lots of PBMC (10
5
cells/well), stimulated with peptides, and analyzed for the number of IFNγ
secreting cells per well (average value from triplicate wells). Two analysts each performed five assays. The numbers of IFNγ secreting cells from 2
PBMC lots by two analysts were found to be comparable. Data (secreting cells, Mean from 5 tests, and SD) from PBMC lot 1 by analyst 1 is shown
as an example.
Journal of Translational Medicine 2008, 6:61 />Page 19 of 25
(page number not for citation purposes)
Table 7: IFNγ ELISPOT assay precision
(A) Intra assay precision
TIL TIL1520 TIL1520 TIL1235
Peptide gp100
209
gp100
pool
MART-1
Peptide specificity Relevant Relevant Relevant
Test
1343319
2304329
3363526
4403523
5454125
6373421
7323418
8283522
Mean (n = 8) 35 36 23
SD 5.3 3.6 3.4
% CV 15% 10% 15%
(B) Inter Assay Precision
Cells TIL1520 TIL1520 TIL1235 PBMC PBMC TIL1235 TIL1235 TIL1520
Peptide gp100
209
gp100
pool
MART-1 Flu HIV gp100
209
gp100
pool
MART-1
Specificity Relevant Relevant Relevant Irrelevant Irrelevant Irrelevant
Tests
1444181951221
2423192061011
33740101981211
44332102221111
5385272401112
63839102541022
73954122781112
Journal of Translational Medicine 2008, 6:61 />Page 20 of 25
(page number not for citation purposes)
sensitivity was improved but samples acquired at a later
time showed poor cell viability. We also evaluated the use
of fixed cells after staining, and found the MFI to be much
lower suggesting tetramer binding to fixed TCR was poor.
Similar differences in sensitivity between different immu-
noassays have been previously observed [10]. Assay sensi-
tivity is also influenced by the T cell line (TIL cells) used
to validate an immunoassay, and few groups use the same
T cell lines. For example, only 33% of the cells in the
TIL1520 cell line were responsive to peptide stimulation
[14]. Comparisons between laboratories will likely be in
closer agreement when the same cell lines are used to val-
idate an immunoassay and same TIL cells number/PBMC
number is used. As an example, the sensitivity of our ELIS-
POT assay was in close agreement with a previously pub-
lished report where the TIL1520 were used to determine
ELISPOT sensitivity [14]. A set of standard cell lines would
enable a comparison of assay performance between labo-
ratories.
While effector T cell responses can reliably be measured
by each of these immunoassays, an important challenge is
in determining the value that constitutes a positive
response. A strong positive immunologic response meas-
ured by the MART-1 tetramer assay, such as the example
shown in Figure 7, is often indisputable. Such a response
profile showed a clear defined MART-1 tetramer positive
CD8
+
T cell population that was well separated from the
tetramer negative CD8
+
T cell population. This clearly sug-
gests that immunization successfully enhanced the
immune response. Low percentages of tetramer positive
cells were seen in pre-treatment baseline sample. The
binding resembles the tetramer positive cells specific for
foreign antigens (Flu) in Figure 1, demonstrating breaking
of tolerance to self antigen (MART-1).
On the other hand, positive responses are more likely to
be detected at low percentages in the blood making it
much more difficult to define a positive immunological
response to a cancer vaccine. Therefore, guidelines need to
be implemented on data analysis and interpretation based
on assay performance characteristics such as precision and
LOD. Use of proper negative controls such as the negative
control tetramer, will help distinguish a positive response
by setting the correct quadrant for data analysis to reduce
subjectivity, especially when tetramer positive cells are not
well separated from the negative population. Fold
increase (>2 fold) of post-treatment response over the
baseline value has been used, however, baseline values
near zero value could result in an artificially high fold
84946132450112
93632112261214
10 38 34 8 224 1 1 1 1
Mean (n = 10) 41 40 10 229 0.9 1.2 1.3 1.6
SD 3.9 8.4 1.8 26.0 0.3 0.8 0.6 0.9
% CV 9.6 20.8 18.3 11.4 33.3 66.6 46.2 56.3
A total of 80 TIL cells were spiked into 10
5
PBMC per well (Low PBMC) and tested in 8 repeats (intra assay) and 10 tests (inter assay) by two
analysts. Average IFNγ gsecreting cells per well (triplicate wells) upon peptide stimulation are shown. Mean, SD, and %CV is shown for PBMC 1 by
Analyst 1 as an example.
Table 7: IFNγ ELISPOT assay precision (Continued)
Table 8: ELISPOT assay normal distribution
gp100
209
gp100
pool
MART-1 Flu HIV
1234152
242451
354432
422332
522131
695687
722454
80122411
Mean 3.3 2.6 3.5 35.4 2.5
SD 2.8 1.3 1.5 83.2 2.1
Mean + 2 SD 8.9 5.2 6.5 201.8 6.7
HLA-A2 PBMC (10
5
cells/well) from healthy donors were stimulated
with peptides and the number of IFNγ secreting cells determined.
Journal of Translational Medicine 2008, 6:61 />Page 21 of 25
(page number not for citation purposes)
Table 9: IFNγ ELISPOT LOD
TIL1520 TIL1520 TIL1235
Peptide gp100
209
gp100
pool
MART-1
PBMC High TIL Cells/well TIL/PBMC
80 1/5,000 53 57 15
40 1/10,000 27 30 14
20 1/20,000 15 17 4
8 1/50,000 3 6 0
4 1/100,000 6 0 1
PBMC Low
200 1/500 86 84 28
100 1/1000 52 59 19
50 1/2000 37 38 11
25 1/4000 22 31 7
12 1/8000 13 10 3
TIL cells were spiked into 4 × 10
5
(High) or 10
5
PBMC (Low) per well and limit of detection was determined (IFNγ Secreting Cell Frequency). The
lowest IFNγ secreting cells detected above the background is considered LOD, values shown in bold. The corresponding TIL/PBMC ratio indicates
assay sensitivity.
ELISPOT linearity of dilutionFigure 6
ELISPOT linearity of dilution. IFNγ dose response, TIL/PBMC (x-axis) vs. Secreting cells (y-axis) is shown in bar graphs and
best-fit linear curve is indicated as solid line. (A) TIL1520 response to gp100
209
. (B) TIL1235 response to MART-1.
(A) TIL1520 response to gp100
209
(B) TIL1235 response to MART-1
Journal of Translational Medicine 2008, 6:61 />Page 22 of 25
(page number not for citation purposes)
Table 10: Immunologic response was detected in melanoma patients after vaccination
(A) IFNγ real time RT-PCR
Patient gp100
209
gp100
209/210M
gp100
pool
MART-1 HIV
1 76.9 138.1 26.2 2.5 1
2 3.2 3.4 6.1 0.8 1
3 8.5 12.5 4.5 4.5 1
HLA-A2 PBMC from three melanoma patients known to have a positive clinical response was analyzed for IFNγ response by real time RT-PCR.
IFNγ response fold increase over HIV, (IFNγ
peptide
/CD8)/(IFNγ
HIV
/CD8), is shown.
(B) IFNγ ELISPOT
Patient gp100
209
gp100
209/210M
gp100
pool
MART-1 HIV
1 56 65 26 0 2
2 50 62 39 0 16
3 11 16 5 0 1
HLA-A2 PBMC from three melanoma patients known to have a positive clinical response was analyzed for IFNγ response by ELISPOT. IFNγ
secreting cells (per well, average value from triplicate wells) are shown.
(C) Positive MART-1 response was seen in PBMC from a melanoma patient evaluated in all three validated assays.
Method ELISPOT Real Time RT-PCR Tetramer Assay
IFNγ secreting cells IFNγ copy number
fold increase
% MART-1 tetramer
positive cells
Baseline
(Pre, 11/29/00)
0ND0.5
Post-Vaccine
(Post-1
st
dose, 12/
20/00)
14 5.7 1.2
Study Completion
(Post 6
th
dose, 4/18/
01)
7 4.2 2.4
Follow Up
(8/15/01)
73 57.6 4.1
ND, not determined (insufficient cells for this analysis).
ELISPOT data is presented as the number of secreting cells after HIV background subtraction. Real time RT-PCR data is shown as copy number fold
increase (over HIV) with CD8 as internal controls. Tetramer data is presented as % positive cells with negative tetramer background subtracted.
Journal of Translational Medicine 2008, 6:61 />Page 23 of 25
(page number not for citation purposes)
increase. Subtraction of the post-treatment value from the
baseline value and subtraction of data from the negative
control have also been used; analysis and interpretation of
negative values remain challenging.
Interestingly, MART-1 tetramer positive CD8+ T cells were
detected among both healthy volunteers and in
melanoma patients who received cancer vaccines. Among
healthy volunteers, MART-1 positive cells showed low
MFI (median) probably reflecting low affinity/avidity
(MFI is not shown). In patients, however, MART-1 posi-
tive cells had high MFI (Figure 7). Function of these
MART-1 positive CD8
+
T cells were reported that the cells
in healthy volunteers may be of naïve phenotype, which
lacks effector function (presence of CTL precursors); how-
ever, in cancer patients, these cells have the memory phe-
notype [15-17]. Their effector function was demonstrated
in vitro upon MART-1 peptide stimulation (in the presence
of APC such as dendritic cells) using methods such as
cytokine production (IL-2, GM-CSF, IFNγ) and CTL activ-
ity.
Correlation of MART-1 specific CD8
+
T cells in peripheral
blood with the presence of CTL cells at the tumor site and
clinical response in vivo is still not fully established
[15,17-20]. A majority of the peptide reactive CD8
+
cells
may not be tumor reactive due to various mechanisms
such as down modulation of HLA class I on tumor cell
surface and presence of regulatory T cells and TGFβ, etc.
Sorting of the tetramer positive cells for generation of CTL
in vitro has been used as adoptive transfer (cell based ther-
apy) in melanoma patients [21,22]. Correlation of immu-
nologic response to clinical response (tumor regression)
still needs to be established [15,17,20]. MART-1 specific
CD8
+
T cell response in one patient, as an example, was
detected by all three validated clinical assays, HLA-A2
MART-1 tetramer assay, IFNγ real time RT-PCR and ELIS-
POT (Figure 7 and Table 10), demonstrating the assay
utility in monitoring patient T cell response. Correlation
to clinical response, however, was not demonstrated. A
better understanding of the immune response seen in
peripheral blood vs. the response at the tumor site will
help us more fully understand the mechanisms of cancer
vaccine and its potency.
The use of validated methods for clinical patient monitor-
ing is important. When following patient longitudinal
responses over time, our understanding of assay perform-
ance will assist us in implementing procedures that reduce
assay variability and the use of QC samples will allow us
MART-1 tetramer positive cells detected in a melanoma patient upon vaccinationFigure 7
MART-1 tetramer positive cells detected in a melanoma patient upon vaccination. Patient's PBMC was analyzed
for % MART-1 tetramer positive cells. Cells stained with negative control tetramer (upper panel) and MART-1 tetramer (lower
panel) is shown. Tetramer positive cells in dot blots on gated viable lymphocytes are shown. No binding is seen among CD8
negative cell population. Percent tetramer positive cells shown are calculated based on gated viable CD8
+
T cells. Trend analy-
sis demonstrated statistical significant linear response.
KW 031203.009
10
0
10
1
10
2
10
3
10
4
CD8 FITC
KW 031203.007
10
0
10
1
10
2
10
3
10
4
CD8 FITC
KW 031203.010
10
0
10
1
10
2
10
3
10
4
CD8 FITC
KW 031203.012
10
0
10
1
10
2
10
3
10
4
CD8 FITC
KW 031203.016
10
0
10
1
10
2
10
3
10
4
CD8 FITC
KW 031203.018
10
0
10
1
10
2
10
3
10
4
CD8 FITC
KW 031203.013
10
0
10
1
10
2
10
3
10
4
CD8 FITC
KW 031203.015
10
0
10
1
10
2
10
3
10
4
CD8 FITC
Pre-vaccine Post-vaccine Study Follow up
completion
0.12% 0.06% 0.07% 0.12%
0.62% 1.30% 2.50% 4.17%
CD8 FITC
Negative
MART-1
Journal of Translational Medicine 2008, 6:61 />Page 24 of 25
(page number not for citation purposes)
to monitor assay long term performance; making data
generated from these validated methods more meaning-
ful. While the validation of these three T cell assays was
challenging, the experience we obtained during validation
studies and conducting patient screening will assist us and
others in the field to validate similar assays for assessment
of patient T cell responses to not only to cancer vaccines
but to other therapeutic proteins as part of immunogenic-
ity and safety analysis.
Conclusion
In this manuscript, we reported data from validation stud-
ies to characterize three T cell assays, HLA-A2 tetramer
Flow cytometric method, IFNγ real time RT-PCR, and IFNγ
ELISPOT for detection of gp100 or MART-1 specific CD8
+
T cell response.
Although challenging, our results showed that T cell func-
tional assays can be validated to support clinical longitu-
dinal sample testing to monitor patient T cell response to
cancer vaccines. All three assays demonstrated their
intended use for detection of cancer vaccine specific T cell
response (Figure 7 and Table 10). Use of validated assays
in clinical patient monitoring minimized assay reproduc-
ibility problems and allowed better interpretation of clin-
ical data.
Abbreviations
Ad2, Adenovirus 2. CD4 or CD8, cluster of differentiate 4
or 8, helper T (CD4) and cytotoxic T (CD8) cells. DC,
Dendritic cell. ELISPOT, enzyme linked immunospot
assay. Gp100, melanoma tumor antigen. HIV, human
immunodeficiency virus. HLA, human leukocyte antigen;
HLA-A2, HLA allele A*0201. MART-1, melanoma tumor
antigen. PBMC, peripheral blood mononuclear cell PCR,
polymerase chain reaction.
Competing interests
All authors are Genzyme employees except KD and KS
who were formal Genzyme employees. We have received
salary from Genzyme Corporation.
Authors' contributions
YX, wrote the manuscript, led the tetramer assay study,
and analyzed data for ELISPOT and RT-PCR studies. VT,
reviewed the manuscript and led the ELISPOT study. CS,
led the RT-PCR study. KD, acquired and analyzed tetramer
data. LA, acquired and analyzed RT-PCR data. KS,
acquired and analyzed ELISPOT data. MAP, supervised
pre-validation studies for tetramer, RT-PCR, and ELISPOT
and assisted writing the manuscript. SMR, supervised all
validation studies for tetramer, RT-PCR, and ELISPOT and
gave final approval of the version to be published.
Acknowledgements
Authors thank Ray Zane and Judi Baker from Beckman Coulter Immunom-
ics for providing the control and MART-1 specific Jurkat T cells and their
effort to manufacture a single batch of tetramers (gp100 and MART-1) for
use in both assay validation and clinical sample testing. Authors are grateful
to Donna Hempel and Karen Smith (Genzyme) for pre-validation studies,
and Susan Griffin (Genzyme) for coordinating clinical sample collection,
processing, and shipment. We thank Yuemei Wang for statistical analysis.
We appreciate Drs. Steven Rosenberg and Francesco Marincola (NCI,
NIH) for providing TIL cells and PBMC from melanoma patients. Special
thanks go to Dr. Michael Vasconcelles at Genzyme Clinical Research for his
support in our validation studies. We also thank Mark Schwerzler for man-
uscript review.
References
1. Keilholz U, Weber J, Finke JH, Gabrilovich DI, Kast WM, Disis ML,
Kirkwood JM, Scheibenbogen C, Schlom J, Maino VC, et al.: Immu-
nologic monitoring of cancer vaccine therapy: results of a
workshop sponsored by the Society for Biological Therapy. J
Immunother 2002, 25:97-138.
2. Chang AE, Redman BG, Whitfield JR, Nickoloff BJ, Braun TM, Lee PP,
Geiger JD, Mule JJ: A phase I trial of tumor lysate-pulsed den-
dritic cells in the treatment of advanced cancer. Clin Cancer
Res 2002, 8:1021-1032.
3. Janetzki S, Cox JH, Oden N, Ferrari G: Standardization and vali-
dation issues of the ELISPOT assay. Methods Mol Biol 2005,
302:51-86.
4. Kammula US, Marincola FM, Rosenberg SA: Real-time quantita-
tive polymerase chain reaction assessment of immune reac-
tivity in melanoma patients after tumor peptide vaccination.
J Natl Cancer Inst 2000, 92:1336-1344.
5. Kaufman HL, Deraffele G, Mitcham J, Moroziewicz D, Cohen SM,
Hurst-Wicker KS, Cheung K, Lee DS, Divito J, Voulo M, et al.: Tar-
geting the local tumor microenvironment with vaccinia virus
expressing B7.1 for the treatment of melanoma. J Clin Invest
2005, 115:1903-1912.
6. Nielsen MB, Monsurro V, Migueles SA, Wang E, Perez-Diez A, Lee
KH, Kammula U, Rosenberg SA, Marincola FM: Status of activation
of circulating vaccine-elicited CD8+ T cells. J Immunol 2000,
165:2287-2296.
7. Pullarkat V, Lee PP, Scotland R, Rubio V, Groshen S, Gee C, Lau R,
Snively J, Sian S, Woulfe SL, et al.: A phase I trial of SD-9427 (pro-
genipoietin) with a multipeptide vaccine for resected meta-
static melanoma. Clin Cancer Res 2003, 9:1301-1312.
8. Sanderson K, Scotland R, Lee P, Liu D, Groshen S, Snively J, Sian S,
Nichol G, Davis T, Keler T, et al.: Autoimmunity in a phase I trial
of a fully human anti-cytotoxic T-lymphocyte antigen-4 mon-
oclonal antibody with multiple melanoma peptides and Mon-
tanide ISA 51 for patients with resected stages III and IV
melanoma. J Clin Oncol 2005, 23:
741-750.
9. Speiser DE, Pittet MJ, Guillaume P, Lubenow N, Hoffman E, Cerottini
JC, Romero P: Ex vivo analysis of human antigen-specific CD8+
T-cell responses: quality assessment of fluorescent HLA-A2
multimer and interferon-gamma ELISPOT assays for
patient immune monitoring. J Immunother (1997) 2004,
27:298-308.
10. Whiteside TL, Zhao Y, Tsukishiro T, Elder EM, Gooding W, Baar J:
Enzyme-linked immunospot, cytokine flow cytometry, and
tetramers in the detection of T-cell responses to a dendritic
cell-based multipeptide vaccine in patients with melanoma.
Clin Cancer Res 2003, 9:641-649.
11. Findlay JW, Smith WC, Lee JW, Nordblom GD, Das I, DeSilva BS,
Khan MN, Bowsher RR: Validation of immunoassays for bioa-
nalysis: a pharmaceutical industry perspective. J Pharm Biomed
Anal 2000, 21:1249-1273.
12. Janetzki S, Schaed S, Blachere NE, Ben-Porat L, Houghton AN, Pana-
geas KS: Evaluation of Elispot assays: influence of method and
operator on variability of results. J Immunol Methods 2004,
291:175-183.
13. Pittet MJ, Valmori D, Dunbar PR, Speiser DE, Lienard D, Lejeune F,
Fleischhauer K, Cerundolo V, Cerottini JC, Romero P: High fre-
quencies of naive Melan-A/MART-1-specific CD8(+) T cells in
Publish with BioMed Central and every
scientist can read your work free of charge
"BioMed Central will be the most significant development for
disseminating the results of biomedical research in our lifetime."
Sir Paul Nurse, Cancer Research UK
Your research papers will be:
available free of charge to the entire biomedical community
peer reviewed and published immediately upon acceptance
cited in PubMed and archived on PubMed Central
yours — you keep the copyright
Submit your manuscript here:
/>BioMedcentral
Journal of Translational Medicine 2008, 6:61 />Page 25 of 25
(page number not for citation purposes)
a large proportion of human histocompatibility leukocyte
antigen (HLA)-A2 individuals. J Exp Med 1999, 190:705-715.
14. Asai T, Storkus WJ, Whiteside TL: Evaluation of the modified
ELISPOT assay for gamma interferon production in cancer
patients receiving antitumor vaccines. Clin Diagn Lab Immunol
2000, 7:145-154.
15. Anichini A, Molla A, Mortarini R, Tragni G, Bersani I, Di Nicola M,
Gianni AM, Pilotti S, Dunbar R, Cerundolo V, Parmiani G: An
expanded peripheral T cell population to a cytotoxic T lym-
phocyte (CTL)-defined, melanocyte-specific antigen in met-
astatic melanoma patients impacts on generation of
peptide-specific CTLs but does not overcome tumor escape
from immune surveillance in metastatic lesions. J Exp Med
1999, 190:651-667.
16. Dunbar PR, Smith CL, Chao D, Salio M, Shepherd D, Mirza F, Lipp M,
Lanzavecchia A, Sallusto F, Evans A, et al.: A shift in the phenotype
of melan-A-specific CTL identifies melanoma patients with
an active tumor-specific immune response. J Immunol 2000,
165:6644-6652.
17. Jager E, Hohn H, Necker A, Forster R, Karbach J, Freitag K, Neukirch
C, Castelli C, Salter RD, Knuth A, Maeurer MJ: Peptide-specific
CD8+ T-cell evolution in vivo: response to peptide vaccina-
tion with Melan-A/MART-1. Int J Cancer 2002, 98:376-388.
18. Griffioen M, Borghi M, Schrier PI, Osanto S, Schadendorf D: Analysis
of T-cell responses in metastatic melanoma patients vacci-
nated with dendritic cells pulsed with tumor lysates. Cancer
Immunol Immunother 2004, 53:715-722.
19. Lee KH, Wang E, Nielsen MB, Wunderlich J, Migueles S, Connors M,
Steinberg SM, Rosenberg SA, Marincola FM: Increased vaccine-
specific T cell frequency after peptide-based vaccination cor-
relates with increased susceptibility to in vitro stimulation
but does not lead to tumor regression. J Immunol 1999,
163:6292-6300.
20. Nielsen MB, Marincola FM: Melanoma vaccines: the paradox of
T cell activation without clinical response. Cancer Chemother
Pharmacol 2000, 46(Suppl):S62-66.
21. Oelke M, Kurokawa T, Hentrich I, Behringer D, Cerundolo V, Linde-
mann A, Mackensen A: Functional characterization of CD8(+)
antigen-specific cytotoxic T lymphocytes after enrichment
based on cytokine secretion: comparison with the MHC-
tetramer technology. Scand J Immunol 2000, 52:544-549.
22. Yee C, Savage PA, Lee PP, Davis MM, Greenberg PD: Isolation of
high avidity melanoma-reactive CTL from heterogeneous
populations using peptide-MHC tetramers. J Immunol 1999,
162:2227-2234.