báo cáo hóa học: " Measuring the ICF components of impairment, activity limitation and participation restriction: an item analysis using classical test theory and item response theory" potx
Bạn đang xem bản rút gọn của tài liệu. Xem và tải ngay bản đầy đủ của tài liệu tại đây (1.27 MB, 20 trang )
BioMed Central
Page 1 of 20
(page number not for citation purposes)
Health and Quality of Life Outcomes
Open Access
Research
Measuring the ICF components of impairment, activity limitation
and participation restriction: an item analysis using classical test
theory and item response theory
Beth Pollard*
1
, Diane Dixon
2
, Paul Dieppe
3
and Marie Johnston
1
Address:
1
School of Psychology, University of Aberdeen, Aberdeen, AB24 2UB, UK,
2
Department of Psychology, University of Stirling, Stirling, FK9
4LA, UK and
3
Peninsula College of Medicine and Dentistry, University of Plymouth, Plymouth, PL4 8AA, UK
Email: Beth Pollard* - ; Diane Dixon - ; Paul Dieppe - ;
Marie Johnston -
* Corresponding author
Abstract
Background: The International Classification of Functioning, Disability and Health (ICF) proposes
three main health outcomes, Impairment (I), Activity Limitation (A) and Participation Restriction
(P), but good measures of these constructs are needed The aim of this study was to use both
Classical Test Theory (CTT) and Item Response Theory (IRT) methods to carry out an item
analysis to improve measurement of these three components in patients having joint replacement
surgery mainly for osteoarthritis (OA).
Methods: A geographical cohort of patients about to undergo lower limb joint replacement was
invited to participate. Five hundred and twenty four patients completed ICF items that had been
previously identified as measuring only a single ICF construct in patients with osteoarthritis. There
were 13 I, 26 A and 20 P items. The SF-36 was used to explore the construct validity of the
resultant I, A and P measures. The CTT and IRT analyses were run separately to identify items for
inclusion or exclusion in the measurement of each construct. The results from both analyses were
compared and contrasted.
Results: Overall, the item analysis resulted in the removal of 4 I items, 9 A items and 11 P items.
CTT and IRT identified the same 14 items for removal, with CTT additionally excluding 3 items,
and IRT a further 7 items. In a preliminary exploration of reliability and validity, the new measures
appeared acceptable.
Conclusion: New measures were developed that reflect the ICF components of Impairment,
Activity Limitation and Participation Restriction for patients with advanced arthritis. The resulting
Aberdeen IAP measures (Ab-IAP) comprising I (Ab-I, 9 items), A (Ab-A, 17 items), and P (Ab-P, 9
items) met the criteria of conventional psychometric (CTT) analyses and the additional criteria
(information and discrimination) of IRT. The use of both methods was more informative than the
use of only one of these methods. Thus combining CTT and IRT appears to be a valuable tool in
the development of measures.
Published: 7 May 2009
Health and Quality of Life Outcomes 2009, 7:41 doi:10.1186/1477-7525-7-41
Received: 10 November 2008
Accepted: 7 May 2009
This article is available from: />© 2009 Pollard et al; licensee BioMed Central Ltd.
This is an Open Access article distributed under the terms of the Creative Commons Attribution License ( />),
which permits unrestricted use, distribution, and reproduction in any medium, provided the original work is properly cited.
Health and Quality of Life Outcomes 2009, 7:41 />Page 2 of 20
(page number not for citation purposes)
Aim
The aim of this paper was to develop measures that reflect
the health components identified by the International
Classification of Functioning, Disability and Health (ICF)
for use with people having joint replacement surgery.
Item analysis was carried out using both Classical Test
Theory (CTT) and Item Response Theory (IRT) on a group
of candidate Impairment (I), Activity Limitation (A) and
Participation Restriction (P) items. The items had been
previously judged to be measuring one, and only one, of
the three ICF components [1].
Background
The dominant theoretical models of health outcomes or
the consequence of disease have been the models devel-
oped by the World Health Organisation [2,3]. The most
recent version, the International Classification of Func-
tioning, Disability and Health (ICF [2]) is based on a
biopsychosocial model that integrates medical and social
models (Figure 1). The ICF model identifies three main
distinct constructs (components), Impairment (I), Activ-
ity Limitation (A) and Participation Restriction (P) and
their respective opposites, Body Function and Structure,
Activity and Participation [2].
In developing measures of these constructs, it is important
to ensure that the measures assess only the construct of
interest and are not simultaneously measuring other con-
structs within the model or outwith the model. If meas-
ures are not 'pure' (i.e. only measuring the construct of
interest), empirical evidence for relationships between
constructs in the model may be misleading. Thus, it is
possible, that significant correlations between constructs,
and support for models may be due not to true relation-
ships and the validity of the model, but to the overlap of
constructs within the measures. It is also possible that a
lack of relationship between constructs may also be due to
contaminated measures. Hence, only if we can establish
distinct measures of the main ICF constructs can we
explore the relationships between these constructs and
attempt to progress to a truly testable theoretical model.
Contaminated measures may also mask positive or nega-
tive effects of interventions.
With the wide acceptance of the ICF framework, attempts
have been made to link existing measures to ICF con-
structs and categories [1,4-7]. These studies have shown
that the selected existing measures do not map onto single
ICF constructs. Hence, there is a need for pure measures of
the ICF constructs. Very few measures have been devel-
oped based on the ICF constructs for use with people hav-
ing joint replacement although a measure for people with
knee OA has been developed but specifically to reflect Jap-
anese culture [8]. Additionally, a measure of participation
restriction for use in population studies has been devel-
oped based on the ICF [9] and recently a measure of par-
ticipation has been developed for OA but it was not based
on the ICF [10].
We have previously shown that existing measures used to
assess health status in people with osteoarthritis (OA)
cannot be used to uniquely measure the ICF constructs of
Impairment (I), Activity Limitation (A) and Participation
Restriction (P) [1]. However, application of the method of
The ICF modelFigure 1
The ICF model.
Health Condition
(disorder or disease)
Participation
/Participation
R
est
ri
ct
i
on
Contextual Factor s
Environment /Personal
Body Function &
Structure/ Impairment
Activity/Activity
Limitation
Health and Quality of Life Outcomes 2009, 7:41 />Page 3 of 20
(page number not for citation purposes)
Discriminant Content Validation [1,11] by expert judges
identified a pool of pure I, A and P items within existing
measures (i.e. items judged to be uncontaminated with
other constructs in the ICF model) [1]. This pool of items
may form the basis of new pure measures of I, A and P but
further work needs to be done to select items from the
pool for each measure to lessen the burden to patients and
to eliminate redundant or misfitting items.
In an item analysis, the candidate items are completed by
participants from the target population and analysed sta-
tistically. This analysis can suggest items that may not be
appropriate for the measure that is required, and so may
be removed from the item pool.
The Classical Test Theory (CTT) approach to item analysis
is based on correlational data and the procedures usually
involve maximising Cronbach's alpha [12] and selecting
items with high factor loadings using exploratory factor
analysis [13]. However, these methods have known limi-
tations such as resulting in measures only tapping a small
part of the underlying construct [14-16]. Additionally,
and importantly, CTT methods are dependent on the sam-
ple and the set of items that the participants respond to
The newer methods of Item Response Theory (IRT) can
provide additional information to CTT methods [17] and
allow for the examination of individual items in more
detail than CTT. The method has three big advantages,
firstly, that within sampling error, the item parameters are
not dependent on the ability levels of the sample i.e. they
are sample invariant. Secondly, the score achieved by an
individual is independent of the particular sample of
items that the individual responds to [18]. Third, IRT gives
indices of the informatic contribution of items, allowing
the removal of redundant or non-discriminating items.
IRT models are probabilistic and model respondents'
response to an item, to a position on an underlying unidi-
mensional hypothesised construct. Using IRT, estimates
can be provided of both the items' discriminating ability
and difficulty.
IRT also provides information functions, these indicate
where an item is most useful on the underlying construct.
The shape of an item information function is a combina-
tion of the item's discriminating ability and its difficulty.
The item information function allows for the reliability of
a measure to be explored throughout the entire underly-
ing construct. In contrast, CTT only gives a single overall
reliability estimate (Cronbach's alpha). Low information
functions may indicate that an item may not be appropri-
ate. This may be due to either the item not measuring the
same thing as other items in the scale or the item being
too difficult, poorly worded or out of context within the
questionnaire [19].
The individual item information functions can be
summed to form the test information function. This can
indicate if there are areas on the underlying construct not
covered by the selected items. If this is found, then new
items may be written to cover these areas where the meas-
ure has low reliability.
Typically, item analysis has been carried out using CTT or
IRT. CTT has been the standard method of item analysis
and has been a valuable tool over many years [20]. How-
ever, CTT depends on the nature and size of the sample
and the nature and number of items as well as having
other limitations.
IRT can overcome many of the problems of CTT but is
more difficult to perform and understand [20] and has
less established guidelines. Hence, it has been suggested
that the use of both methods may be more informative
than only using a single method [19,20].
In this study, CTT and IRT methods were used independ-
ently to identify items that may be removed from the item
pool. The item analysis was carried out for I, A and P sep-
arately; resulting in the exclusion of items from the pool.
The relevant information from both methods was then
combined and discrepancies examined.
Method
Design
A geographical cohort of participants from the Tayside
Joint Replacement (TJR) cohort about to undergo hip or
knee joint replacement surgery at Ninewells Hospital,
Dundee were invited to complete assessments including
pure I, A and P items. Data were analysed using CTT and
IRT methods to identify appropriate items for I, A and P
measures.
Procedure
Ethics approval was obtained from the Tayside Commit-
tee on Medical Research Ethics. A questionnaire pack was
sent to each participant's home approximately four weeks
prior to surgery by the pre-operative assessment nurse at
the hospital. The questionnaire pack consisted of an invi-
tation to participate, patient information sheet, consent
form, questionnaire and stamped return envelope. The
participants completed the questionnaire at home and
returned it by post to the research team.
Participants
The questionnaire was sent to 1145 patients having their
first hip or knee replacement on that particular joint and
completed by 524 patients (43% response rate). Seven-
teen patients were excluded from the analysis as they com-
pleted the questionnaire on or after their scheduled
operation date and 25 patients were excluded as they had
an unknown operation date or did not record the date on
Health and Quality of Life Outcomes 2009, 7:41 />Page 4 of 20
(page number not for citation purposes)
which they completed the questionnaire. This resulted in
a sample of 482 patients (who completed the question-
naire, on average, 34 days before surgery). The sample
comprised 53% women and 55% were having hip
replacements. The patients' mean age was 68.78 (s.d. =
9.9).
There were 25 patients whose diagnosis was not recorded.
Of the remaining 457 patients, 93.4% had a diagnosis of
osteoarthritis.
There was no difference in mean age or proportion of men
to women between the responders and non-responders
(i.e. those who did or did not agree to take part in the
study and return the postal questionnaire). There was also
no difference between responders and non-responders in
terms of disease severity as measured by either the Ameri-
can Knee Score [21] (function and score) or on the Harris
Hip score [22] which were the routine measures being
used to assess all patients health status prior to surgery
Measures
Pure measures
A pool of pure items was previously identified using Dis-
criminant Content Validation by expert judges from 13
existing OA health outcome measures [1]. The items orig-
inated from the American Knee Score, Arthritis Impact
Measurement Scale (AIMS, [23]), Disease Repercussion
Profile (DRP, [24]), EuroQol [25], Functional Limitation
Profile (FLP, [26]), Harris Hip score [22], Health Assess-
ment Questionnaire (HAQ [27]), Lequesne Hip and Knee
Indices [28], London Handicap Scale (LHS [29]), Oxford
Hip and Knee Questionnaires (OXFORD [30,31]), RAND
36 item Short Form Health Survey (SF-36 [32]), Western
Ontario and MacMaster Universities Osteoarthritis Index
(WOMAC [33]), World Health Organisation Quality of
life Assessment-Brief (WHOQOL [34]).
The pool of pure items comprised 74 I, 88 A and 44 P
items. An initial procedure was necessary to eliminate
items with overlapping content and reduce patient bur-
den. This procedure resulted in 13 I, 26 A and 20 P candi-
date items (for details of this procedure and format of
items see Additional file 1: initial item pool reduction).
For all items a high score implies high limitation. Each
item and its origin are in Tables 1, 2 and 3.
Criterion measure for validation of new measures
The SF-36 subscales of pain (SF_pain), physical function
(SF_phys) and social participation (SF_soc) were used as
Table 1: I_ctt items ordered by difficulty
Item Origin Mean s.d.
I1. Does remaining standing for 30 minutes increase your pain? LEQUESNE 4.21 0.98
I2. What degree of difficulty do you have bending and rotating your affected joint? HARRIS 3.87 0.90
I3. How would you describe the pain you usually have from your joint? AIMS 3.86 0.66
I4. How often have you had severe pain from your arthritis? AIMS 3.74 0.90
I5. How active has your arthritis been? AIMS 3.74 0.83
I6. Have you been troubled by pain from your joint in bed at night? OXFORD 3.68 1.21
I7. How severe is your stiffness after first wakening in the morning? WOMAC 3.39 0.88
I8. How severe is your stiffness after sitting, lying or resting later in the day? WOMAC 3.26 0.80
I9. How long has your morning stiffness usually lasted from the time you wake up? AIMS 3.22 1.07
I10. Has pain from your joint kept you awake during your night-time sleep? STEERING GROUP 3.19 1.22
I11. Have you felt that your knee or hip might suddenly 'give way' or let you down? OXFORD 2.99 1.02
I12. How often have you had pain in two or more joints at the same time? AIMS 2.92 1.15
113. Have you had any sudden, severe pain – 'shooting', 'stabbing' or 'spasms' – from the affected joint? OXFORD 2.90 0.88
Items in bold removed by CTT/IRT item analysis
Health and Quality of Life Outcomes 2009, 7:41 />Page 5 of 20
(page number not for citation purposes)
Table 2: A_ctt items ordered by difficulty
Item Origin Mean s.d.
A1. What degree of difficulty do you have climbing up and down several flights of stairs? ^ 4.22 0.84
A2*. Does your health now limit you in these activities? Walking 100 yards SF-36 4.09 0.85
A3. What degree of difficulty do you have walking long distances on the flat (greater than 1/2 mile)? SF-36 4.06 0.89
A4. What degree of difficulty do you have bending to floor? WOMAC 3.63 1.02
A5. What degree of difficulty do you have climbing up and down one flight of stairs? ^ 3.57 0.97
A6. What degree of difficulty do you have putting on socks/stockings? WOMAC 3.47 1.14
A7. What degree of difficulty do you have ascending stairs? WOMAC 3.36 0.91
A8. What degree of difficulty do you have rising from sitting? WOMAC 3.32 0.84
A9. What degree of difficulty do you have descending stairs? WOMAC 3.31 0.95
A10. What degree of difficulty do you have lifting? AIMS 3.28 1.04
A11. What degree of difficulty do you have standing? WOMAC 3.27 0.93
A12. What degree of difficulty do you have walking on the flat? WOMAC 3.26 0.82
A13. What degree of difficulty do you have taking off socks/stockings? WOMAC 3.24 1.13
A14. Do you use a walking stick? FLP 3.21 1.69
A15. What degree of difficulty do you have rising from bed? WOMAC 3.04 0.96
A16. What degree of difficulty do you have putting on/off shoes? WOMAC 2.87 1.20
A17*. Does your health now limit you in these activities? Bending, kneeling or stooping SF-36 2.85 1.25
A18. What degree of difficulty do you have getting on/off toilet? WOMAC 2.72 0.99
A19. What degree of difficulty do you have lying in bed? WOMAC 2.65 1.03
A20. What degree of difficulty do you have sitting? WOMAC 2.56 0.93
A21. What degree of difficulty do you have dressing yourself (except shoes and socks)? HAQ 2.15 0.98
A22. What degree of difficulty do you have washing and drying yourself? SIP 2.13 1.01
A23. What degree of difficulty do you have washing your hair? HAQ 1.91 1.06
A24. Do you need someone to help you go upstairs? SIP 1.80 1.15
A25. Do you need someone to help you when you are walking? SIP 1.78 1.01
A26. Do you need someone to help you go downstairs? SIP 1.78 1.17
Items in bold removed by CTT/IRT item analysis
*These items had three categories and were rescaled to a five point scale.
^ Stair items: There was almost every combination of stair use represented in the original item pool. For parsimony not all combinations could be
added at this stage, these two were added to complement and constrast with the stair items already in.
Health and Quality of Life Outcomes 2009, 7:41 />Page 6 of 20
(page number not for citation purposes)
criterion variables for I, A & P respectively [1]. For all items
a high score implies low limitation.
Analysis
Initially, for both CTT and IRT, the frequency distribution
of each I, A & P item was explored. Items with > = 10%
missing data were excluded [35]. As the results from the
CTT and IRT were to be compared, it was necessary to
ensure that such analyses were based on the same data so
subjects with missing data on either analysis were
excluded.
CTT approach
The following six aspects of CTT were explored: a) Item
difficulty was reported from the mean and standard devi-
ation. An item with a large mean would indicate the sam-
ple is more limited on that item than on an item with a
lower mean; b) An assumption for correlational methods
is that the items have local independence i.e. there is no
relationship between items controlling for the respond-
ents position on the underlying construct. However, when
the item pool was developed some items with overlap-
ping content were retained in the initial item pool as there
Table 3: P_ctt items ordered by difficulty
Item Origin Mean s.d.
P1. How does your joint problem restrict your opportunities for leisure activities? WHOQOL 3.82 0.94
P2. How does your joint problem restrict you doing your hobbies? FLP 3.41 1.19
P3. How does your joint problem restrict you doing your usual social activities? FLP 3.23 1.09
P4. How does your joint problem restrict you visiting friends or relatives? AIMS 2.60 1.26
P5. How much of the time has your physical health or emotional problems interfered with your social activities (like
visiting with friends)?
SF-36 2.54 1.30
P6. How much do you enjoy life? WHOQOL 2.36 0.76
P7. How healthy is your physical environment? WHOQOL 2.28 0.86
P8. How available to you is the information that you need in your day-to-day life? WHOQOL 2.06 0.85
P9. How satisfied are you with your personal relationship? WHOQOL 2.06 0.99
P10. How does your joint problem restrict you having friends or relatives over to your home? AIMS 1.95 1.07
P11. How satisfied are you with your transport? WHOQOL 1.93 0.80
P12. How does your joint problem restrict you getting on with people (friends and family)? LHS 1.89 1.02
P13. How satisfied are you with your access to health services? WHOQOL 1.86 0.75
P14. How satisfied are you with the support you get from your friends? WHOQOL 1.79 0.74
P15. How does your joint problem restrict how much money you have? DRP 1.72 1.22
P16. How does your joint problem restrict you affording things you need? LHS 1.66 1.09
P17. How does your joint problem restrict you showing affection? FLP 1.58 0.96
P18. How satisfied are you with the conditions of your living place? WHOQOL 1.58 0.72
P19. How does your joint problem restrict you telephoning friends or relatives? AIMS 1.26 0.62
*How does your joint problem restrict your capacity for work?' WHOQOL n/a n/a
Items in bold removed by item analysis
*Item removed as greater than 10% missing data (no further analysis carried out)
Health and Quality of Life Outcomes 2009, 7:41 />Page 7 of 20
(page number not for citation purposes)
was no criteria on which to judge which items to retain or
delete. These items would violate the assumption of local
independence and so were grouped into independent sets
(e.g. the four stair items were grouped into two independ-
ent sets of two items). The analyses were run separately
using one of the sets and then repeated with the other set
so as not to violate the assumptions. The results for each
item set were compared to decide which items to retain; c)
Pairs of redundant items were identified if they had very
high correlations >0.87 (i.e.75% shared variance). The
item, from the pair, that caused the greatest reduction in
alpha if the item was deleted was retained; d) Internal reli-
ability was examined using Cronbach's alpha. Items were
deleted that would cause an increase in alpha if they were
removed. The analysis was repeatedly rerun until no items
were deleted; e) Item to Total Correlations (ITC) were cal-
culated by removing the item from the hypothesised con-
struct total and then correlating the item with that total
(without the item). Items that had a low item to total cor-
relation of <0.4 were deleted [34,36]; f) Multi-trait analy-
sis (MAP) [37] was carried out to identify items that
correlated higher with other I, A, P total(s) than with the
total of the hypothesised construct minus the item with
such items being deleted. The totals for each construct
were based on the items that resulted from the earlier
analysis. These totals were referred to as I_map, A_map
and P_map.
Once all these steps had been completed for each con-
struct, internal reliability, ITC and MAP analyses were
rerun on the resultant sets of items
Item Response Theory approach
IRT model
For each construct Samejima's graded response model
(GRM) [38] was fitted using MULTILOG [39]. The GRM is
suitable for ordered polytomous responses and can deal
with items that have a different number of response cate-
gories. The probability of a response to an item for a sub-
ject that has a trait level theta (θ) is both a function of the
slope i.e. the discrimination (a) and the location parame-
ters (b) that indicate the items difficulty. In a polytomous
model there is more than one location parameter. The
number of location parameters is the number of response
categories minus one. These location parameters are
thresholds that reflect the location where a participant is
50% likely to respond above the category threshold. Infor-
mation functions were calculated for the total test (meas-
ure) and for each item at various levels of the underlying
construct as suggested by Cooke et al. (1999) [40]. The
item characteristic curves (ICC's) and information curves
for each item were also explored (but are not reported).
Model fit
Model and item fit was evaluated by comparing the
observed proportion of responses for each category, with
the model predicted values obtained from the item
parameters and the estimated latent trait distributions.
The difference between these observed and expected val-
ues indicate how well the model predicts the actual item
responses. It has been suggested that a difference between
these values of less than 0.01 indicates very good fit [17].
Model assumptions
An assumption of IRT is that the items are measuring a
unidimensional underlying construct. The factor structure
for each construct was explored using exploratory factor
analysis. Common criteria for acceptable unidimension-
ality are if > = 20% variance is explained in the first factor
[41] or if the ratio of the first to second eigenvalue is 3:1
or 4:1(e.g. [40,42]). Both of these criteria were used and
varimax rotation and principal axis factoring were carried
out.
IRT models assume that there is local independence. It
was known that some items in the item pool were not
locally independent. So as not to violate the assumption,
two models were fitted for each set of dependent items.
The total information function, item information func-
tion and model parameters were compared to inform
choice of which of the dependent items (or sets of items)
to retain.
Item information and discrimination
Items were removed with low discrimination and low
item information as they are probably not well related to
the underlying construct [43]. There does not appear to be
an agreed value for an acceptable discrimination. How-
ever, values have been suggested greater than one [14] to
two [44]. Here, items were removed if they had a discrim-
ination parameter of less than 1.25. This value was chosen
so that items were not removed too early in the develop-
ment process.
Combine CTT and IRT item information
The items that were removed as the result of CTT and IRT
methods were compared and contrasted. Where both
methods agreed the item was removed. If only one
method suggested item removal then each item was
reviewed individually. An initial exploration of properties
of the resultant measures was carried out.
To examine the validity of the new measures, the correla-
tion with subscales of the criterion variable (SF-36)
should be as hypothesised i.e. SF-36 subscales pain, phys-
ical function and social participation should correlate
more strongly with I, A & P respectively, than with the
other SF-36 subscale totals. Cronbach's alpha should be at
an acceptable level (i.e. >0.8) and IRT should indicate that
the measure is reliable across the underlying construct.
Reliability across the construct can be expressed in terms
of the information function such that: Reliability = (1-[1/
Health and Quality of Life Outcomes 2009, 7:41 />Page 8 of 20
(page number not for citation purposes)
information]) with the standard error of measurement
(SEM) = 1/[sqrt (information)]. Therefore, acceptable reli-
ability (>0.8) is where the information is >5. The distribu-
tion of each measure should be approximately normal, to
enable standard parametric statistical testing where the
distribution is assumed to be normal. Skewness and kur-
tosis were examined using a conservative alpha level of
0.001 (z = +/- 3.29) as with large samples it is easy to
achieve a significant skewness and kurtosis even with only
small deviations from normality [35]. However, the main
method of examining the distributions of the measures
was through graphical examination as this is the most
appropriate method for large samples [35].
Results
For I and A there were no items with greater than 10%
missing data. However, one P item 'How does your joint
problem restrict your capacity for work?', had 10% missing
data and was dropped from the item pool.
Exploratory factor analyses were run for each set of items
(I, A and P) to explore unidimensionality. Separate analy-
ses were run with each dependent variable set, so as not to
violate the assumption of local independence. All three
sets of items had the ratio of their first to second eigen-
value >3. The ratio was highest for Impairment (6.7), then
Activity Limitation (5.46 to 5.99) and then Participation
Restriction (3.63 to 3.69). All three pools of items also
had the first factor explaining >20% variance with Activity
Limitation having the largest variance explained by the 1
st
factor (>43%). There appeared to be acceptable evidence
of a dominant first factor and, therefore, sufficient evi-
dence of unidimensionality.
For ease of reading, the set of items entered into the first
CTT analyses are referred to as I_ctt, A_ctt and P_ctt. The
set of items entered into the first IRT analysis are referred
to as I_irt, A_irt, P_irt. The resultant sets of uncontami-
nated items from the combination of both analyses are
referred to as the Aberdeen
IAP measures (Ab-IAP) comprising Ab-I, Ab-A and Ab-P.
The results for the CTT and IRT analysis are initially
reported by construct and then the reliability and validity
of final measures are explored together.
A) IMPAIRMENT
Classical test theory approach
The mean item difficulties ranged from 2.90 to 4.21 [pos-
sible range 1–5] (see Table 1).
Two items were not locally independent, Item I6 'Have you
been troubled by pain from your joint in bed at night?' and
Item I10 'Has pain from your joint kept you awake during your
night-time sleep?' as a positive answer to item I10 would
imply a positive answer to item I6. Therefore, two separate
analyses were run. Cronbach's alpha and ITC were higher
with I6 (alpha = 0.867, ITC = 0.57) compared to item I10
'Has pain from your joint kept you awake during your night-
time sleep?' (alpha = 0.865, ITC = 0.54) and so this latter
item was removed.
The MAP analysis indicated that the Impairment item I2
'What degree of difficulty do you have bending and rotating
your affected joint?'was more highly correlated with the
A_map total (r = 0.65 p < 0.005) than with the I_map total
without I2 (r = 0.53 p < 0.0005). The Impairment item I8
'How severe is your stiffness after sitting, lying or resting later
in the day' was also more highly correlated with the A_map
total = 0.55 p < 0.005) than with the I_map total without
I8 (r = 0.54 p < 0.0005). Therefore items I2 and I8 were
removed.
There were no redundant items, no items that increased
Cronbach's alpha if the item was deleted and no ITC's <
0.4. There were no additional changes when all analyses
were rerun with the resultant set of 10 Impairment items
(Cronbach's alpha = 0.848).
Item response theory approach
Due to possible violations of the assumption of local
independence, the items I6 'Have you been troubled by pain
from your joint in bed at night?' and I10 'Has pain from your
joint kept you awake during your night-time sleep?' were
explored in separate analyses. The model with item I6,
resulted in higher discriminating parameter, information
and overall total information than the model with item
I10. Therefore, the model with item I6 was retained and is
now explored.
The I_irt items showed generally good discrimination (a >
1.25) except for one item I12 'How often have you had pain
in two or more joints at the same time?' (a = 1.09). This item
also had low information across the construct and was
removed from the item pool. The information functions
across the construct showed that the items were informa-
tive across the construct except at the highest end of the
construct i.e. those with very high impairment. The item
with the highest information and discrimination was I5
'How active has your arthritis been?' (see Table 4).
Thirteen items had all the differences between observed
and expected response categories < 0.01, with only one
item (I1) having one of the five response differences >
0.01 but less than 0.02. This analysis indicated very good
fit.
Combining the IRT & CTT analyses
When the two dependent items were explored (I6, I10),
both CTT and IRT suggested that the item I10 'Has pain
Health and Quality of Life Outcomes 2009, 7:41 />Page 9 of 20
(page number not for citation purposes)
from your joint kept you awake during your night-time sleep?'
be removed from the item pool. Hence, this item was
removed from the combined item pool.
Two items were removed by the CTT MAP analysis. One of
the items, I2 'What degree of difficulty do you have bending
and rotating your affected joint?', was written as an attempt
to convert a clinician measure of the degrees of of motion
in the joint to a self-report item. The participants'
responses indicate that it reflects Activity Limitation rather
than Impairment.
The MAP analysis also suggested removal of item I8 'How
severe is your stiffness after sitting, lying or resting later in the
day?' This item was also be seen to be tapping Activity
Limitation. Hence, it seemed appropriate to remove these
two items from the combined item pool.
The final item identified for removal was I12 'How often
have you had pain in two or more joints at the same time?' This
was identified by IRT as having very low information and
low discrimination. This item also had the lowest ITC
from the CTT analysis and was removed from the com-
Table 4: I_irt item parameters
IRT item parameters
Discrim Difficulty: location parameters
I_irt item ab1
(se)
b2
(se)
b3
(se)
b4
(se)
I1. Does remaining standing for 30 minutes increase your pain? 1.38 -4.25
(0.73)
-2.39
(0.29)
-1.22
(0.16)
-0.07
(0.11)
I2. What degree of difficulty do you have bending and rotating your affected joint? 1.46 -3.55
(0.47)
-2.31
(0.25)
-0.68
(0.12)
1.08
(0.14)
I3. How would you describe the pain you usually have from your joint? 2.33 -5.34
(-)
-2.47
(0.35)
-0.81
(0.09)
1.56
(0.13)
I4. How often have you had severe pain from your arthritis? 2.15 -2.82
(0.30)
-1.67
(0.15)
-0.56
(0.09)
1.21
(0.11)
I5. How active has your arthritis been? 2.50 -2.81
(0.31)
-1.94
(0.17)
-0.50
(0.08)
1.25
(0.11)
I6. Have you been troubled by pain from your joint in bed at night? 1.52 -2.65
(0.30)
-1.22
(0.15)
-0.45
(0.11)
0.75
(0.12)
I7. How severe is your stiffness after first wakening in the morning? 1.81 -2.88
(0.31)
-1.54
(0.15)
0.11
(0.09)
2.02
(0.19)
I8. How severe is your stiffness after sitting, lying or resting later in the day? 1.51 -3.62
(0.52)
-1.64
(0.19)
0.54
(0.11)
2.54
(0.27)
I9. How long has your morning stiffness usually lasted from the time you wake up? 1.34 -3.38
(0.43)
-1.05
(0.16)
0.65
(0.12)
1.57
(0.19)
I11. Have you felt that your knee or hip might suddenly 'give way' or let you down? 1.32 -2.62
(0.32)
-0.79
(0.14)
0.97
(0.14)
2.24
(0.25)
I12. How often have you had pain in two or more joints at the same time? 1.09 -2.43
(0.32)
-0.63
(0.15)
0.76
(0.15)
2.52
(0.31)
I13. Have you had any sudden, severe pain – 'shooting', 'stabbing' or 'spasms' – from the affected
joint?
1.33 -2.98
(0.38)
-0.83
(0.14)
1.34
(0.17)
2.72
(0.31)
TOTAL
Key: Items in bold = items with low discrimination parameter (< 1.25), (-) = not calculated
Health and Quality of Life Outcomes 2009, 7:41 />Page 10 of 20
(page number not for citation purposes)
bined item pool. Thus nine items were retained and four
items removed (see Table 1 where items in bold were
removed).
B) ACTIVITY LIMITATION
Classical test theory approach
The mean item difficulties ranged from 1.78 to 4.22 (see
Table 2).
There were two sets of items that may violate the assump-
tion of local independence, 4 items concerning stairs and
3 items about walking. The four stair items were split into
2 independent sets: set (1) A7 'What degree of difficulty do
you have ascending stairs?' and A9 'What degree of difficulty
do you have descending stairs?' and set (2) A1 'What degree
of difficulty do you have climbing up and down several flights
of stairs?' and A5 'What degree of difficulty do you have climb-
ing up and down one flight of stairs?' The three walking
items were split into 2 independent groups set (3) A12
'What degree of difficulty do you have walking on the flat?' and
set (4) A2 'Does your health now limit you in these activities?
Walking 100 yards?' and A3 'What degree of difficulty do you
have walking long distances on the flat (greater than 1/2
mile)?' Sets (2) and (3) led to higher Cronbach's alphas
and ITC's and hence these sets were retained (see Addi-
tional file 2 for details).
The correlations between all the remaining items were
examined for redundant items. Items with very high cor-
relations (r = 0.881) were A6 'What degree of difficulty do
you have putting on socks/stockings?' (Cronbach's alpha if
item deleted = 0.937, ITC = 0.699) and A13 'What degree
of difficulty do you have taking off socks/stockings?' (Cron-
bach's alpha if item deleted = 0.937, ITC = 0.704). The
reliability statistics were very similar but A13 'What degree
of difficulty do you have taking off socks/stockings?' performed
slightly better so this was retained and item A6 was
removed. Another high correlation (r = 0.995) was found
between A24 'Do you need someone to help you go upstairs?'
(Cronbach's alpha if item deleted = 0.939, ITC = 0.606)
and A26 'Do you need someone to help you go downstairs?'
(Cronbach's alpha if item deleted = 0.939, ITC = 0.591).
Hence, item A26 was deleted.
There was an increase in Cronbach's alpha if two items
were deleted and, hence, they were removed. These items
were A14 'Do you use a walking stick?' and A17 'Does your
health now limit you in these activities? Bending, kneeling or
stooping'.
The MAP analysis indicated that one item, A11 'What
degree of difficulty do you have standing?', was more corre-
lated with the I_map total (r = 0.598) than with the
A_map total without A11 (r = 0.586) and was removed.
No remaining items had ITC < 0.4. There were no addi-
tional changes when all analyses were rerun with the
resultant set of 17 Activity Limitation items (Cronbach's
alpha = 0.939).
Item response theory approach
As in the CTT analysis, due to the assumption of local
independence the sets of stair and walking items were
analysed separately. Models with stair set (2) and walking
set (3) resulted in higher discriminating parameter, infor-
mation and overall total information compared to the
models with the other sets of items (see Additional file 2
for details). Hence the model with A1, A5 and A12 and
the 19 other items is now reported.
Twenty of the items had good discrimination (a > 1.25).
However, 2 items (A14, A17) had low discrimination (a <
1.25) and low information across the construct. These
items concerned using a walking stick and an item about
bending, kneeling and stooping. These items were
removed from the item pool.
The total and individual item information functions
showed good information across the construct except at
the lowest end of the construct i.e. those with very low
activity limitation. The most discriminating and informa-
tive item was A15 'What degree of difficulty do you have rising
from bed?' (see Table 5).
Seventeen of the items had all differences between
observed and expected response categories < .01 with only
five items (A6, A15, A13, A18, A23) having one of the five
responses > 0.01 but less than 0.02. This indicated overall
good fit for the 22 retained items
Combining the IRT & CTT analysis
There were two sets of dependent items involving walking
and stair use. Both methods suggested the removal of the
same item set and so they were removed from the com-
bined item pool.
Two items, A14 'Do you use a walking stick?' and A17 'Does
your health now limit you in these activities? Bending, kneeling
or stooping', were removed from the combined item pool
as they were identified by both methods. From CTT, this
was indicated by alpha increasing when the item was
deleted and the IRT indicated that both these items had
low discrimination and low information across the con-
struct (see Table 5). The latter of these items was asking
about more than one activity limitation i.e. bending,
kneeling and stooping and items that ask more than one
question at the same time should be avoided as each lim-
itation may be answered differently.
Health and Quality of Life Outcomes 2009, 7:41 />Page 11 of 20
(page number not for citation purposes)
Table 5: A_irt item parameters
Item parameters
A_irt item Discrim Difficulty: location parameters
ab1
(se)
b2
(se)
b3
(se)
b4
(se)
A1. What degree of difficulty do you have climbing up and down several flights of stairs? 1.72 -3.73
(0.59)
-2.62
(0.29)
-1.37
(0.14)
0.21
(0.10)
A4. What degree of difficulty do you have bending to floor? 1.91 -2.54
(0.25)
-1.58
(0.16)
-0.32
(0.09)
1.10
(0.12)
A5. What degree of difficulty do you have climbing up and down one flight of stairs?(*) 1.91 -2.76
(0.29)
-1.64
(0.15)
-0.07
(0.09)
1.13
(0.13)
A6. What degree of difficulty do you have putting on socks/stockings? 2.27 -1.87
(0.17)
-1.12
(0.11)
-0.03
(0.07)
0.96
(0.10)
A8. What degree of difficulty do you have rising from sitting? 2.07 -2.82
(0.34)
-1.41
(0.13)
0.34
(0.08)
1.82
(0.17)
A10. What degree of difficulty do you have lifting? 1.79 -2.17
(0.21)
-1.15
(0.12)
0.24
(0.09)
1.70
(0.17)
A11. What degree of difficulty do you have standing? 1.41 -2.90
(0.35)
-1.41
(0.17)
0.41
(0.12)
2.20
(0.26)
A12. What degree of difficulty do you have walking on the flat ? 1.47 -3.27
(0.41)
-1.57
(0.17)
0.52
(0.12)
2.42
(0.29)
A13. What degree of difficulty do you have taking off socks/stockings? 2.34 -1.79
(0.15)
-0.89
(0.10)
0.35
(0.07)
1.14
(0.11)
A14. Do you use a walking stick? 0.95 -1.21
(0.22)
-0.43
(0.17)
-0.20
(0.16)
0.63
(0.18)
A15. What degree of difficulty do you have rising from bed? 3.12 -1.68
(0.13)
-0.80
(0.08)
0.66
(0.07)
1.60
(0.11)
A16. What degree of difficulty do you have putting on/off shoes? 2.29 -1.29
(0.11)
-0.37
(0.09)
0.62
(0.08)
1.51
(0.12)
A17. Does your health now limit you in these activities? Bending, kneeling or stooping 1.02 -4.52
(1.24)
-1.76
(0.34)
A18. What degree of difficulty do you have getting on/off toilet? 2.80 -1.36
(0.11)
-0.35
(0.07)
0.95
(0.08)
1.97
(0.16)
A19. What degree of difficulty do you have lying in bed? 2.21 -1.24
(0.11)
-0.30
(0.08)
1.17
(0.11)
2.23
(0.21)
A20. What degree of difficulty do you have sitting? 2.76 -1.19
(0.10)
-0.26
(0.07)
1.29
(0.10)
2.63
(0.27)
A21. What degree of difficulty do you have dressing yourself (except shoes and socks)? 2.71 -0.51
(0.08)
0.27
(0.07)
1.78
(0.13)
2.38
(0.23)
A22. What degree of difficulty do you have washing and drying yourself? 2.53 -0.43
(0.08)
0.24
(0.07)
1.70
(0.14)
2.83
(0.35)
Health and Quality of Life Outcomes 2009, 7:41 />Page 12 of 20
(page number not for citation purposes)
One item was identified by CTT MAP for removal A11
'What degree of difficulty do you have standing?' While this
was not identified from the IRT, this item did have rela-
tively low discrimination (a = 1.41) and information. This
item was also different from almost all the other items as
the other items involved body movement whereas this
item did not. Considering all these findings, this item was
removed from the combined item pool.
Two pairs of items were identified as having very high cor-
relations (A6, A13 and A24, A26). The CTT indicated that
A6 and A26 should be removed. The item parameters of
the pairs of items were explored in the IRT analysis. This
analysis identified the same item from each pair as the
most appropriate for removal (see Table 5). The shape of
Item Characteristic Curve (ICC) for each pair was almost
identical with the item identified for removal having
slighly lower information across the construct. Therefore,
the identified items were removed from the combined
item pool. This resulted in 17 items being retained and 5
items being removed (see Table 2 where items in bold
were removed).
C) PARTICIPATION RESTRICTION
Classical test theory approach
The mean item difficulties ranged from 1.26 to 3.82 (see
Table 3).
There were two items with similar content and so may vio-
late the assumption of local independence (and very high
correlations (r = 0.885)). Item P15 'How does your joint
problem restrict how much money you have?' (Cronbach's
alpha = 0.874, ITC = 0.407) and P16 'How does your joint
problem restrict you affording things you need?' (Cronbach's
alpha = 0.877, ITC = 0.464). Hence, P15 was removed
from the item pool.
Three items were removed as they had ITC < 0.4. These
were P11 'How satisfied are you with your transport?' with
ITC = 0.39; P13 'How satisfied are you with your access to
health services?' with ITC = 0.30; P14 'How satisfied are you
with the support you get from your friends?' with ITC = 0.33.
No redundant items were identified and no items were
identified by the MAP analysis or from Cronbach's alpha.
There were also no additional changes when all analyses
were rerun with the resultant set of 15 Participation
Restriction items (Cronbach's alpha = 0.875).
Item Response Theory Approach
Due to the assumption of local independence separate
models were explored with Item P15 'How does your joint
problem restrict how much money you have?' and P16 'How
does your joint problem restrict you affording things you need?'
Item P16 had better discrimination and total information
than P15 and so the model with P16 is now reported.
Nine items (P2, P6, P7, P8, P9, P11, P13, P14, P18) had
low discrimination and information and were removed
from the item, pool. Six of these items originated from the
WHOQOL (WHOQOL group, 1998). The item with the
highest information and discrimination was P4 'How does
your joint problem restrict you visiting friends or relatives?' (see
Table 6).
Thirty two of the ninety (18 × 5) response categories had
a difference between observed and expected response cat-
egories > 0.01 with 11 of these having a difference > 0.02.
Therefore, the fit for Participation Restriction appears
poorer than that of Impairment or Activity Limitation.
Combining IRT & CTT analysis
CTT identified three items with low ITC's (P11, P13, P14).
These same three items were also identified as having low
discrimination and information by the IRT analysis.
CTT also identified two items that were dependent and
highly correlated (P15 and P16). The item P15 'How does
A23. What degree of difficulty do you have washing your hair? 2.05 0.01
(0.08)
0.60
(0.09)
1.86
(0.17)
2.78
(0.32)
A24. Do you need someone to help you go upstairs? 1.63 0.21
(0.10)
1.18
(0.14)
1.64
(0.17)
2.23
(0.24)
A25. Do you need someone to help you when you are walking? 1.33 0.01
(0.11)
1.56
(0.20)
2.20
(0.27)
3.27
(0.44)
A26. Do you need someone to help you go downstairs? 1.59 0.25
(0.10)
1.24
(0.14)
1.66
(0.18)
2.12
(0.23)
TOTAL
Key: Items in bold = items with low discrimination parameter (< 1.25).
Table 5: A_irt item parameters (Continued)
Health and Quality of Life Outcomes 2009, 7:41 />Page 13 of 20
(page number not for citation purposes)
your joint problem restrict how much money you have?' was
identified for removal by CTT. IRT also identified this item
as having low information and discriminatory ability
compared to the other item in this pair. Hence, the item
P15 was removed from the combined item pool.
IRT also identified six items with very low information
and discriminating ability, that were not identified by the
CTT. All of these items (except one) were derived from the
WHOQOL [34]. These items may have had low informa-
tion and discrimination with respect to measuring partic-
ipation restriction as the WHOQOL was developed to
explicitly measure quality of life, rather than particpation
restriction (where quality of life was defined as ''individu-
als' perception of their position in life in the context of the cul-
ture and value systems in which they live an in relation to their
goals, expectations, standards and concerns' [45]).
The other item with low information was concerned with
hobbies (P2). This item may have been identified as a can-
didate for removal because the meaning of hobbies may
not be clear or appropriate especially when other items
include social and leisure activities i.e. what constitutes a
hobby opposed to a leisure activity? Therefore, all 6 items
identified from the IRT analysis were also removed from
the item pool. Thus the CTT and IRT analysis resulted in 9
P items being retained and eleven items being removed
including the one item already removed due to having
greater than 10% missing data (see Table 3 where items in
bold were removed).
Resultant measures of I, A and P
The resultant measures of Impairment (9 items), Activity
Limitation (17 items) and Participation Restriction (9
items) were explored. These uncontaminated measures
are now referred to collectively as the Aberdeen Impair-
ment, Activity Limitation and Participation Restriction
measures (Ab-IAP) and individually as the Aberdeen
Impairment measure (Ab-I), Aberdeen Activity Limitation
measure (Ab-A) and the Aberdeen Participation Restric-
tion measure (Ab-P).
Each of the uncontaminated measures correlated with the
appropriate SF-36 subscale more than any other SF-36
subscale i.e. Ab-I with SF_pain; Ab-A with SF_phys and
Ab-P with SF_soc (see Table 7).
All of the resultant measures had Cronbach's alpha > 0.8
(Cronbach's alpha Ab-I = 0.84 (n = 9), Ab-A = 0.94 (n =
17), Ab-P = 0.86 (n = 9).
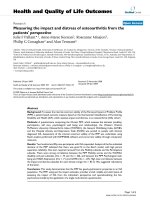
The IRT analysis was rerun with the reduced items for each
construct. The IRT indicated very good reliability across
the whole construct for Ab-A (see Figure 2). All informa-
tion was > 5 this equates to a reliability of > 0.80. There
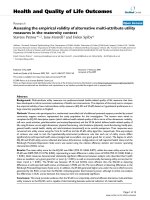
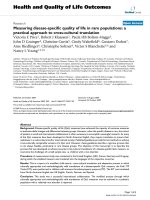
was good reliability across the central range of the con-
struct for Ab-I and Ab-P (Figures 3 and 4). However, Ab-I
was not adequately reliable at the very high levels of
impairment (θ > 2) and the measure of Ab-P was not ade-
quate at low levels of participation restriction (θ < 1.5).
This suggests that new items should be added to address
these areas.
There was very good fit for Ab-I with no differences
between the observed and expected response categories >
0.01.
The fit for Ab-A indicated that 15 of the 85 response cate-
gories had differences between observed and expected
response categories greater than 0.01, however, only one
of these was greater than 0.02. This indicated reasonable
fit but was worse than with all Activity Limitation items in
the item pool.
The fit for Ab-P was improved over the fit with all the Par-
ticipation Restriction items in the original item pool.
Now, only 9 of the 45 differences were > 0.01. Seven of
these were less than < 0.02 and the remaining two had a
difference = 0.022. Six of these were from the first
response category (i.e. the 'not at all' category). This was
probably due to the positive skew on many of the Ab-P
items.
The distributions of Ab-I, Ab-A and Ab-P all appeared
approximately normal when graphically examined (see
Figures 5, 6 and 7). None of the other measures had sig-
nificant skewness or kurtosis using an alpha level of 0.01.
Discussion
In this paper, new measures of I, A and P have been devel-
oped that were specifically derived to measure each ICF
component without contamination from other constructs
in the model. These new measures can be used to improve
assessment in both theory testing and the evaluation of
interventions. For theory testing, the use of these uncon-
taminated measures should reduce over-inflation of
observed relationships between constructs that may occur
if measures are contaminated with other related con-
structs or the under-inflation that may occur if the meas-
ures are contaminated with constructs unrelated
constructs. For example, the new measures should allow
for more accurate evaluations of the relationships
between the ICF components as these measures should
not be contaminated with other constructs in the model.
For evaluating an intervention, the new measures allow
for the assessment of the three distinct ICF components.
Failure to adequately measure each distinguishable out-
come might result in failure to detect benefit or harm due
to an intervention or to a treatment. For example, in the
Health and Quality of Life Outcomes 2009, 7:41 />Page 14 of 20
(page number not for citation purposes)
Table 6: P_irt item parameters
Item parameters
P_irt item Discrim Difficulty: location parameters
ab1
(se)
b2
(se)
b3
(se)
b4
(se)
P1. How does your joint problem restrict your opportunities for leisure activities? 1.39 -3.40
(0.41)
-2.19
(0.24)
-0.90
(0.13)
1.05
(0.16)
P2. How does your joint problem restrict you doing your hobbies? 1.09 -2.54
(0.32)
-1.54
(0.21)
-0.30
(0.13)
1.58
(0.24)
P3. How does your joint problem restrict you doing your usual social activities? 1.93 -2.16
(0.18)
-0.89
(0.10)
0.13
(0.09)
1.57
(0.16)
P4. How does your joint problem restrict you visiting friends or relatives? 2.84 -0.90
(0.08)
-0.03
(0.07)
0.67
(0.08)
1.80
(0.13)
P5. How much of the time has your physical health or emotional problems interfered with your
social activities (like visiting with friends, relatives, etc.)?
2.16 -0.76
(0.09)
-0.11
(0.08)
0.79
(0.09)
1.72
(0.15)
P6. How much do you enjoy life? 1.16 -2.69
(0.36)
0.53
(0.14)
2.62
(0.35)
4.44
(0.76)
P7. How healthy is your physical environment? 0.87 -2.17
(0.35)
0.49
(0.18)
3.31
(0.56)
5.62
(1.14)
P8. How available to you is the information that you need in your day-to-day life? 1.11 -1.25
(0.19)
1.06
(0.19)
2.81
(0.39)
4.86
(0.91)
P9. How satisfied are you with your personal relationship? 0.97 -1.10
(0.20)
1.12
(0.21)
2.45
(0.37)
4.27
(0.74)
P10. How does your joint problem restrict you having friends or relatives over to your home? 1.94 -0.22
(0.08)
0.63
(0.10)
1.67
(0.16)
2.56
(0.28)
P11. How satisfied are you with your transport? 0.91 -1.19
(0.23)
1.87
(0.33)
3.75
(0.65)
5.40
(1.12)
P12. How does your joint problem restrict you getting on with people (friends and family)? 1.78 -0.19
(0.09)
0.66
(0.11)
1.95
(0.21)
3.05
(0.39)
P13. How satisfied are you with your access to health services? 0.68 -1.35
(0.32)
3.02
(0.67)
5.14
(1.16)
9.08
(2.74)
P14. How satisfied are you with the support you get from your friends? 0.69 -1.08
(0.28)
2.98
(0.62)
6.35
(1.46)
7.36
(1.91)
P16. How does your joint problem restrict you affording things you need? 1.26 0.61
(0.14)
1.35
(0.20)
2.11
(0.30)
2.99
(0.45)
P17. How does your joint problem restrict you showing affection? 1.42 0.50
(0.12)
1.34
(0.18)
2.38
(0.31)
3.49
(0.54)
P18. How satisfied are you with the conditions of your living place? 0.97 -0.01
(0.15)
2.91
(0.49)
4.52
(0.87)
6.55
(1.68)
P19. How does your joint problem restrict you telephoning friends or relatives? 2.27 1.08
(0.12)
1.80
(0.21)
2.97
(1.12)
4.77
(-)
TOTAL
Key: Items in bold = items with low discrimination parameter (< 1.25), (-) = not calculated
Health and Quality of Life Outcomes 2009, 7:41 />Page 15 of 20
(page number not for citation purposes)
treatment of patients with severe arthritis, an analgesic
might predominantly affect impairment, an exercise pro-
gramme might influence activity limitations and partici-
pation restrictions, but have little influence on
impairment, whereas providing additional transport serv-
ices might only alter participation restriction. If combined
or contaminated measures are used then positive or nega-
tive effects may be masked.
While the previous work on the selection of items identi-
fied some items relevant for any population [1], this paper
develops measures specifically in the context of joint
replacement surgery, mainly for osteoarthritis. Thus the
measures are particularly relevant for that population,
even though some of the items originated from generic
measures. Further work would be necessary to confirm the
value of the measures for different populations.
Two methods of item analysis were explored, the tradi-
tional CTT approach and the more recent IRT method.
These methods have their strengths and weaknesses. The
use of both methods may yield more information than
only using one of the methods. Each method was
explored individually and then the results from each
method compared and contrasted. CTT and IRT methods
identified common items for removal from the item pool.
Each method also suggested some items that could be
removed that were not indicated by the other method
using the criteria outlined. The CTT-MAP analysis indi-
cated that three items were more highly correlated with a
total other than the hypothesised construct total. There
were feasible explanations for the removal of all three
items. IRT additionally highlighted items that had low
information and could possibly be removed. This was
preferable to the CTT approach of item reduction where
factor analysis is used and may result in small areas of a
construct being covered. This problem is even more likely
if some of the items have similar wordings as these would
be the strongest indicator of the factor and be retained
ahead of other items. Using IRT can also result in the
items representing a small area of the construct. However,
this is driven by a different theoretical approach to CTT,
based upon items not discriminating well or not having
much information.
The decision to use a discriminating parameter of < 1.25
as a criteria for item removal was somewhat arbitrary. As
described earlier, the decision was based on published
suggestions but as yet there is no consensus on what val-
ues for the discrimination parameter or information func-
tion are acceptable. Again, there were plausible reasons
why items had been identified as having low information
and so they were also removed from the item pool.
The IRT analysis indicated that the model fitted using the
pool of candidate items for P_irt had poorer fit than the
I_irt and A_irt models. However, as there is no consensus
about how to assess model fit or how to deal with misfit-
ting data [46], the effect of this is difficult to quantify and
so this may have an effect on the results for Participation
Restriction. The P_irt had fewer items than the I_irt or
A_irt sets of items. This reflected the observation that
commonly used measures in OA tended to focus on I and
A. Our analysis of 342 items found only 44 pure P
items[1]. Nevertheless, the resultant measure of Participa-
tion Restriction appeared to have acceptable properties.
The item analysis resulted in the removal of 4 Impairment
items, 9 Activity Limitation items and 11 Participation
Restriction items with 14 of these items being identified
by both CTT and IRT. The resultant measures consisted of
9 Impairment items (Ab-I), 17 Activity Limitation items
(Ab-A) and 9 Participation Restriction items (Ab-P). The
correlations of the resultant measures with the criterion
variable of the SF-36 appeared to follow the expected pat-
tern. The measures had acceptable Cronbach's alpha (all >
0.8). However, when this was explored in more detail
using IRT, Ab-I was not reliable at very high levels of
impairment while Ab-P was not reliable at the low end of
the construct. This suggests that new items should be writ-
ten to cover these areas if it is to be used for all ability lev-
els. So, for Ab-I, some 'easy' items should be written to
discriminate the high end of the construct e.g. 'my joint is
uncomfortable (never to always aches)'. For Ab-P some new
'hard' items should be added to discriminate this area of
the construct e.g. 'are you able to participate in sporting activ-
ities?' This illustrates an advantage of using IRT, as the lack
of reliability at the extremes of the construct was not iden-
tified by the CTT analysis. It is possible that the lack of reli-
able items at the ends of the I and P constructs may be due
to the items having been selected from measures that were
developed using CTT methods. For example, a high Cron-
bach's alpha can be achieved by selecting items that are all
strongly related to each other but may cluster around a
small area on the underlying construct. The total informa-
tion was greatest for Ab-A with information > 10 across
most of the construct.
Table 7: Pearson correlations of Ab-IAP with SF-36 subscales
SF_pain SF_phys SF_soc
Ab-I 625(**) 515(**) 481(**)
Ab-A 604(**) 627(**) 596(**)
Ab-P 554(**) 541(**) 685^(**)/ 770(**)
** Correlation is significant at the 0.01 level (2-tailed).
^ As Ab-P contained an item based on an SF-36 item, this item was
removed from the total of Ab-P.
Health and Quality of Life Outcomes 2009, 7:41 />Page 16 of 20
(page number not for citation purposes)
The Graded Response Model fit was acceptable for the Ab-
I, Ab-A and Ab-P models. The model fit was better than it
had been for the candidate item models for Impairment
(I_irt) and Participation Restriction (P_irt) but a little
worse for Activity Limitation (A_irt). The distributions
appeared approximately normal when graphically exam-
ined, although Ab-P had statistically a slight skew.
A two parameter IRT model was selected in order to be
able to estimate both a difficulty and discrimination
parameter. There is much debate between using the single
parameter Rasch model (where item difficulty is esti-
mated and equal item discrimination is assumed) or a
more general 2 parameter IRT model. Some favour the
single parameter Rasch model as they believe it adheres to
the fundamental measurement principle that all items
behave in the same way (i.e. the data must fit the model)
[47]. Others favour using an IRT model that best fits the
data and suggest the Rasch model may be too restrictive
and can lead to discarding useful items (see [48,49]). In
Total information across the construct for Ab-AFigure 2
Total information across the construct for Ab-A.
Test information curve - solid line; Standard error curve - dotted line.
Total information across the construct for Ab-IFigure 3
Total information across the construct for Ab-I.
Test information curve - solid line; Standard error curve - dotted line.
Health and Quality of Life Outcomes 2009, 7:41 />Page 17 of 20
(page number not for citation purposes)
this study, we are interested in developing measures that
are tailored to OA. We therefore chose to use an approach
that allows us to select items that convey the most infor-
mation about our chosen population rather than force
particular properties on each item in our measure. In
addition, with a limited set of items it is unlikely that suf-
ficient items would be found that cover the construct as
well as all having the same discrimination. The formation
of very large item banks for computer adaptive testing
(CAT), may, in the future, allow the use of the Rasch
model to develop tailored questionnaires. Until such
time, we take the pragmatic approach and select the two
parameter IRT model.
Total information across the construct for Ab-PFigure 4
Total information across the construct for Ab-P.
Test information curve - solid line; Standard error curve - dotted line.
Histogram of Ab-IFigure 5
Histogram of Ab-I.
Histogram of Ab-AFigure 6
Histogram of Ab-A.
Health and Quality of Life Outcomes 2009, 7:41 />Page 18 of 20
(page number not for citation purposes)
The selected items could be explored further. If a shorter
measure was required, stricter criteria could be used for
selecting items with IRT. Alternatively, a decision could be
made on how many items the resultant measure should
have. Using IRT methods, items could be identified that
have information (precision) across the construct domain
[50].
The response rate of 43% was quite low but reasonable
given the long length of the questionnaire (27 pages, 254
items). It appeared that the sample was representative as
there were no differences between the responders and
non-responders on gender, age and disability. The ques-
tion remains to whether the 60% who did not participate
were significantly different from the sample on other
unmeasured variables.
This study was based on a population with severe hip or
knee problems as they were assessed prior to surgery. If a
measure is required to assess patients post-operatively, or
patients in the earlier stages of osteoarthritis, then the
same items should be useful as IRT is an invariant method
(i.e. item parameters should be similar even with a sample
that has different levels of 'ability'). However, the accuracy
of the parameter estimates does depend on the limitation
levels of the calibration sample. As the sample of patients
about to undergo joint replacement has relatively low lev-
els of 'ability' then the parameter estimates would be most
accurate for the easier items. Hence, it would be useful to
repeat the analysis on patients after surgery as these
patients would have more 'ability' and thus should pro-
vide more accurate parameter estimates for the harder
items. Additionally, this would also allow an empirically
evaluation of the invariant property of IRT.
The resultant measures appeared to have acceptable prop-
erties to date. However, only a preliminary psychometric
evaluation of reliability and validity was carried out. As
reliability and validity can never be proved but is based on
an accumulation of evidence, much further empirical test-
ing needs to be carried out.
The resultant measures have been constructed to represent
the theoretical constructs without contamination from
other constructs in the ICF model to allow for the testing
of the ICF model. However, this representation was based
on the DCV judgements of expert judges and may not rep-
resent the discrimination made by respondents to the
measures. It will be important to explore if the measures
are statistically independent using patients responses to
the items.
Conclusion
These analyses have resulted in new measures that reflect
the three ICF constructs (I, A and P) in people having joint
surgery for severe arthritis. The new measures have good
psychometric properties, discriminate well across the
dimension and retain only informative, non-redundant
items. While these measures can be improved further,
they offer an advance on existing osteoarthritis measures
in assessing ICF constructs.
The use of both CTT and IRT for item analysis appeared to
provide more information than the use of only one of
these methods. On preliminary exploration of the proper-
ties, the new measures appeared acceptable. However,
additional items should be considered to cover the
extreme ends of the construct for the impairment and par-
ticipation restriction measures if a measure is required
that covers the entire underlying construct.
Competing interests
The authors declare that they have no competing interests.
Authors' contributions
BP participated in the conception and design of the study,
the analysis and the drafting and revision of the manu-
script. MJ participated in the conception and design of the
study and the drafting and revision of the manuscript. PD
and DD contributed to the interpretation of the data and
revision of the manuscript. All authors read and approved
the final manuscript.
Histogram of Ab-PFigure 7
Histogram of Ab-P.
Health and Quality of Life Outcomes 2009, 7:41 />Page 19 of 20
(page number not for citation purposes)
Additional material
Acknowledgements
We are very grateful to Professor David Rowley for access to the patients
at Ninewells Hospital, Dundee and Linda Johnston for her help in running
the study.
This study was funded by the Medical Research Council – Health Services
Research Collaboration (MOBILE research programme).
References
1. Pollard B, Johnston M, Dieppe P: What do osteoarthritis health
outcome instruments measure? Impairment, activity limita-
tion, or participation restriction? Journal of Rheumatology 2006,
33:757-763.
2. WHO: International Classification of Functioning, Disability and Health
Geneva: World Health Organisation; 2001.
3. WHO: International Classification of Impairments, Disabilities and Handi-
caps Geneva: World Health Organisation; 1980.
4. Wilkie R, Peat G, Thomas E, Croft PR: Measuring the conse-
quences of osteoarthritis and joint pain in population-based
studies: Can existing health measurement instruments cap-
ture levels of participation? Arthritis & Rheumatism-Arthritis Care &
Research 2004, 51:755-762.
5. Weigl M, Cieza A, Harder M, Geyh S, Amann E, Kostanjsek N, et al.:
Linking osteoarthritis-specific health-status measures to the
International Classification of Functioning, Disability, and
Health (ICF). Osteoarthritis Cartilage 2003, 11:519-523.
6. Perenboom RJM, Chorus AMJ: Measuring participation accord-
ing to the International Classification of Functioning, Disabil-
ity and Health (ICF). Disability and Rehabilitation 2003, 25:577-587.
7. Cieza A, Brockow T, Ewert T, Amman E, Kollerits B, Chatterji S, et
al.: Linking health-status measurements to the international
classification of functioning, disability and health. Journal of
Rehabilitation Medicine 2002, 34:205-210.
8. Akai M, Doi T, Fujino K, Iwaya T, Kurosawa H, Nasu T: An outcome
measure for Japanese people with knee osteoarthritis. Journal
of Rheumatology 2005, 32:1524-1532.
9. Wilkie R, Peat G, Thomas E, Hooper H, Croft PR: The Keele
Assessment of Participation: A new instrument to measure
participation restriction in population studies. Combined
qualitative and quantitative examination of its psychometric
properties. Quality of Life Research 2005, 14:1889-1899.
10. Gignac MAM, Backman CL, Davis AM, Lacaille D, Mattison CA, Mon-
tie P, et al.: Understanding social role participation: What
matters to people with arthritis? Journal of Rheumatology 2008,
35:1655-1663.
11. Johnston M, Pollard B: Consequences of disease: testing the
WHO international classification of impairments, disabilities
and handicaps (ICIDH) model. Social Science & Medicine 2001,
53:1261-1273.
12. Cronbach LJ: Coefficient alpha and the internal structure of
tests. Psychometrika 1951, 16:297-334.
13. Singh J: Tackling measurement problems with Item Response
Theory: Principles, characteristics, and assessment, with an
illustrative example. Journal of Business Research 2004, 57:184-208.
14. Fletcher RB, Hattie JA: An examination of the psychometric
properties of the physical self-description questionnaire
using a polytomous item response model. Psychology of Sport
and Exercise 2004, 5:423-446.
15. Prieto L, Alonso J, Lamarca R: Classical test theory versus Rasch
analysis for quality of life questionnaire reduction. Health and
Quality of Life Outcomes 2003, 1:27.
16. Fayers PM, Machin D: Factor analysis. In Quality of life Assessment in
Clinical Trials: Methods and Practice Edited by: Staquet M, Hays RFP.
Oxford: Oxford University Press; 1998:191-226.
17. Embretson SE, Reise SP: Item response theory for psychologists New Jer-
sey: Lawrence Erlbaum Associates; 2000.
18. Hambleton RK, Swaminathan H: Item response theory: Principles and
applications Boston: Kluwer-Nijhoff Publishing; 1985.
19. Reeve BB, Fayers P: Applying item response theory modelling
for evaluating questionnaire item and scale properties. In
Assessing quality of life in clinical trial: methods and practice Edited by: Fay-
ers P, Hays R. Oxford: Oxford University Press; 2005:55-74.
20. Hays RD, Brown J, Brown LU, Spritzer KL, Crall JJ: Classical test
theory and item response theory analyses of multi-item
scales assessing parents' perceptions of their children's den-
tal care. Med Care 2006, 44:S60-S68.
21. Insall JN, Dorr LD, Scott RD, Scott WN: Rationale of the knee
society clinical rating system. Clinical Orthopaedics and Related
Research 1989, 248:13-14.
22. Harris WH: Traumatic Arthritis of the hip after dislocation
and acetabular fractures: treatment by Mold arthroplasty.
Journal of Bone and Joint Surgery-American Volume 1969, 51:737-755.
23. Meenan RF, Gertman PM, Mason JH: Measuring health status in
arthritis – The Arthritis Impact Measurement Scales. Arthritis
and Rheumatism 1980, 23:146-152.
24. Carr AJ: A patient-centred approach to evaluation and treat-
ment in rheumatoid arthritis: The development of a clinical
tool to measure patient-perceived handicap. British Journal of
Rheumatology 1996, 35:921-932.
25. Williams A: Euroqol – A New Facility for the Measurement of
Health-Related Quality-Of-Life. Health Policy 1990, 16:199-208.
26. Patrick DL, Peach H: Disablement in the community Oxford: Oxford
University Press; 1989.
27. Fries JF, Spitz PW, Kraines RG, Holman HR: Measurement of
patient outcome in arthritis. Arthritis and Rheumatism 1980,
23:137-145.
28. Lequesne MG, Mery C, Samson M, Gerard P: Indexes of severity of
Osteoarthritis of the hip and knee. Scandinavian Journal of Rheu-
matology 1987, 65:85-89.
29. Harwood RH, Gompertz P, Ebrahim S: Handicap one year after a
stroke – validity of a new scale. Journal of Neurology Neurosurgery
and Psychiatry 1994, 57:825-829.
30. Dawson J, Fitzpatrick R, Murray D, Carr A: Questionnaire on the
perceptions of patients about total knee replacement. Journal
of Bone and Joint Surgery-British Volume 1998, 80B:63-69.
31. Dawson J, Fitzpatrick R, Carr A, Murray D: Questionnaire on the
perceptions of patients about total hip replacement. Journal
of Bone and Joint Surgery-British Volume 1996, 78B:185-190.
32. Ware JE, Sherbourne CD: The MOS 36-item short form health
survey (SF-36) .1. Conceptual framework and item selection.
Medical Care 1992, 30:473-483.
33. Bellamy N, Buchanan WW, Goldsmith CH, Campbell J, Stitt LW: Val-
idation study of WOMAC – A health status instrument for
measuring clinically important patient relevant outcomes to
antirheumatic drug-therapy in patients with osteoarthritis
of the hip or knee. Journal of Rheumatology 1988, 15:1833-1840.
34. WHOQOL group: The World Health Organisation quality of
life assessment (WHOQOL): Development and general psy-
chometric properties. Social Science & Medicine 1998,
46:1569-1585.
35. Tabachnick BG, Fidell LS: Using Multivariate Statistics 3rd edition. New
York: HarperCollins; 1996.
36. Haley SM, Andres PL, Coster WJ, Kosinski M, Ni P, Jette AM: Short-
form activity measure for post-acute care. Archives of Physical
Medicine and Rehabilitation 2004, 85:649-660.
Additional file 1
Additional file 1: Initial item pool reduction. Details of the initial item
pool reduction.
Click here for file
[ />7525-7-41-S1.doc]
Additional file 2
Additional file 1: Local independence analysis for Activity Limitation.
Details of CTT and IRT local independence analysis for Activity Limita-
tion.
Click here for file
[ />7525-7-41-S2.doc]
Publish with BioMed Central and every
scientist can read your work free of charge
"BioMed Central will be the most significant development for
disseminating the results of biomedical researc h in our lifetime."
Sir Paul Nurse, Cancer Research UK
Your research papers will be:
available free of charge to the entire biomedical community
peer reviewed and published immediately upon acceptance
cited in PubMed and archived on PubMed Central
yours — you keep the copyright
Submit your manuscript here:
/>BioMedcentral
Health and Quality of Life Outcomes 2009, 7:41 />Page 20 of 20
(page number not for citation purposes)
37. Hays R, Hayashi T, Carson S, Ware JE: User's Guide for Multitrait Anal-
ysis Program (MAP) Santa Monica, CA: The RAND corporation; 1988.
38. Samejima F: Estimation of a latent ability using a response pat-
tern of graded scores. Psychometric Monograph 1969.
39. Thissen D: MULTILOG: Multiple, categorical item analysisand test scoring
using item response theory 6th edition. Chicago: Scientific Software;
1991.
40. Cooke DJ, Michie C, Hart SD, Hare RD: Evaluating the screening
version of the hare psychopathy checklist – Revised (PCL:
SV): An item response theory analysis. Psychological Assessment
1999, 11:3-13.
41. Reckase M: Unifactor latent trait models applied to multifac-
tor tests: Results and implications. Journal of Educational Statistics
1979, 4:207-230.
42. Anderson RO: The theoretical development and empirical evaluation of a
logistic regression, paired-comparisons procedure for assessing unidimen-
sionality in the Rasch model. PhD Minnesota: University of Minnesota;
1994.
43. Sinar EF, Zickar MJ: Evaluating the robustness of graded
response model and classical test theory parameter esti-
mates to deviant items. Applied Psychological Measurement 2002,
26:181-191.
44. Lindeboom R, Holman R, Dijkgraaf MGW, Sprangers MAG, Buskens
E, Diederiks JP, et al.: Scaling the sickness impact profile using
item response theory: an exploration of linearity, adaptive
use, and patient driven item weights. Journal of Clinical Epidemi-
ology 2004, 57:66-74.
45. Kuyken W, Orley J, Power M, Herrman H, Schofield H, Murphy B, et
al.: The World-Health-Organization Quality-Of-Life Assess-
ment (Whoqol) – Position Paper from the World-Health-
Organization. Social Science & Medicine 1995, 41:1403-1409.
46. Downing SM: Item response theory: applications of modern
test theory in medical education. Medical Education 2003,
37:739-745.
47. Andrich D: Controversy and the Rasch model: a characteristic
of incompatible paradigms? Med Care 2004, 42:I7-16.
48. McHorney CA, Monahan PO:
Postscript: Applications of Rasch
analysis in health care. Med Care 2004, 42:I73-I78.
49. Ware JE, Bjorner JB, Kosinski M: Practical implications of item
response theory and computerized adaptive testing – A brief
summary of ongoing studies of widely used headache impact
scales. Medical Care 2000, 38:73-82.
50. Cooke DJ, Michie C: An item response theory analysis of the
hare psychopathy checklist – Revised. Psychological Assessment
1997, 9:3-14.