báo cáo hóa học: " Assessing the empirical validity of alternative multi-attribute utility measures in the maternity context" potx
Bạn đang xem bản rút gọn của tài liệu. Xem và tải ngay bản đầy đủ của tài liệu tại đây (317.16 KB, 12 trang )
BioMed Central
Page 1 of 12
(page number not for citation purposes)
Health and Quality of Life Outcomes
Open Access
Research
Assessing the empirical validity of alternative multi-attribute utility
measures in the maternity context
Stavros Petrou*
1,2
, Jane Morrell
3
and Helen Spiby
4
Address:
1
National Perinatal Epidemiology Unit, Department of Public Health, University of Oxford (Old Road Campus), Oxford, UK,
2
Health
Economics Research Centre, Department of Public Health, University of Oxford (Old Road Campus), Oxford, UK,
3
Centre for Health and Social
Care Research, School of Human and Health Sciences, University of Huddersfield, Huddersfield, UK and
4
Mother and Infant Research Unit,
Department of Health Sciences, University of York, York, UK
Email: Stavros Petrou* - ; Jane Morrell - ; Helen Spiby -
* Corresponding author
Abstract
Background: Multi-attribute utility measures are preference-based health-related quality of life measures that have
been developed to inform economic evaluations of health care interventions. The objective of this study was to compare
the empirical validity of two multi-attribute utility measures (EQ-5D and SF-6D) based on hypothetical preferences in a
large maternity population in England.
Methods: Women who participated in a randomised controlled trial of additional postnatal support provided by trained
community support workers represented the study population for this investigation. The women were asked to
complete the EQ-5D descriptive system (which defines health-related quality of life in terms of five dimensions: mobility,
self care, usual activities, pain/discomfort and anxiety/depression) and the SF-36 (which defines health-related quality of
life, using 36 items, across eight dimensions: physical functioning, role limitations (physical), social functioning, bodily pain,
general health, mental health, vitality and role limitations (emotional)) at six months postpartum. Their responses were
converted into utility scores using the York A1 tariff set and the SF-6D utility algorithm, respectively. One-way analysis
of variance was used to test the hypothetically-constructed preference rule that each set of utility scores differs
significantly by self-reported health status (categorised as excellent, very good, good, fair or poor). The degree to which
EQ-5D and SF-6D utility scores reflected alternative dichotomous configurations of self-reported health status and the
Edinburgh Postnatal Depression Scale score was tested using the relative efficiency statistic and receiver operating
characteristic (ROC) curves.
Results: The mean utility score for the EQ-5D was 0.861 (95% CI: 0.844, 0.877), whilst the mean utility score for the
SF-6D was 0.809 (95% CI: 0.796, 0.822), representing a mean difference in utility score of 0.052 (95% CI: 0.040, 0.064; p
< 0.001). Both measures demonstrated statistically significant differences between subjects who described their health
status as excellent, very good, good, fair or poor (p < 0.001), as well as monotonically decreasing utility scores (test for
linear trend: p < 0.001). The SF-6D was between 29.1% and 423.6% more efficient than the EQ-5D at detecting
differences in self-reported health status, and between 129.8% and 161.7% more efficient at detecting differences in the
Edinburgh Postnatal Depression Scale score. In addition, the SF-6D generated higher area under the curve (AUC) scores
generated by the ROC curves than the EQ-5D, indicating greater discriminatory power, although in all but one analysis
the differences in AUC scores between the measures were not statistically significant.
Conclusion: This study provides evidence that the SF-6D is an empirically valid and efficient alternative multi-attribute
utility measure to the EQ-5D, and is capable of discriminating between external indicators of maternal health.
Published: 6 May 2009
Health and Quality of Life Outcomes 2009, 7:40 doi:10.1186/1477-7525-7-40
Received: 17 February 2009
Accepted: 6 May 2009
This article is available from: />© 2009 Petrou et al; licensee BioMed Central Ltd.
This is an Open Access article distributed under the terms of the Creative Commons Attribution License ( />),
which permits unrestricted use, distribution, and reproduction in any medium, provided the original work is properly cited.
Health and Quality of Life Outcomes 2009, 7:40 />Page 2 of 12
(page number not for citation purposes)
Background
Economic evaluations of health care interventions are
increasingly being conducted throughout the industrial-
ised world to inform the efficient allocation of finite
health care resources [1]. In many jurisdictions, cost-util-
ity analysis represents the preferred technique of eco-
nomic evaluation [2]. The technique allows health
interventions, within and across health care programmes,
to be compared in terms of their costs and the health
improvements they procure, thereby permitting finite
health care resources to be allocated on a utilitarian 'cost
per unit of health improvement' basis [3]. Potential meas-
ures for estimating health improvements within a cost-
utility framework include the quality-adjusted life year
(QALY) [4], the healthy years equivalent (HYE) [5] and
the saved young life equivalent (SAVE) [6]. The QALY syn-
thesises information on the length of life and the health-
related quality of life into a single measure of health out-
come, and is the most widely used of the various meas-
ures.
Alternative approaches to deriving the health-related
quality of life component of the QALY for the purposes of
economic evaluation include scaling techniques, such as
the standard gamble, time trade-off and person trade-off
approaches, and multi-attribute utility measures, which
are essentially health status classification systems with
pre-existing utility scores (or preference weights) that can
be attached to each permutation of responses [7]. In prac-
tice, multi-attribute utility measures have acted as the pri-
mary source of data for QALY estimation in cost-utility
analyses [8,9]. The available multi-attribute utility meas-
ures include the Quality of Well-Being Scale [10], Rosser-
Kind Classification of Illness States [11], Health Utilities
Index (HUI) [12], EQ-5D [13], 16D [14], 17D [15],
Assessment of Quality of Life instrument (AQoL) [16] and
SF-6D [17]. The EQ-5D and the HUI are currently the
most widely used of the multi-attribute utility measures.
However, the recent development of the SF-6D, which is
derived from the Short Form 36 (SF-36) health survey
[18], one of the most widely used generic measures of
Table 2: Relationship between mean EQ-5D utility scores and self-reported health status (n = 493)
Group Overall utility score Self-reported health status p-value*
Excellent Very good Good Fair Poor
All women 0.861 0.964 0.908 0.819 0.651 0.366 <0.001
Age (years)
17–24 0.848 0.949 0.887 0.815 0.583 -0.077 <0.001
25–34 0.866 0.973 0.912 0.813 0.672 0.678 <0.001
35–44 0.855 0.954 0.923 0.861 0.659 0.121 <0.001
Ethnicity
White 0.864 0.968 0.911 0.821 0.659 0.366 <0.001
Non-white 0.793 0.840 0.835 0.804 0.508 - 0.125
Car ownership
Yes 0.876 0.963 0.915 0.825 0.714 0.455 <0.001
No 0.798 0.977 0.875 0.804 0.475 -0.077 <0.001
Housing tenure
Owner occupier 0.880 0.964 0.913 0.821 0.723 0.490 <0.001
Rented 0.807 0.965 0.888 0.817 0.565 0.243 <0.001
Paid employment
Yes 0.894 0.971 0.912 0.852 0.712 0.678 <0.001
No 0.800 0.941 0.894 0.775 0.626 0.055 <0.001
Plurality
Singleton 0.859 0.964 0.907 0.818 0.647 0.366 <0.001
Twin 0.970 1.000 1.000 1.000 0.848 - -
Spontaneous birth
Yes 0.867 0.965 0.907 0.824 0.651 - <0.001
No 0.847 0.961 0.910 0.809 0.623 0.366 <0.001
* ANOVA.
All tests for linear trend were statistically significant (p < 0.05) with the exception of non-white ethnic (p = 0.068) and twin (p = 0.053) sub-groups.
Health and Quality of Life Outcomes 2009, 7:40 />Page 3 of 12
(page number not for citation purposes)
health-related quality of life in health services research,
has the potential to considerably increase the derivation
of QALY estimates using existing and future data sets [17].
The selection of a multi-attribute utility measure for appli-
cation within an economic evaluation framework should
be informed by its psychometric properties in each clini-
cal context, including its practicality, reliability and valid-
ity [19]. A crucial requirement for health economists is
that there is evidence for the measure's empirical validity,
that is, that the measure generates utility scores (essen-
tially the health-related quality of life component of the
QALY) that reflect people's preferences. Brazier and
Deverill [4] propose a hierarchy of evidence for establish-
ing the empirical validity of multi-attribute utility meas-
ures: revealed preference data (i.e. preferences revealed
from actual decisions), stated preference data (i.e.
expressed preferences using techniques such as contingent
valuation [7]), and hypothetical preferences (i.e. prefer-
ences that are hypothesised or constructed by researchers)
[19]. Most commonly, establishing the empirical validity
of multi-attribute utility measures has involved examin-
ing whether the utility scores generated by the measures
reproduce hypothesised differences between groups of
individuals or patients [19]. To our knowledge, no study
to date has assessed the empirical validity of multi-
attribute utility measures in the maternity context. The
objective of this study was to compare the empirical valid-
ity of EQ-5D versus SF-6D utility scores based on hypo-
thetical preferences in a large maternity population in
England. In so doing, we aim to provide evidence on the
relative merits of two prominent multi-attribute utility
measures for those involved in analysing and interpreting
economic evaluations in the maternity context.
Methods
Study population
Women who participated in a randomised controlled trial
of additional postnatal support provided by trained com-
munity support workers represented the study population
for this investigation [20,21]. The trial recruited 623 Eng-
lish-speaking women from a university teaching hospital
in Sheffield, northern England, over the period October
1996 to November 1997. Women were eligible for the
trial if they were aged 17 years or over and had given birth
to a live baby. The population living in the catchment
areas of the teaching hospital broadly reflected the age
and ethnic profile for the general population of England
and Wales, but had a slightly lower fertility rate compared
with the general population and a higher proportion liv-
ing in underprivileged areas (highest category of Jarman
scores) [20]. Women recruited into the trial were more
likely to be older, of white ethnic origin, to have used tran-
scutaneous nerve stimulation during labour and to have
had a caesarean section than the 1046 women who
declined participation [20]. Individual women were ran-
domly allocated to a control group that was offered usual
postnatal care at home by community midwives (n = 312)
or an intervention group that was also offered a maximum
of 10 visits from specifically trained community postnatal
support workers for up to three hours per day in the first
28 postnatal days (n = 311). There were no significant dif-
ferences between the allocation groups in terms of a range
of general health and psychosocial outcome measures at
six weeks and six months postpartum [20]. Therefore, out-
comes for individual women allocated to either of the two
groups were pooled for the purposes of our empirical
investigation. Further details about the randomised con-
trolled trial, its methodology, outcome measures and
response rates are reported elsewhere [20].
Indicators of health status
Two key outcome measures completed by the women in
postal questionnaires at six months postpartum acted as the
external indicators of health status in this current investiga-
tion. The first was general health status, which was catego-
rised as excellent, very good, good, fair or poor. Self-reported
health status has been shown to have high internal consist-
ency, construct validity and reliability, as well as representing
a good predictor of morbidity and mortality [22,23]. The
second was the Edinburgh Postnatal Depression Scale
(EPDS), a validated and widely used non-diagnostic instru-
ment for indicating a woman's risk of postnatal depression,
a distressing mental disorder more prolonged than the blues
(which tend to occur in the first week after delivery) but less
severe than puerperal psychosis [24].
Multi-attribute utility measures
As part of the postal questionnaire completed at six
months postpartum, women completed the United King-
dom versions of the EQ-5D [13] and SF-36 [18] instru-
ments (Additional file 1).
The EQ-5D was developed by the 'EuroQol Group', a
multi-disciplinary group of researchers from seven centres
Table 1: Descriptive statistics of EQ-5D and SF-6D utility scores
(n = 493)
EQ-5D utility score SF-6D utility score
Mean 0.861 0.809
Standard deviation (0.181) (0.140)
Median 0.848 0.830
Inter-quartile range (0.796, 1.000) (0.706, 0.938)
Minimum -0.077 0.374
Maximum 1.000 1.000
95% CI (0.844, 0.877) (0.796, 0.822)
99% CI (0.838, 0.883) (0.792, 0.826)
Mean difference (95% CI) 0.052 (0.040, 0.064)*
CI denotes confidence interval.
* p-value < 0.001
Health and Quality of Life Outcomes 2009, 7:40 />Page 4 of 12
(page number not for citation purposes)
across five countries, which was formed to generate a car-
dinal preference-based index of health for comparative
purposes [25]. The EQ-5D consists of two principal meas-
urement components. The first is a descriptive system
which defines health-related quality of life in terms of five
dimensions: 'mobility', 'self care', 'usual activities', 'pain/
discomfort' and 'anxiety/depression' [13,25]. Responses
in each dimension are divided into three ordinal levels,
coded: (1) no problems; (2) some or moderate problems;
and (3) severe or extreme problems. The second measure-
ment component of the EQ-5D consists of a 20 cm verti-
cal visual analogue scale ranging from 100 (best
imaginable health state) to 0 (worst imaginable health
state), which provides an indication of the subject's own
assessment of their health status on the day of the survey
[13,25]. The women in the present study were asked to
complete the EQ-5D descriptive system and not the visual
analogue scale. The potential responses to the descriptive
system can theoretically generate 243 (3
5
) different health
states. For the purposes of our investigation, we applied
the York A1 tariff to each set of responses to the descrip-
tive system in order to generate an EQ-5D utility score for
each woman [26]. The York A1 tariff set had been derived
from a survey of the UK population (n = 3337), which
used the time trade-off valuation method to estimate pref-
erence weights for a subset of 45 EQ-5D health states, with
the remainder of the EQ-5D health states subsequently
valued through the estimation of a multivariate model
[26,27]. Utility scores in the York A1 tariff set range from
no problems on any of the five dimensions in the EQ-5D
descriptive system (value = 1.0) to severe or extreme
impairment on all five dimensions (value = -0.594) [27].
The York A1 tariff set represents the recommended general
population-based value set for the purposes of economic
evaluation in England and Wales [2].
The SF-36 health survey was developed from the RAND
Corporation's Health Insurance Experiment in the United
States [28]. The SF-36 measures health-related quality of
life, using 36 items, across eight dimensions: physical
Table 3: Relationship between mean SF-6D utility scores and self-reported health status (n = 493)
Group Overall utility score Self-reported health status p-value*
Excellent Very good Good Fair Poor
All women 0.809 0.916 0.856 0.741 0.652 0.507 <0.001
Age (years)
17–24 0.815 0.916 0.849 0.742 0.656 0.374 <0.001
25–34 0.806 0.911 0.856 0.735 0.655 0.583 <0.001
35–44 0.810 0.954 0.866 0.767 0.631 0.461 <0.001
Ethnicity
White 0.816 0.924 0.859 0.750 0.656 0.507 <0.001
Non-white 0.690 0.709 0.790 0.666 0.564 - 0.217
Car ownership
Yes 0.817 0.914 0.862 0.734 0.676 0.534 <0.001
No 0.776 0.928 0.828 0.759 0.583 0.374 <0.001
Housing tenure
Owner occupier 0.821 0.919 0.860 0.728 0.683 0.553 <0.001
Rented 0.778 0.903 0.837 0.771 0.613 0.461 <0.001
Paid employment
Yes 0.831 0.924 0.856 0.758 0.678 0.583 <0.001
No 0.767 0.886 0.852 0.716 0.638 0.432 <0.001
Plurality
Singleton 0.809 0.915 0.855 0.741 0.652 0.507 <0.001
Twin 0.822 1.000 0.902 0.681 0.628 - 0.109
Spontaneous birth
Yes 0.814 0.915 0.858 0.749 0.641 - <0.001
No 0.799 0.919 0.852 0.724 0.698 0.507 <0.001
* ANOVA.
All tests for linear trend were statistically significant (p < 0.05) with the exception of the non-white ethnic sub-group (p = 0.077).
Health and Quality of Life Outcomes 2009, 7:40 />Page 5 of 12
(page number not for citation purposes)
functioning, role limitations (physical), social function-
ing, bodily pain, general health, mental health, vitality
and role limitations (emotional). For each of the eight
dimensions, responses to the survey items are trans-
formed onto a 0 to 100 scale, with higher scores indicating
higher levels of health-related quality of life. In addition,
the SF-36 produces one physical component summary
score and one mental component summary score.
Although there is extensive evidence demonstrating the
ability of the SF-36 dimension and summary scores to
describe health differences between patient groups and
changes in health over time [29], the scores themselves do
not reflect population preferences required for the pur-
poses of QALY estimation. A number of algorithms for
deriving health state utility scores from SF-36 responses
have been published to date [17,30-33]. For the purposes
of this investigation, we applied the SF-6D utility algo-
rithm to each woman's responses to the SF-36 health sur-
vey in order to generate a SF-6D utility score for each
woman [17]. The SF-6D algorithm reduces the eight
dimensions of the SF-36 to six by combining role limita-
tions due to physical and emotional problems and omit-
ting general health perceptions. The combination of levels
across the physical functioning, role limitations, social
functioning, bodily pain, mental health and vitality
dimensions generates 18,000 (6 x 4 x 5 x 6 x 5 x 5) unique
health states. A study using a fractional factorial design
identified 249 health states from this universe of health
states, which were valued by a representative sample of
611 members of the UK general population using the
standard gamble valuation method [17]. The utility algo-
rithm applied in the present study is based on the econo-
metric model developed by Brazier et al. [17] to predict
health state valuations for all 18,000 SF-6D health states.
The algorithm generates utility scores for health states
ranging from no problems on any of the six dimensions
in the SF-6D descriptive system (value = 1.0) to the most
impaired level on all six dimensions (value = 0.296) [17].
Statistical methods
All analyses were based upon responses for women who
fully completed all external indicators of health status and
multi-attribute utility measures at six months postpartum;
no replacement or imputation was performed on missing
response items. The economic, socio-demographic and
clinical characteristics of women who did and did not
complete all items for the relevant health measures were
compared using the χ
2
test.
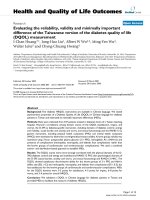
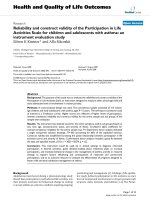
Scatter plot of paired EQ-5D and SF-6D utility scoresFigure 1
Scatter plot of paired EQ-5D and SF-6D utility scores.
EQ-5D
1.0000.8000.6000.4000.2000.000-0.200-0.400
SF-6D
1.000
0.800
0.600
0.400
0.200
0.000
Health and Quality of Life Outcomes 2009, 7:40 />Page 6 of 12
(page number not for citation purposes)
Descriptive statistics (mean, standard deviation [SD],
median, inter-quartile range, minimum, maximum, 95%
and 99% confidence intervals [CIs]) for the EQ-5D and
SF-6D utility scores were computed. The within-individ-
ual difference in mean utility score was tested using the
paired t-test. The distribution of data points within each
SF-6D dimension was calculated in cases where the EQ-
5D utility score equalled 1.0 and the SF-6D utility score
was less than 1.0. Similarly, the distribution of data points
within each EQ-5D dimension was calculated in cases
where the SF-6D utility score equalled 1.0 and the EQ-5D
utility score was less than 1.0.
The empirical validity of the EQ-5D and SF-6D utility
scores was examined in a number of ways. One-way anal-
ysis of variance was used to test the hypothetically-con-
structed preference rule that utility scores should differ
significantly between self-reported health status groups
and should decrease monotonically with deteriorating
self-reported health status [34]. Further, this preference
rule was tested for a number of economic, socio-demo-
graphic and clinical sub-groups of the study population as
previous research had indicated an association between
each of these factors and self-reported health status [27].
The ability of the EQ-5D and SF-6D instruments to detect
differences in external indicators of health status was
tested using the relative efficiency (RE) statistic. Self-
reported health status and the EPDS score represented the
external indicators of health status in our study. The rela-
tive efficiency statistic has been widely applied in the
broader health-related quality of life literature [35-40]. It
is defined as the ratio of the square of the t-statistic of the
comparator instrument (assumed to be the SF-6D utility
score for the purposes of this study) over the square of the
t-statistic of the reference instrument (assumed to be the
EQ-5D utility score for the purposes of this study) [35]. A
relative efficiency score of 1.0 indicates that the SF-6D has
the same efficiency as the EQ-5D at detecting differences
in external indicators of health status. A value higher than
1.0 indicates that the SF-6D is more efficient than the EQ-
5D at detecting differences in external indicators of health
status, whilst a score lower than 1.0 indicates that the SF-
6D is less efficient than the EQ-5D.
Table 4: Efficiency of multi-attribute utility measures to detect differences in self-reported health status; all women (n = 493)
Measure Categorisation of self-reported health status Utility score t-test
a
Relative efficiency
b
ROC curve
Mean (SD) t-statistic p-value Area
c
95% CI
EQ-5D Excellent 0.964 (0.085) 9.334 <0.001 1.000 0.721* (0.666, 0.776)
Very good, good, fair or poor 0.837 (0.189)
SF-6D Excellent 0.916 (0.091) 10.604 <0.001 1.291 0.798* (0.748, 0.849)
Very good, good, fair or poor 0.784 (0.138)
EQ-5D Excellent or very good 0.925 (0.119) 9.156 <0.001 1.000 0.756* (0.709, 0.802)
Good, fair or poor 0.765 (0.213)
SF-6D Excellent or very good 0.874 (0.108) 14.205 <0.001 2.407 0.841* (0.804, 0.877)
Good, fair or poor 0.712 (0.125)
EQ-5D Excellent, very good or good 0.890 (0.145) 7.222 <0.001 1.000 0.849* (0.790, 0.908)
Fair or poor 0.616 (0.258)
SF-6D Excellent, very good or good 0.830 (0.127) 10.742 <0.001 2.212 0.852* (0.800, 0.905)
Fair or poor 0.634 (0.119)
EQ-5D Excellent, very good, good or fair 0.867 (0.169) 3.469 0.018 1.000 0.814* (0.633, 0.996)
Poor 0.366 (0.353)
SF-6D Excellent, very good, good or fair 0.813 (0.136) 7.938 <0.001 5.236 0.847* (0.686, 1.000)
Poor 0.507 (0.093)
SD denotes standard deviation. ROC denotes receiver operating characteristic. CI denotes confidence interval.
a
Not assuming equality of variance as Levene test showed statistically significant differences in variances between self-reported health status groups.
b
Relative efficiency statistic is referenced to 1.0 for the EQ-5D measure. A value higher than 1.0 indicates that the SF-6D is more efficient than the
EQ-5D in detecting differences between women in terms of their self-reported health status.
c
Area under receiver operating characteristic (ROC) curves; * p < 0.05 indicates that area under the ROC curve was statistically significantly
greater than 0.5 and that measure has discriminatory power.
Health and Quality of Life Outcomes 2009, 7:40 />Page 7 of 12
(page number not for citation purposes)
In order to calculate the relative efficiency statistic, self-
reported health status had to be converted into a dichoto-
mous variable by dividing the study population into two
groups. The cut-off point used to create this dichotomous
variable is necessarily arbitrary and may lead to different
conclusions depending on which cut-off is chosen [41].
Therefore, self-reported health status was dichotomised in
alternative ways: (i) excellent versus very good, good, fair
or poor, (ii) excellent or very good versus good, fair or
poor, (iii) excellent, very good or good versus fair or poor,
and (iv) excellent, very good, good or fair versus poor, and
the relative efficiency statistic was recalculated. Similarly,
two alternative cut-off points were applied to the EPDS
score: (i) < 13 versus ≥ 13, and (ii) < 10 versus ≥ 10, on the
basis that a score of 13 or more is considered to indicate a
significant 'case' of postnatal depression, whilst scores of
10 to 12 indicate a borderline 'case' [24]. In addition,
because of concerns that the SF-6D utility algorithm
might over predict the value of the poorest health states
[17], which is reflected by the different lower bounds of
the EQ-5D and SF-6D utility scales, all relative efficiency
statistics were recalculated for a more restricted sample of
women for whom both EQ-5D and SF-6D utility scores
were between 0.296 (the lower bound of the SF-6D utility
scale) and 1.0.
Finally, the discriminatory properties of the EQ-5D and
SF-6D instruments in a maternity context were compared
using receiver operating characteristic (ROC) curves [42].
The ROC curve procedure provides a useful method of
evaluating the performance of multi-attribute utility
measures against external indicators of health status. For
the purposes of our analysis, dichotomous variables of
self-reported health status and the EPDS score were
adopted as the external indicators. The multi-attribute
utility measure that generates the largest area under the
ROC curve is regarded as the most sensitive at detecting
differences in the external indicator. A measure with per-
fect discrimination would generate an area under the
curve (AUC) score of 1.0, whilst a measure with no dis-
criminatory power would generate an AUC score of 0.5.
All p-values were considered statistically significant if they
were less than 0.05. All analyses were performed with a
Table 5: Efficiency of multi-attribute utility measures to detect differences in self-reported health status; women for whom both utility
scores were between 0.296 and 1.0 (n = 481)
Measure Categorisation of self-reported health status Utility score t-test
a
Relative efficiency
b
ROC curve
Mean (SD) t-statistic p-value Area
c
95% CI
EQ-5D Excellent 0.964 (0.085) 8.682 <0.001 1.000 0.712* (0.655, 0.768)
Very good, good, fair or poor 0.861 (0.137)
SF-6D Excellent 0.916 (0.091) 10.038 <0.001 1.337 0.792* (0.741, 0.844)
Very good, good, fair or poor 0.794 (0.129)
EQ-5D Excellent or very good 0.931 (0.103) 10.029 <0.001 1.000 0.747* (0.699, 0.795)
Good, fair or poor 0.804 (0.143)
SF-6D Excellent or very good 0.876 (0.106) 13.816 <0.001 1.898 0.835* (0.797, 0.872)
Good, fair or poor 0.725 (0.114)
EQ-5D Excellent, very good or good 0.897 (0.124) 8.672 <0.001 1.000 0.829* (0.763, 0.896)
Fair or poor 0.716 (0.126)
SF-6D Excellent, very good or good 0.833 (0.123) 9.663 <0.001 1.242 0.834* (0.775, 0.894)
Fair or poor 0.661 (0.105)
EQ-5D Excellent, very good, good or fair 0.882 (0.134) 6.482 0.018 1.000 0.720 (0.471, 0.970)
Poor 0.678 (0.053)
SF-6D Excellent, very good, good or fair 0.818 (0.l30) 10.121 0.006 2.438 0.770* (0.544, 0.997)
Poor 0.583 (0.039)
SD denotes standard deviation. ROC denotes receiver operating characteristic. CI denotes confidence interval.
a
Not assuming equality of variance as Levene test showed statistically significant differences in variances between self-reported health status groups.
b
Relative efficiency statistic is referenced to 1.0 for the EQ-5D measure. A value higher than 1.0 indicates that the SF-6D is more efficient than the
EQ-5D in detecting differences between women in terms of their self-reported health status.
c
Area under receiver operating characteristic (ROC) curves; * p < 0.05 indicates that area under the ROC curve was statistically significantly
greater than 0.5 and that measure has discriminatory power.
Health and Quality of Life Outcomes 2009, 7:40 />Page 8 of 12
(page number not for citation purposes)
microcomputer using Statistical Package for the Social Sci-
ences (SPSS) (version 15; SPSS Inc, Chicago, Illinois,
USA) software.
Results
Of the 623 women who participated in the randomised
controlled trial of additional postnatal support (20), 493
(79.1%) completed all relevant health measures for the
purposes of our investigation. An examination of the
characteristics of the women who did not fully complete
these measures revealed that they were more likely to be
less than 25 years of age, of non-white ethnic origin,
unemployed, living in rented accommodation and with-
out a car (p < 0.01). A full breakdown of the economic,
socio-demographic and clinical characteristics of the
study population is available from the authors upon
request.
Descriptive statistics of the EQ-5D and SF-6D utility scores
are presented in Table 1. The mean utility score for the
EQ-5D was 0.861 (95% CI: 0.844, 0.877), whilst the
mean utility score for the SF-6D was 0.809 (95% CI:
0.796, 0.822), representing a mean difference in utility
score of 0.052 (95% CI: 0.040, 0.064; p < 0.001) that
exceeded the utility score difference of 0.03 cited as a min-
imum clinically important difference for evaluative pur-
poses [43,44].
A total of 177 women (35.9% of analysed sample) had an
EQ-5D utility score of 1.0 and a SF-6D utility score of less
than 1.0. Notably, amongst women who did not identify
problems in any of the EQ-5D dimensions, 54 (10.9% of
analysed sample), 22 (4.5%), 27 (5.5%), 54 (10.9%), 144
(29.2%) and 168 (34.1%) identified problems (levels 2–
6) on the physical functioning, role limitations, social
functioning, bodily pain, mental health and vitality
dimensions of the SF-6D, respectively. In contrast, only 1
woman (0.2% of analysed sample), who identified mod-
erate pain or discomfort on the EQ-5D descriptive system,
Table 6: Efficiency of multi-attribute utility measures to detect differences in postnatal depression
Measure Categorisation of postnatal depression risk
score
Utility score t-test
a
Relative efficiency
b
ROC curve
Mean (SD) t-statistic p-value Area
c
95% CI
All women (n = 493)
EQ-5D EPDS score < 13 0.885 (0.147) 4.332 <0.001 1.000 0.696* (0.615, 0.777)
EPDS score ≥ 13 0.738 (0.244)
SF-6D EPDS score < 13 0.830 (0.129) 7.008 <0.001 2.617 0.767* (0.697, 0.837)
EPDS score ≥ 13 0.696 (0.132)
EQ-5D EPDS score < 10 0.896 (0.142) 5.404 <0.001 1.000 0.679* (0.619, 0.739)
EPDS score ≥ 10 0.780 (0.208)
SF-6D EPDS score < 10 0.843 (0.125) 8.192 <0.001 2.298 0.749* (0.696, 0.802)
EPDS score ≥ 10 0.724 (0.133)
Women for whom both utility scores were between 0.296 and 1.0 (n = 481)
EQ-5D EPDS score < 13 0.891 (0.130) 3.699 <0.001 1.000 0.664* (0.579, 0.750)
EPDS score ≥ 13 0.806 (0.152)
SF-6D EPDS score < 13 0.833 (0.126) 6.509 <0.001 3.096 0.760* (0.685, 0.835)
EPDS score ≥ 13 0.708 (0.123)
EQ-5D EPDS score < 10 0.901 (0.128) 5.110 <0.001 1.000 0.662* (0.600,
EPDS score ≥ 10 0.821 (0.141) 0.724)
SF-6D EPDS score < 10 0.846 (0.122) 7.800 <0.001 2.330 0.743* (0.688, 0.798)
EPDS score ≥ 10 0.735 (0.126)
EPDS denotes Edinburgh Postnatal Depression Scale. SD denotes standard deviation. ROC denotes receiver operating characteristic. CI denotes
confidence interval.
a
Not assuming equality of variance as Levene test showed statistically significant differences in variances between self-reported health status groups.
b
Relative efficiency statistic is referenced to 1.0 for the EQ-5D measure. A value higher than 1.0 indicates that the SF-6D is more efficient than the
EQ-5D in detecting differences between women in terms of their self-reported health status.
c
Area under receiver operating characteristic (ROC) curves; * p < 0.05 indicates that area under the ROC curve was statistically significantly
greater than 0.5 and that measure has discriminatory power.
Health and Quality of Life Outcomes 2009, 7:40 />Page 9 of 12
(page number not for citation purposes)
had a SF-6D utility score of 1.0 and an EQ-5D utility score
of less than 1.0.
Tables 2 and 3, respectively, present mean EQ-5D and SF-
6D multi-attribute utility scores for the study population
as a whole and for each of the self-reported health status
sub-groups. For the study population as a whole, mean
EQ-5D and SF-6D multi-attribute utility scores were
higher for women of white ethnic origin, women with a
car, women living in owner-occupied accommodation,
women in paid employment and women who had deliv-
ered spontaneously. Both multi-attribute utility measures
demonstrated statistically significant differences between
women who described their health status as excellent, very
good, good, fair or poor (p < 0.001). In addition, both
multi-attribute utility measures generated utility scores,
which decreased monotonically with deteriorating self-
reported health status (test for linear trend: p < 0.001).
The mean EQ-5D utility score was greater than the mean
SF-6D utility score for women who described their health
status as excellent (0.964 versus 0.916), very good (0.908
versus 0.856) or good (0.819 versus 0.741), but lower for
women who described their health status as fair (0.651
versus 0.652) or poor (0.366 versus 0.507). This reflected,
in part, the distribution of data points illustrated in Figure
1 with the EQ-5D yielding utility scores as low as -0.077,
whilst the minimum utility score generated by the SF-6D
was much higher up the utility scale (0.374). When the
data were analysed within each of the economic, socio-
demographic and clinical sub-groups, both multi-
attribute utility measures demonstrated statistically signif-
icant differences between women who described their
health status as excellent, very good, good, fair or poor (p
< 0.001), as well as monotonically decreasing utility
scores (test for linear trend: p < 0.001). The only sub-
groups for which this was not the case were women of
non-white ethnic origin and women who had delivered
twins, although this might be explained by the relatively
small numbers for these sub-groups (n = 27 and n = 5,
respectively).
The relative efficiency statistic was used to test how effi-
cient the EQ-5D and SF-6D instruments were in detecting
differences in external indicators of health status in this
context. When the self-reported health status variable was
dichotomised in alternative configurations, the SF-6D was
found to be between 29.1% (relative efficiency statistic of
1.291 versus 1.0) and 423.6% more efficient than the EQ-
5D at detecting differences in self-reported health status
(Table 4). Restricting the analyses to women for whom
both the EQ-5D and SF-6D utility scores were between
0.296 (the lower bound of the SF-6D utility scale) and 1.0
reduced the study population by 12. Despite the compres-
sion of the utility scale, the SF-6D remained between
24.2% and 143.8% more efficient at detecting differences
in self-reported health status in this restricted sample
(Table 5). When women were categorised in terms of their
risk of postnatal depression, the SF-6D was found to be
between 129.8% and 161.7% more efficient than the EQ-
5D at detecting differences between alternative EPDS pro-
files in the complete sample and between 133.0% and
209.6% more efficient in the restricted sample (Table 6).
Finally, the AUC scores generated by the ROC curves pro-
vided a further indication of the performance of the two
multi-attribute utility measures against external indicators
of health status. Both the EQ-5D and SF-6D were able to
discriminate between dichotomous configurations of self-
reported health status (Tables 4, 5) and dichotomous con-
figurations of risk of postnatal depression (Table 6), (p <
0.05). The only exception was the failure of the EQ-5D to
discriminate between women who reported excellent,
very good, good or fair health and women who reported
poor health in the restricted sample (Table 5). In all anal-
yses, the SF-6D generated higher AUC scores than the EQ-
5D, indicating greater discriminatory power (Tables 4, 5,
6). However, the corresponding CIs surrounding the AUC
scores were only mutually exclusive at the 5% significance
level when self-reported health status was dichotomised
as excellent or very good versus good, fair or poor (Tables
4, 5).
Discussion
It is now widely accepted that strategies to improve the
health and broader well-being of pregnant women and
new mothers should be underpinned by a strong evidence
base [45,46]. Health economics evidence has made an
important contribution towards policy and practice in
maternity care in recent years [47]. However, significant
gaps remain in our understanding of the production, dis-
tribution and evaluation of health and health care for
pregnant women and new mothers where health econom-
ics evidence could usefully contribute to an efficient and
equitable allocation of scarce resources. This is particu-
larly important in the context of childbearing as an event
of both health and social importance to women and their
families, considerations of investment in maternity serv-
ice provision and the burden of morbidity for childbear-
ing women [48]. One area where a significant gap in our
knowledge remains is an understanding of the relative
merits of multi-attribute utility measures that can be
incorporated into economic evaluations of maternity
care. Although multi-attribute utility measures have been
applied in randomised controlled trials of maternity inter-
ventions [20,21,49,50], no previous study, to our knowl-
edge, has directly assessed the psychometric properties of
these measures in the maternity context. The study
reported in this paper investigated the utility scores
derived from two multi-attribute utility measures cur-
rently in wide use, namely the EQ-5D and SF-6D. As such,
Health and Quality of Life Outcomes 2009, 7:40 />Page 10 of 12
(page number not for citation purposes)
it draws upon evidence from a rich data set, namely a ran-
domised controlled trial of additional postnatal support
provided by trained community support workers [20].
The main focus of the study centred on the empirical
validity of the utility scores generated by the EQ-5D and
SF-6D. Given the absence of a manifest gold standard for
measuring cardinal preferences for health outcomes, ana-
lysts testing the empirical validity of multi-attribute utility
measures are required to test whether the utility scores
they generate reflect hypothetically-constructed prefer-
ences, stated preferences or revealed preferences [34]. The
statistical analysis plan adopted by this study focussed on
whether the EQ-5D and SF-6D utility scores reflect the
hypothetically-constructed preferences of participants in
the community postnatal support worker trial. Our prior
hypothesis that both the EQ-5D and SF-6D utility scores
would differ significantly between self-reported health
status groups was met for the study population as a whole,
as well as for all but two economic, socio-demographic
and clinical sub-groups studied (women of non-white
ethnic origin and women who had delivered twins). Our
prior hypothesis that both the EQ-5D and SF-6D utility
scores would decrease monotonically with deteriorating
self-reported health status was also met for the study pop-
ulation as a whole and for all but two of the sub-groups
studied. Further, we showed that both measures discrimi-
nated between alternative dichotomous configurations of
self-reported health status and the EPDS score.
The analytical strategy that we adopted also tested the
degree to which EQ-5D and SF-6D utility scores reflect
external indicators of maternal health. The relative effi-
ciency statistic suggested that the SF-6D was between
29.1% and 423.6% more efficient than the EQ-5D at
detecting differences in self-reported health status, and
between 129.8% and 161.7% more efficient at detecting
differences in the EPDS score. Moreover, the SF-6D
remained more efficient at detecting differences in exter-
nal indicators of maternal health after sensitivity analyses
accounted for differences in the standard errors surround-
ing the two sets of utility scores at the lower end of the
utility scale. In addition, the SF-6D generated higher AUC
scores than the EQ-5D, indicating greater discriminatory
power, although in all but one analysis the differences in
AUC scores between the measures were not statistically
significant (as indicated by the overlapping 95% CIs).
There are several possible reasons why the SF-6D might be
more efficient at detecting external indicators of maternal
health than the EQ-5D. First, although both measures are
rooted in the World Health Organisation definition of
health, which covers physical, mental and social well-
being, the SF-6D may tap into broader aspects of health-
related quality of life, such as role and social functioning.
Second, the SF-6D has a greater number of response items
to each of its dimensions, resulting in a larger descriptive
system (18,000 health states versus 243 EQ-5D health
states) and, consequently, a possibly greater degree of sen-
sitivity to maternal health indicators. Third, the wording
of the SF-6D response items, which includes positive as
well as negative aspects of health, might independently
result in a greater degree of sensitivity to maternal health
indicators. Fourth, the longer time frame covered by the
SF-6D, which frames its questions in terms of health 'over
the past 4 weeks', as opposed to the time frame covered by
the EQ-5D descriptive system, which frames its questions
in terms of health 'today', might independently increase
its sensitivity to the external indicators of maternal health
adopted by this study. Ultimately, a full understanding of
the reasons for the greater efficiency of the SF-6D at detect-
ing external indicators of maternal health is beyond the
scope of this paper. Separate studies are required to test
the hypotheses set out above.
There are a number of caveats to the study results which
should be borne in mind by readers. First, the analytical
strategy focussed on whether EQ-5D and SF-6D utility
scores reflect hypothetically constructed preferences. The
external indicator of self-reported health status adopted
by our study represents a good predictor of morbidity and
mortality [22,23], whilst the external indicator of the
EPDS score has been shown to have high sensitivity and
specificity against diagnostic criteria in postpartum sam-
ples [51]. Ideally, we would also have liked to test the util-
ity scores generated by the EQ-5D and SF-6D measures
against stated preferences and revealed preferences. How-
ever, stated and revealed preference data were not col-
lected as part of the postnatal support worker trial.
Furthermore, markers for revealed preferences such as the
purchase of over the counter medications, for which some
relevant data were available, are prone to the problem of
contaminants and confounding factors, and this would
have made it difficult to interpret the basis of those pur-
chasing decisions. Second, all tests of empirical validity
that we performed were applied to cross-sectional data
collected at six months postpartum. The EQ-5D and SF-
6D were not administered at the time of randomisation
immediately after delivery and the EQ-5D was not admin-
istered at six weeks postnatally (whilst the SF-36 was) and,
consequently, we are unable to make any firm assertions
about how the EQ-5D might perform longitudinally
[52,53]. Third, the women in our study only completed
the EQ-5D descriptive system and not the EQ-5D visual
analogue scale. It should be noted that the values attached
to the descriptive system reflect general population prefer-
ences, whilst the visual analogue scores are patient based.
However, many decision-making bodies, such as the
National Institute for Health and Clinical Excellence in
England and Wales, highlight the importance of valuing
Health and Quality of Life Outcomes 2009, 7:40 />Page 11 of 12
(page number not for citation purposes)
health outcomes using population-based preferences of
the type we have used for the broader comparative pur-
poses of economic evaluation [2]. A fourth caveat to the
study is that concerns about the empirical validity of EQ-
5D and SF-6D utility scores should be counter-balanced
by a rounded assessment of all psychometric properties of
the measures in the maternity context. Although empirical
validity is considered to provide the acid test for validity,
other forms of validity, such as content validity, face valid-
ity, construct validity and valuation validity also require
consideration by analysts. Moreover, other psychometric
properties, such as practicality and reliability, are also of
relevance.
Conclusion
In conclusion, this study provides evidence that the SF-6D
is an empirically valid and efficient alternative multi-
attribute utility measure to the EQ-5D, and is capable of
discriminating between external indicators of maternal
health. Further research, which examines the psychometric
properties of the EQ-5D, SF-6D and other multi-attribute
utility measures in the maternity context, would strengthen
the limited evidence base currently available to analysts
conducting and interpreting economic evaluations.
Competing interests
The authors declare that they have no competing interests.
Authors' contributions
SP designed this empirical investigation and took the pri-
mary role in analysing the data and drafting the paper. JM
and HS were the principal clinical investigators for the
original postnatal support workers trial and contributed
to iterative drafts of the paper.
Additional material
Acknowledgements
We would like to thank all women who participated in the postnatal support
worker trial. Dr. Petrou is supported by a UK Medical Research Council Sen-
ior Non-Clinical Research Fellowship. The Health Economics Research Cen-
tre, University of Oxford, is funded by the National Co-ordinating Centre for
Research Capacity Development, England. The views contained in this paper
are held by the authors and not necessarily the funding bodies.
References
1. Drummond MF, Sculpher MJ, Torrance GW, O'Brien BJ, Stoddart GL:
Methods for the Economic Evaluation of Health Care Programmes 3rd edi-
tion. Oxford, UK: Oxford University Press; 2005.
2. National Institute for Health and Clinical Excellence (NICE): Guide to
the Methods of Technology Appraisal London, UK: NICE; 2008.
3. Maynard A, Bloor K: Our Certain Fate: Rationing in Health Care London,
UK: Office of Health Economics; 1998.
4. Torrance GW, Feeny D: Utilities and quality-adjusted life years.
Int J Technol Assess Health Care 1989, 5:559-575.
5. Mehrez A, Gafni A: Quality-adjusted life years, utility theory,
and healthy-years equivalents. Med Decis Making 1989,
9:142-149.
6. Nord E: An alternative to QALYs: the saved young life equiv-
alent (SAVE). BMJ 1992, 305:875-877.
7. Petrou S, Henderson J: Preference-based approaches to meas-
uring the benefits of perinatal care. Birth 2003, 30(4):217-226.
8. Glick HA, Doshi JA, Sonnad SS, Polsky D: Economic Evaluation in Clini-
cal Trials Oxford, UK: Oxford University Press; 2007.
9. Briggs A, Claxton K, Sculpher M: Decision Modelling for Health Eco-
nomic Evaluation Oxford, UK: Oxford University Press; 2006.
10. Kaplan RM, Bush JW, Berry CC: Health status: types of validity
and the index of well-being. Health Serv Res. 1976,
11(4):478-507.
11. Rosser RM, Kind P: A scale of valuations of states of illness: is
there a social consensus? Int J Epidemiol 1978, 7:347-358.
12. Torrance GW, Furlong W, Feeny D, Boyle M: Multi-attribute pref-
erence functions: Health Utilities Index. PharmacoEcon 1995,
7:503-520.
13. Brooks R: EQ-5D, the current state of play. Health Pol 1996,
37:53-72.
14. Apajasalo M, Sintonen C, Holmberg C, Sinkkonen J: Quality of life
in early adolescence: a sixteen-dimensional health-related
measure (16D). Qual Life Res 1996, 5:205-211.
15. Apajasalo M, Rautonen J, Holmberg C, Sinkkonen J: Quality of life
in pre-adolescence: a seventeen-dimensional health-related
measure (17D). Qual Life Res 1996, 5:532-538.
16. Hawthorne G, Richardson J, Atherton Day N: A comparison of the
Assessment of Quality of Life (AQoL) with four other
generic utility instruments. Ann Med 2001, 33:358-370.
17. Brazier J, Roberts J, Deverill M: The estimation of a preference-
based measure of health from the SF-36. J Health Econ 2002,
21(2):271-292.
18. Ware JE, Snow KK, Kolinski M, Gandeck B: SF-36 Health Survey Man-
ual and Interpretation Guide Boston, US: The Health Institute, New
England Medical Centre; 1993.
19. Brazier J, Deverill M: A checklist for judging preference-based
measures of health related quality of life: learning from psy-
chometrics. Health Econ 1999, 8:41-51.
20. Morrell CJ, Spiby H, Stewart P, Walters S, Morgan A: Costs and
benefits of community postnatal support workers: a ran-
domised controlled trial. Health Technol Assess 2000, 4(6):1-100.
21. Morrell CJ, Spiby H, Stewart P, Walters S, Morgan A: Costs and
effectiveness of community postnatal support workers: ran-
domised controlled trial. BMJ 2000, 321:593-598.
22. Lundberg O, Manderbacka K: Assessing the reliability of a meas-
ure of self-related health. Scand J Soc Med 1996, 24(3):218-224.
23. Idler EL, Benyamini Y: Self-related health and mortality: a
review of twenty-seven community studies. J Health Soc Behav
1997, 38(1):21-37.
24. Cox JL, Holden JM, Sagovsky R: Detection of postnatal depres-
sion: Development of the 10-item Edinburgh Postnatal
Depression Scale. Br J Psychiatry 1987, 150:782-786.
25. EuroQol Group: EuroQol – a new facility for the measurement
of health-related quality of life. Health Pol 1990, 16:199-208.
26. Dolan P: Modelling valuations for EuroQol health states. Med
Care 1997, 35(11):1095-1108.
27. Dolan P, Gudex C, Kind P, Williams A: The time trade-off
method: results from a general population survey. Health
Econ 1996, 5:141-154.
28. Ware JE, Sherbourne D: The MOS 36-item short form health
survey (SF-36). 1. Conceptual framework and item selection.
Med Care 1992, 30:473-483.
29. Garratt AM, Ruta DA, Abdalla MI, Buckingham JK, Russell IT: The
SF-36 health survey questionnaire: an outcome measure
suitable for routine use within the NHS? BMJ 1993,
306:1440-1444.
30. Fryback DG, Lawrence WF, Martin PA, Klein R, Klein BE: Predicting
quality of well-being scores from the SF-36: results from the
Beaver Dam Health Outcomes Study. Med Decis Making 1997,
17:1-9.
Additional file 1
Appendices A and B.
Click here for file
[ />7525-7-40-S1.doc]
Publish with BioMed Central and every
scientist can read your work free of charge
"BioMed Central will be the most significant development for
disseminating the results of biomedical research in our lifetime."
Sir Paul Nurse, Cancer Research UK
Your research papers will be:
available free of charge to the entire biomedical community
peer reviewed and published immediately upon acceptance
cited in PubMed and archived on PubMed Central
yours — you keep the copyright
Submit your manuscript here:
/>BioMedcentral
Health and Quality of Life Outcomes 2009, 7:40 />Page 12 of 12
(page number not for citation purposes)
31. Brazier J, Usherwood T, Harper R, Thomas K: Deriving a prefer-
ence-based single index from the UK SF-36 Health Survey. J
Clin Epidemiol 1998, 51:1115-1128.
32. Lundberg L, Johannesson M, Isacson DG, Borgquist L: The relation-
ship between health-state utilities and the SF-12 in a general
population. Med Decis Making 1999, 19:128-140.
33. Shmueli A: Subjective health status and health values in the
general population. Med Decis Making 1999, 19:122-127.
34. Brazier J, Deverill M, Green C, Harper R, Booth A: A review of the
use of health status measures in economic evaluation. Health
Technol Assess. 1999, 3(9):1-164.
35. Fayers P, Machin D: Quality of life: assessment, analysis and interpretation
Chichester, UK: Wiley; 2000.
36. Liang MH, Larson MG, Cullen KE, Schwartz JA: Comparative
measurement efficiency and sensitivity of five health status
instruments for arthritis research. Arthritis Rheum 1985,
28:542-547.
37. Mangione CM, Goldman L, Orav J, Marcantonio ER, Pedan A, Ludwig
LE, et al.: Health-related quality of life after elective surgery. J
Gen Intern Med 1997, 12(11):686-697.
38. Rockwood K, Joyce B, Stolee P: Use of goal attainment scaling in
measuring clinically important change in cognitive rehabili-
tation patients. J Clin Epidemiol 1997, 50(5):581-588.
39. Wright JG, Young NL: A comparison of different indices of
responsiveness. J Clin Epidemiol 1997, 50(3):239-246.
40. Gordon JE, Powell C, Rockwood K: Goal attainment scaling as a
measure of clinically important change in nursing-home
patients. Age Ageing 1999, 28:275-281.
41. van Doorslaer E, Wagstaff A, Bleichrodt H, Calonge S, Gerdtham UG,
Gerfin M, et al.: Income-related inequalities in health: some
international comparisons. J Health Econ 1997, 16:
93-112.
42. Stucki G, Liang MH, Fossel AH, Katz JN: Relative responsiveness
of condition-specific and generic health status measures in
degenerative lumbar spinal stenosis. J Clin Epidemiol 1995,
48:1369-1378.
43. Drummond MF: Introducing economic and quality of life meas-
urements into clinical studies. Ann Med 2001, 33:344-349.
44. O'Brien BJ, Spath M, Blackhouse G, Severens JL, Dorian P, Brazier J:
A view from the bridge: agreement between the SF-6D util-
ity algorithm and the Health Utilities Index. Health Econ 2003,
12(11):975-981.
45. National Institute for Health and Clinical Excellence (NICE): Antenatal
Care: Routine Care for the Healthy Pregnant Woman NICE Clinical
Guideline 62. London, UK: National Collaborating Centre for
Women's and Children's Health; 2008.
46. National Institute for Health and Clinical Excellence (NICE): Antenatal
and Postnatal Mental Health. Clinical Management and Service Guidance
NICE Clinical Guideline 45; 2007. reissued April 2007.
47. Department of Health (DH): National Service Framework for Children,
Young People and Maternity Services London, UK: DH Publications;
2004.
48. Bick D, MacArthur C: The extent, severity and effect of health
problems after childbirth. Br J Midwifery 1995, 3:27-31.
49. Macarthur C, Winter H, Bick D, Knowles H, Lilford R, Henderson C,
et al.: Effects of redesigned community postnatal care on
womens' health 4 months after birth: a cluster randomised
controlled trial. Lancet 2002, 359(9304):378-385.
50. Morrell CJ, Slade P, Warner R, Paley G, Dixon S, Walters SJ, et al.:
Clinical effectiveness of health visitor training in psychologi-
cally informed approaches for depression in postnatal
women: pragmatic cluster randomised trial in primary care.
BMJ 2009, 338:a3045. doi: 10.1136/bmj.a3045.
51. Murray L, Carothers AD: The validation of the Edinburgh Post-
natal Depression Scale on a community sample. Br J Psychiatry
1990, 157:288-290.
52. Longworth L, Bryan S: An empirical consideration of EQ-5D
and SF-6D in liver transplant patients. Health Econ 2003,
12(12):1061-1067.
53. Brazier J, Roberts J, Tsuchiya A, Busschbach J: A comparison of the
EQ-5D and SF-6D across seven patient groups.
Health Econ
2004, 13(9):873-884.