báo cáo hóa học: " Quality of life of Australian chronically-ill adults: patient and practice characteristics matter" doc
Bạn đang xem bản rút gọn của tài liệu. Xem và tải ngay bản đầy đủ của tài liệu tại đây (684.58 KB, 11 trang )
BioMed Central
Page 1 of 11
(page number not for citation purposes)
Health and Quality of Life Outcomes
Open Access
Research
Quality of life of Australian chronically-ill adults: patient and
practice characteristics matter
Upali W Jayasinghe*
1
, Judith Proudfoot
1
, Christopher A Barton
2
,
Cheryl Amoroso
1
, Chris Holton
2
, Gawaine Powell Davies
1
, Justin Beilby
3
and
Mark F Harris
1
Address:
1
Centre for Primary Health Care and Equity, School of Public Health & Community Medicine, University of New South Wales, Sydney,
New South Wales, Australia,
2
Discipline of General Practice, University of Adelaide, Adelaide, South Australia, Australia and
3
Faculty of Health
Sciences, University of Adelaide, Adelaide, South Australia, Australia
Email: Upali W Jayasinghe* - ; Judith Proudfoot - ;
Christopher A Barton - ; Cheryl Amoroso - ;
Chris Holton - ; Gawaine Powell Davies - ;
Justin Beilby - ; Mark F Harris -
* Corresponding author
Abstract
Background: To study health-related quality of life (HRQOL) in a large sample of Australian
chronically-ill patients and investigate the impact of characteristics of patients and their general
practices on their HRQOL and to assess the construct validity of SF-12 in Australia.
Methods: Cross sectional study with 96 general practices and 7606 chronically-ill patients aged 18
years or more using standard SF-12 version 2. Factor analysis was used to confirm the hypothesized
component structure of the SF-12 items. SF-12 physical component score (PCS-12) and mental
component score (MCS-12) were derived using the standard US algorithm. Multilevel regression
analysis (patients at level 1 and practices at level 2) was applied to relate PCS-12 and MCS-12 to
patient and practice characteristics.
Results: There were significant associations between lower PCS-12 or MCS-12 score and poorer
general health (10.8 (regression coefficient) lower for PCS-12 and 7.3 lower for MCS-12), low
socio-economic status (5.1 lower PCS-12 and 2.9 lower MCS-12 for unemployed, 0.8 lower PCS-
12 and 1.7 lower MCS-12 for non-owner-occupiers, 1.0 lower PCS-12 for less well-educated) and
having two or more chronic conditions (up to 2.7 lower PCS-12 and up to 1.5 lower MCS-12 than
those having a single disease). Younger age was associated with lower MCS-12 (2.2 and 6.0 lower
than middle age and older age respectively) but higher PCS-12 (4.7 and 7.6 higher than middle age
and older age respectively). Satisfaction with quality of care (regression coefficient = 1.2) and
patients who were married or cohabiting (regression coefficient = 0.6) was positively associated
with MCS-12. Patients born in non-English-speaking countries were more likely to have a lower
MCS-12 (1.5 lower) than those born in Australia. Employment had a stronger association with the
quality of life of males than that of females. Those attending smaller practices had lower PCS-12
(1.0 lower) and MCS-12 (0.6 lower) than those attending larger practices. At the patient level (level
1) 42% and 21% of the variance respectively for PCS-12 and MCS-12 were explained by the patients
Published: 3 June 2009
Health and Quality of Life Outcomes 2009, 7:50 doi:10.1186/1477-7525-7-50
Received: 15 January 2009
Accepted: 3 June 2009
This article is available from: />© 2009 Jayasinghe et al; licensee BioMed Central Ltd.
This is an Open Access article distributed under the terms of the Creative Commons Attribution License ( />),
which permits unrestricted use, distribution, and reproduction in any medium, provided the original work is properly cited.
Health and Quality of Life Outcomes 2009, 7:50 />Page 2 of 11
(page number not for citation purposes)
and practice characteristics. At the practice level (level 2), 73% and 49% of the variance respectively
for PCS-12 and MCS-12 were explained by patients and practice characteristics.
Conclusion: The strong association between patient characteristics such as socio-economic
status, age, and ethnicity and SF-12 physical and mental component summary scores underlines the
importance of considering these factors in the management of chronically-ill patients in general
practice. The SF-12 appears to be a valid measure for assessing HRQOL of Australian chronically-
ill patients.
Background
In 2004, 77% of Australians reported having at least one
long term medical condition [1]. Patients with chronic
conditions account for an increasing burden of disease
and presentations in general practice in Australia [2,3]
and the proportion of encounters for both diabetes and
cardiovascular disorders is increasing [3]. The manage-
ment of chronic illness has thus become a major focus in
general practice, both because of its prevalence and the
opportunity which general practice has to intervene early
to improve quality of life, prevent disability and reduce
hospital use. Since 1999, the Australian government has
introduced a variety of strategies to improve the care of
people with chronic illness [4]. Having effective ways of
assessing the health status of patients is critical to the eval-
uation and monitoring of these strategies [5].
The measurement of health-related quality of life
(HRQOL) from the perspective of the patient has become
a major aspect of health services evaluation [6]. The stand-
ardized measurement of health outcomes, through instru-
ments such as the SF-36, and more recently the SF-12, has
had significant benefit for all fields and professions con-
cerned with health [7,8]. In particular, standardized
assessment of health status is valuable for assessing the
effectiveness of medical interventions, for monitoring the
progress of patients in clinical settings, and for evaluating
health and well-being at the population level [9]. Investi-
gators from numerous countries representing diverse cul-
tures have determined that the SF-36 and SF-12 are
sensitive to differences in a number of socio-demographic
and clinical variables, including age [8,10], gender [8,11],
income [7,11-13], employment [7,11,14], education
[7,9,12,14], self reported general health [10], marital sta-
tus [15], ethnicity [6,9] and number of conditions
[10,12].
The study aimed to examine variations in the two sub-
scales of the SF-12 ('physical component score (PCS-12)'
and 'mental component score (MCS-12)') according to
practice and patient characteristics as well as satisfaction
with care and the number of medical conditions in a pop-
ulation of chronically-ill patients attending Australian
general practice. It also examined the construct validity of
SF-12 in this population.
Methods
Participants
This study was part of a larger study examining the impact
of the organizational capacity of general practices in Aus-
tralia to manage chronic diseases. It was conducted in 27
Divisions (local primary care support organizations) in
five states and in the Australian Capital Territory between
December 2003 and October 2004. The data on Division
characteristics showed that the 27 were representative of
the 103 Divisions approached except that recruited gen-
eral practices from 27 Divisions tended to be larger and to
have a lower population to general practitioners ratio
than the Australian average [16]. In each practice, clinical
management software was used to select a random sample
of 180 patients aged 18 years or more currently being pre-
scribed medication for three common chronic diseases:
asthma, type 2 diabetes, and hypertension/ischaemic
heart disease. Practices were permitted to remove patients
from the list who were deceased or otherwise inappropri-
ate to invite. A total of 12,544 patients attending 96 prac-
tices were invited to participate. Completed surveys were
received from 7606 patients (a response rate of 61%). A
priori sample size calculations on the SF-12 physical com-
ponent score confirmed that after adjustment for cluster-
ing (previous studies on SF-36 indicated a cluster effect
(ICC = Intra-cluster correlation) of 0.011 for the PCS-36
[14]) predicted that an average of 50 patients from each of
100 practices would have sufficient power (1-β = 0.8 and
α = 0.05) to detect an effect size of 0.10 between patients
with good and poor general health assuming that about
half of the patients were in good general health.
Ethics
Ethics approval for the study was obtained from the Uni-
versity of New South Wales (UNSW) Human Research
Ethics Committee and University of Adelaide Human
Research Ethics Committee. Both practice staff and
patients provided written informed consent.
Health and Quality of Life Outcomes 2009, 7:50 />Page 3 of 11
(page number not for citation purposes)
Instruments
The standard SF-12 version 2 is a 12-item questionnaire
measuring physical and mental health [6,12]. The adop-
tion of the SF-12 version 2 over the original version 1 form
for all new studies including population surveys is recom-
mended [17]. It is an abbreviated form of the SF-36
Health Survey, which is one of the most widely used
instruments for assessing HRQOL [12]. Both instruments
produce eight dimensions of health (physical functioning
(PF), role physical (RF), bodily pain (BP), general health
(GH), vitality (VT), social functioning (SF), role emo-
tional (RE), and mental health (MH)) [18,19]. They also
produce two summary scores – the Physical Component
Summary (PCS) and the Mental Health Component Sum-
mary (MCS) – and have been validated for use in the USA,
UK and many other European countries for large scale
health measurement and monitoring [12,19]. For ease of
interpretation, scores are standardized to population
norms, with the mean score set at 50 (SD = 10): higher
scores indicate better health. The SF-12 has been shown to
have good validity and reliability [17]. Previous research
has supported the use of the standard SF-12 in Australian
settings, rather than development of an 'Australian' short-
form [20,21]. The SF-12 is an instrument that can be
administered in three minutes with a small trade off
between brevity and precision [21].
The same sample of patients completed the General Prac-
tice Assessment Survey (GPAS) version 2 [22] along with
the SF-12. The patient characteristics including self-
reported general health and chronic medical condition/
conditions were collected using the GPAS. Patient satisfac-
tion was also assessed through the GPAS. The GPAS is a
multi-item self-report questionnaire which measures sev-
eral dimensions relating to patients' assessment of general
practice. The psychometric properties of the GPAS have
been evaluated [23].
Data and variables
The dependent variables were PCS-12 and MCS-12.
Because patients do not register with general practitioners
(GPs) in Australia, it was not possible to determine the
"list size" of practices accurately and thus the number of
general practitioners in a practice was used as a measure of
the practice size. Geographical area was defined by using
the Rural, Remote and Metropolitan Area (RRMA) classi-
fication [24] as urban (all metropolitan centers with pop-
ulations ≥ 100,000) or rural (rural centers and all other
areas with populations of less than 100,000). There were
no practices in the sample which were zoned as remote.
The socio-demographic characteristics of respondents
studied were gender, age, self-reported general health sta-
tus in the last 12 months, home ownership, education,
employment, marital status, country of birth, disease and
overall satisfaction with care (Table 1). Home ownership
can be considered as one marker of economic status [25].
For some respondents, their specific chronic disease or
diseases were not known and therefore 'unknowns' were
included in the analysis as a separate category to minimize
the data loss.
Statistical analyses
Summary physical (PCS-12) and mental (MCS-12) com-
ponents were constructed using the standard SF-12 ver-
sion 2 US algorithm empirically derived from the data of
a US general population survey [17]. To confirm the
dimensions as documented by Kontodimopoulos et al.
[26] and Ware et al. [17], we carried out a factor analysis
using SPSS statistical software (version 15; SPSS, Chicago,
IL, USA) with principal components analysis using the
varimax rotation [26]. The number of factors was deter-
mined by the scree test and eigen values > 1. The two prin-
cipal components were then rotated into simple
orthogonal structures, a procedure previously imple-
mented in similar studies [26]. It was hypothesized that
two factors would be obtained (Table 2) known as physi-
cal health and mental health. In addition, items originally
belonging to the PF, RP, BP and GH domains were
hypothesized to load (or correlate) higher on the physical
health factor, whereas the MH, RE, SF and VT items were
hypothesized to relate most strongly to the mental health
factor. However, VT and SF have been shown to load on
both physical and mental components [26].
First, we examined the association between the independ-
ent variables and physical or mental health component
scores in univariate analyses with analysis of variance
using SPSS (Table 1). The analysis of variance was con-
ducted to compare unadjusted scores. The Pearson χ
2
–
test was used to compare proportions analyzed and miss-
ing.
Multilevel Models
Multilevel regression models were used with two dimen-
sions (physical and mental component scores) as contin-
uous dependent variables and general practice and patient
characteristics, including the hypothesized interaction
between gender and employment (based on the previous
studies [15,27,28]), as the independent variables. Multi-
level analysis (with MLwiN Software [29]) adjusted for
clustering of patients (level 1) within practices (level 2)
[11,14,30]. Initially, we fitted a baseline variance compo-
nent model (no independent variables) for each of the
response variables followed by the main model. The main
model expands the baseline model by including patient
and practice characteristics with the hypothesized interac-
tion [15,27,28] as fixed effects. The interaction effect of
independent variables was included in the model if their
Health and Quality of Life Outcomes 2009, 7:50 />Page 4 of 11
(page number not for citation purposes)
Table 1: Unadjusted mean and standard deviation of PCS-12 and MCS-12 scores by characteristics of practices and patients (number
of patients = 7606; number of practices = 96)
Variable (definition) Responses PCS-12 MCS-12
No. % Mean
(SD)
P-value Mean
(SD)
P-value
Characteristics of practices
1–3 general practitioners 3970 52.2 41.8 (11.7) < 0.001 48.8 (11.4) 0.016
4 or more general practitioners 3636 47.8 43.0 (11.9) 49.4 (10.8)
Location of practice:
Urban 4468 60.1 42.8 (11.8) 0.001 49.0 (11.0) 0.698
Rural 3038 39.9 41.8 (11.9) 49.2 (11.2)
Characteristics of patients
Gender:
Male 3474 46.8 42.7(11.6) 0.16 49.8(10.9) < 0.001
Female 3944 53.2 42.3(12.0) 48.5(11.3)
Age (years):
18–39 Yrs 749 10.1 50.4(9.3) < 0.001 45.0(11.7) < 0.001
40–59 Yrs 2538 34.3 44.7(11.4) 47.3(11.3)
>59 yrs 4115 55.6 39.5(11.5) 51.0(10.5)
Health status
Good 4027 54.4 48.2 (8.9) < 0.001 52.8 (8.9) < 0.001
Poor 3382 45.6 35.5 (11.2) 44.6 (11.9)
Home ownership
Owner-occupied 5899 79.8 43.0 (11.7) < 0.001 49.9 (10.7) < 0.001
Rented 1496 20.2 40.4 (12.2) 46.0 (12.1)
Education
Degree/Diploma 2208 30.1 45.8 (11.2) < 0.001 48.7 (11.1) 0.071
Elementary/High School 5138 69.9 41.0 (11.8) 49.3 (11.1)
Employment
Employed 2536 34.3 48.4 (9.2) < 0.001 49.3 (10.2) < 0.001
Retired 2935 39.7 39.9 (11.3) 51.4 (10.3)
Unemployed
(looking for work/full-time education/looking after family/unable to work due to
sickness or disability)
1923 26.0 38.3 (12.5) 45.3 (12.4)
Marital status
Married (married/cohabiting) 5206 70.3 43.1 (11.6) < 0.001 49.7 (10.8) < 0.001
Unmarried (single/separated/divorced/widowed) 2200 29.7 41.0 (12.3) 47.6 (11.8)
Country of birth
Born in Australia 5474 74.6 42.6 (11.8) 0.008 49.2 (11.0) 0.001
Born in USA/UK/Canada/New Zealand 1001 13.7 42.8 (12.0) 49.6 (11.2)
Born in non-English-speaking countries 858 11.7 41.3 (11.4) 47.8 (11.7)
Disease
Diabetes 1043 13.7 42.7 (10.9) < 0.001 50.2 (10.4) < 0.001
Ischaemic heart disease/hypertension 1404 18.5 40.5 (11.5) 49.3 (10.7)
Asthma 792 10.4 42.8 (11.7) 47.7 (11.0)
Two or more conditions 1497 19.7 36.1 (11.3) 47.3 (12.2)
Disease unknown 2870 37.7 46.4 (11.0) 49.9 (10.8)
Overall satisfaction with care
High 2713 36.6 41.6 (12.3) < 0.001 50.4 (11.3) < 0.001
Low 4701 63.4 42.9 (11.5) 48.3 (11.0).
Notes:
Unknowns were: Gender = 188, Age = 204, Health Status = 197, Home ownership = 211, Education = 260, Employment = 212, Marital status =
200, Country of birth = 273 and overall satisfaction = 192.
P-values are for comparison of component scores for categories of each characteristics using analysis of variance.
Patient characteristics were collected independently using GPAS
22
for the same respondents.
Health and Quality of Life Outcomes 2009, 7:50 />Page 5 of 11
(page number not for citation purposes)
regression coefficients were significant (Table 3) and they
showed a significant improvement to the model without
the interaction.
Significance of parameters
Parameter estimates were tested by the t value, determined
by dividing the estimated coefficients by their standard
errors (Table 3) [29]. Because the two models were nested,
we used -2 log likelihood, known as the "change in the
deviance", which has a chi-square distribution to test
whether the difference between the two models was statis-
tically significant (Table 4).
Variance explained at each level
The baseline variance component model explained how
the total variance was partitioned into variance between
patients and practices (Table 4). The variance explained
was estimated using the baseline model and main model
[31]. Differences in the modeled variance indicate how
much better a model can account for the variance at a spe-
cific level [32]. The formulas to calculate the proportion of
variance explained are given by Snijders and Bosker [31]
and Sixma et al. [32].
Results
There were 7606 of 12544 patient questionnaires
returned (61% return rate). We conducted analyses com-
paring proportions of respondents with non-respondents
for gender and age (available for 90% and 84% of non-
respondents respectively). The gender of respondents
(53.3% were females) and non-respondents (53.6% were
females) were similar (P = 0.76). Twenty percent of non-
respondents were younger than 40 years, compared to
10% of respondents and 14% of the total sample (P <
0.001). The mean age of respondents and non-respond-
ents was 59.1 (SD = 15.0) and 55.3 years (SD = 17.8)
respectively. Data completeness was excellent for all SF-12
items, with less than 1.6% of respondents not responding
to each question apart from the question about "climbing
stars" which 2.1% did not complete.
Factor analysis
Factor analysis suggested a two-factor solution (Table 2).
These two factors account for approximately 68.1% of the
variance in the twelve items of the SF-12.
Correlations between physical and mental summary
scores were very low with 0.054 (principal components
analysis with the varimax rotation gives uncorrelated fac-
tors). The overall mean of PCS-12 and MCS-12 of these
chronically-ill respondents were 42.4 (SD = 11.8) and
49.1 (SD = 11.1) respectively.
Table 1 shows the characteristics of respondents and prac-
tices (independent variables). Almost one-half of the
respondents were patients from large practices and 40% of
respondents were from rural areas. The mean age was 60
years (range 18–96). The majority (53%) was female and
nearly 80% owned their own homes. Only 34% of
respondents were employed and 40% were retired. Sev-
enty-four per cent were born in Australia, 14% in USA,
UK, Canada or New Zealand and the remaining 12% in
non-English-speaking countries.
The multilevel regression included only data from the
questionnaires for which information on all relevant var-
Table 2: Scores and rotated factor loadings for items SF-12 scales
Scale Desciption of items Lowest possible score
% (No.)
Highest possible score
% (No.)
Mean
(SD)
Factor structure
Factor 1 Factor 2
PF* Health limited in moderate activities 17.1 (1294) 48.0 (3638) 2.31 (0.74) 0.85 0.14
PF* Health limit climbing stairs 25.5 (1916) 35.8 (2689) 2.10 (0.78) 0.82 0.09
RP Accomplished less because of physical health 6.9 (525) 31.0 (2352) 3.57 (1.25) 0.84 0.30
RP Limited in the kind of work 7.3 (551) 33.3 (2517) 3.62 (1.26) 0.87 0.27
BP Pain interfered with activities 3.7(279) 35.6(2701) 3.74 (1.21) 0.71 0.30
GH Health in general 5.4(411) 3.0(231) 3.13 (1.04) 0.67 0.33
MH Felt calm and peaceful 3.5 (262) 10.5 (793) 3.50 (0.95) 0.10 0.78
MH Felt downhearted and depressed 2.0 (151) 36.7 (2782) 3.93 (1.03) 0.07 0.83
RE Accomplished less due to emotional problems 3.7 (277) 45.5 (3450) 3.97 (1.15) 0.39 0.78
RE Did work less careful than usual due to emotional
problems
3.0 (228) 48.8 (3691) 4.07 (1.10) 0.40 0.73
SF Emotional problems/physical health interfered with
social activities
3.0(229) 50.0 (3797) 4.04 (1.14) 0.46 0.68
VT Lot of energy 9.4 (711) 4.2 (317) 3.00 (1.03) 0.55 0.49
Extraction method: Principal Component Analysis. Rotation method: Varimax with Kaiser Normalization. Rotation converged in 3 iterations.
*Two items of PF are three point scale (from 1 to 3) and all the other items are five point scale (from 1 to 5).
Figures for 12 items do not include missing values which range from 1.1% to 1.6% except for the question about "climbing stars" with 2.1% missing
values.
Higher loadings of each item on a factor are indicated in bold text.
Health and Quality of Life Outcomes 2009, 7:50 />Page 6 of 11
(page number not for citation purposes)
Table 3: Estimates of regression coefficient of multilevel regression analysis for practice and patient characteristics (number of
patients = 6997; number of practices = 96)
Parameters (reference category) Estimate for the main model
Physical components score (PCS-12) Mental components score (MCS-12)
Regression Coefficients (Standard Error) Regression Coefficients (Standard Error)
Patient main effect
Intercept 35.44 33.74
Female patients (male) 2.78 (0.46)
‡
1.54 (0.51)
†
Age, years
40–59 (18–39) -4.65 (0.40)
‡
2.22 (0.44)
‡
>59 (18–39) -7.64 (0.45)
‡
6.02 (0.50)
‡
Good or very good health (very bad, bad or fair health) 10.83 (0.23)
‡
7.34 (0.25)
‡
Owner-occupier (rented) 0.79 (0.29)
†
1.72 (0.32)
‡
College/university (elementary/high School) 1.02 (0.25)
‡
-0.05 (0.28)
Employed patients (unemployed) 7.29 (0.48)
‡
4.81 (0.52)
‡
Retired patients (unemployed) 3.99 (0.48)
‡
3.69 (0.53)
‡
Married/cohabiting (single/separated/divorced/widowed) 0.47 (0.25) 0.63 (0.27)*
Born in Australia (non-English countries) -0.68 (0.35) 1.46 (0.39)
‡
Born in USA/UK/Canada/NZ (non-English countries) 0.23 (0.44) 0.87 (0.48)
Diabetes (two or more conditions) 2.66 (0.37)
‡
1.49 (0.41)
‡
Ischaemic heart disease/hypertension
(two or more conditions)
1.24 (0.34)
‡
0.55 (0.37)
Asthma (two or more conditions) 1.01 (0.42)* 1.42 (0.46)
†
Disease unknown (two or more conditions) 3.83 (0.31)
‡
1.22 (0.34)
‡
Overall satisfaction with care -0.30 (0.23) 1.20 (0.25)
‡
Patient interaction effect
Female × employed -3.46 (0.59)
‡
-3.34 (0.65)
‡
Female × retired -3.34 (0.58)
‡
-1.38 (0.64)*
Practice main effect
Size 1–3 general practitioners (4 or more GPs) -0. 99 (0.27)
‡
-0.55 (0.26)*
Urban (Rural) 0.53 (0.28) 0.16 (0.27)
Note: *P < 0.05,
†
P < 0.01,
‡
P < 0.001
Interactions not shown in the table were not included in the model.
NZ = New Zealand
Patient characteristics were collected independently using GPAS
22
for the same respondents.
Table 4: Estimated variances (and standard errors), percent explained variance and intra-cluster correlations for physical and mental
component scores (number of patients = 6997; number of practices = 96)
Random parameters Estimated variance
Baseline model Full model % Explained variance
Physical component scores
Level 2, Practice variance 4.40 (0.92)
‡
0.60 (0.25)* 72.9
Level 1, Patient variance 135.67 (2.31)
‡
80.07 (1.36)
‡
42.4
Intracluster correlation 0.031 0.007
Deviance 54326.89 50565.05
Mental component scores
Level 2, Practice variance 1.32 (0.43)
†
0.19 (0.21) 49.2
Level 1, Patient variance 121.59 (2.07)
‡
97.0 (1.65)
‡
20.9
Intracluster correlation 0.011 0.002
Deviance 53501.64 51877.94
Note: *P < 0.05,
†
P < 0.01,
‡
P < 0.001
Health and Quality of Life Outcomes 2009, 7:50 />Page 7 of 11
(page number not for citation purposes)
iables was available, resulting in a final sample size of
6997 (92%) patients from 96 practices. Pearson Chi-
Squared tests indicated that proportions of practice size,
practice location, gender and country of birth were similar
between the records used in multilevel analyses and miss-
ing data (data not shown). There were small but signifi-
cant differences between the proportions of records
analyzed and the total (including missing) for other char-
acteristics: 0.7% (age), 0.5% (general health status), 0.3%
(home ownership), 0.4% (education), 0.7% (employ-
ment), 0.3% (marital status) and 0.4% (disease).
Table 3 shows the results of the multilevel regression anal-
yses for each of the response variables.
Patient characteristics including self-rated general health
and chronic medical conditions were collected independ-
ently using GPAS
22
for the same respondents (Table 1).
Patients' assessment of overall satisfaction with care was
also assessed through the GPAS. PCS-12 declined with
age, but in contrast MCS-12 increased with age. Patients
with better self-reported general health status rated both
PCS-12 and MCS-12 higher than those with poor general
health (Table 3). Both self-reported PCS-12 and MCS-12
were positively related to home ownership. Well-educated
patients tended to rate PCS-12 higher than less well-edu-
cated patients, but there was no association with MCS-12.
Patients who were employed or retired were likely to have
higher PCS-12 and MCS-12 than unemployed. Gender
interacted with employment in predicting both PCS-12
and MCS-12 with unemployment being more associated
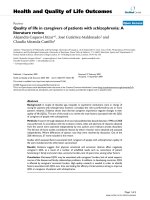
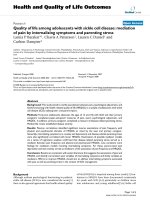
with poorer health in males than in females (Figure 1).
95% confidence intervals for predicted MCS-12 (Mean ± 1.96 SE) by gender and employment statusFigure 1
95% confidence intervals for predicted MCS-12 (Mean ± 1.96 SE) by gender and employment status. Predicted
values were based on the multilevel regression model with interaction between gender and employment status.
Health and Quality of Life Outcomes 2009, 7:50 />Page 8 of 11
(page number not for citation purposes)
Patients who were married or cohabiting tended to have
higher MCS-12 than those who were not. Marital status
did not have any effect on PCS-12. The number of chronic
medical conditions was negatively associated with both
MCS-12 and PCS-12. Results also showed an association
between general satisfaction with care and MCS-12 but
not PCS-12. Patients born in Australia were likely to have
higher MCS-12 than those born in non-English-speaking
countries but country of birth was not associated with
PCS-12.
Patients from smaller general practices (1–3 GPs)
reported lower PCS-12 and MCS-12 compared with those
from larger practices. Practice location had no relation-
ship with either PCS-12 or MCS-12.
Variance components
Ninety seven per cent of the total variance in PCS-12 was
at the patient level, the remaining 3% variance (Intra-clus-
ter correlation (ICC) = 0.03) was at the practice level. For
MCS-12, the corresponding figures were 99% at patient
level and 1% (ICC = 0.01) at practice level (baseline
model in Table 4). At the patient level (level 1) 42% and
21% of the variance respectively among patients for PCS-
12 and MCS-12 were explained by the independent varia-
bles used in the analysis (Table 4). At the practice level
(level 2), 73% and 49% of the variance among practices
for PCS-12 and MCS-12 were explained by the variables
used in the analysis (Table 4).
Discussion
The SF-12 is a subjective measure of health that can be
influenced by a respondent's perceptions, expectations
and interpretations about health [12]. Nonetheless, the
scale has become one of the most widely used HRQOL
measures. This study provides the first comprehensive
data on physical and mental health of chronically-ill
patients in Australia.
While 103 Divisions of General Practice were approached
to participate in recruiting practices to the study, only 27
Divisions agreed to participate and there were no remote
area practices in the sample. Practices that volunteered to
participate may not be representative of all practices
within Australia or within the participating Divisions.
However, the proportion of practices that were solo, or
large (4 or more GPs) was similar to that reported in other
studies [33]. Patients that the practice identified as being
unable to read English were excluded from the study.
Although the response rate of 61% was comparable with
other studies [30], it is possible that some of those not
responding may have had different views of their physical
and mental health from those who responded. For exam-
ple, 20% of non-respondents were younger than 40 years
compared with 10% of respondents. These younger non-
respondents would have primarily have had a diagnosis of
asthma. We adjusted for these differences in distribution
between the total sample (14% from 18–39 age group)
and respondents by giving greater weight to younger
respondents. The results showed the mean difference
between unadjusted and adjusted was 0.51 for PCS-12 (P
< 0.05) and 0.31 for MCS-12 (P > 0.05). Finally there may
have been other practice and patient factors important to
patient HRQOL assessments such as patient co-payments
and availability which were not specifically measured in
this study and warrant further exploration in the Austral-
ian context.
It is recommended that standard US-derived scoring of
the SF-12 summary scores (scores with a mean of 50 and
standard deviation of 10 in the U.S. general population)
can be compared and interpreted across countries [19].
For example, the average unadjusted PCS-12 (42.7) and
MCS-12 (50.2) for type 2 diabetes patients were consist-
ent with those of Canadian (PCS_12 = 42.0 and MCS-12
= 48.5) type 2 diabetes patients (Table 1) [34]. The overall
mean of PCS-12 (42.4, SD = 11.8) and MCS-12 (49.1, SD
= 11.1) of chronically-ill patients in the study were less
than those of U.S. general population (mean = 50, SD =
10). The difference for PCS-12 was clinically significant
with effect size of 0.69 and that for MCS-12 was not clin-
ically significant (effect size = 0.09). The effect size of
more than 0.5 is considered to be clinically significant [8].
The difference between the PCS-12 in this study and that
of the Australian general population (PCS-12 = 50.9, SD =
8.7) [35] was clinically significant (effect size = 0.82).
However, the difference between the MCS-12 and that of
the general population (MCS-12 = 50.3, SD = 9.9) was
clinically not significant (effect size = 0.11) [35].
We also examined ceiling (highest possible score) or floor
effects (lowest possible score) of 12 items and their load-
ings on each factor. All floor effects were < 15% except for
two PF items with the limited answering options (both
items are on a 3-point scale) but ceiling effects for some
items (item/items of PF, RP, BP, RE and SF) were >15%.
Such ceiling effects are seen in both the SF-36 [36] and SF-
12 [37]. Large ceiling effects are undesirable because they
reduce scale sensitivity [36]. Ceiling or floor effects were
less than 0.04% for both PCS-12 and MCS-12. VT and SF
were the most confounded in PCS-12 and MCS-12 (Table
2). Principal component scores offer a solution to this
confounding.
The practice level variance for PCS-12 was small but sig-
nificant even after adjustment for patient and practice
characteristics which supports the choice of multilevel
analysis. That of MCS-12 was not significant after adjust-
ment. The large patient level variance is consistent with
other studies [14,30]. This suggests that most of the differ-
Health and Quality of Life Outcomes 2009, 7:50 />Page 9 of 11
(page number not for citation purposes)
ences between patients may be related to patient selection
rather than differences in the care provided by practices.
There was a negative effect of size of practice on both PCS-
12 and MCS-12 that may reflect the decreased continuity
of care provided in larger practices and patients with poor
health may have self-selected smaller practices for better
continuity of care [38]. Most of the variance in both PCS-
12 and MCS-12 was related to patient level factors such as
age, socio-economic status and ethnicity. Socio-economic
status was measured by employment, home ownership
and education. The effects of home ownership and educa-
tion were clinically not significant (effect size < 0.5), but
the effect of employment was clinically significant for
PCS-12. Further studies of this type are required to iden-
tify other variables that explain the variance in MCS-12.
By contrast practice size and other independent variables
explained most of the practice level variance in both PCS-
12 and MCS-12.
Our finding that PCS-12 was lower in older age while
MCS-12 was higher in older age groups is consistent with
previous research [7,9,11,14,18,39]. In clinical practice
this underlines the importance of looking for psychologi-
cal distress in association with chronic illnesses such as
hypertension/ischaemic heart disease, diabetes and
asthma, and in younger age groups and unemployed.
Consistent with other research, lower socio-economic
groups reported lower PCS-12 and MCS-12 [7,11,14]. Our
previous research indicated that while Australian general
practitioners working in low income areas provided fewer
long consultations, other markers of process of care for
diabetes were better [40,41]. Thus while the socio-eco-
nomic gap in HRQOL may not be attributable to differ-
ences in quality of general practice care, it does suggest
that greater effort is needed to improve outcomes for low
socio-economic chronically-ill patients and that GPs
working with these patients may require additional sup-
port such as practice nurses or allied health providers.
People from non-English-speaking backgrounds had
lower MCS-12 but not PCS-12. Again this is consistent
with other research [7,9]. We do not have information on
the circumstances of patient migration (especially the pro-
portion who were refugees), however it is possible that the
worse mental health may have been due to acculturation
issues. Patients from non-English-speaking backgrounds
were also less satisfied with their care [38].
Some studies have shown a significant interaction effect
between gender and employment indicating employed
men enjoy higher levels of general well-being [15,28]. In
this study there was an interaction between gender and
employment status with the negative impact of unem-
ployment being greater in male than female patients.
Male employed respondents were likely to have higher
physical and mental health than unemployed males
(large effect sizes of 1.37 and 0.70 for PCS-12 and MCS-
12 respectively). The effect of employment was less on
females. This may be because the significance of work and
its impact on household income may be greater in chron-
ically-ill older men than in women [27]. The 'unem-
ployed' category in our study included people who were
unable to work due to sickness or disability (11% of males
and 7% of females) and looking after family or home (1%
of males and 19% of females). Probably, this might
explain some of the interaction.
Policy and practice implications
Based on the results of the analysis reported here, the SF-
12 and its component scales appear to be valid and useful
tools to use in identifying differences in quality of life of
the chronically-ill Australian population on the basis of
social determinants of health [7]. Known group compari-
sons based upon differences in general health, age, socio-
economic status, and number of medical conditions
yielded support for the construct validity of the SF-12 in
this data [8,10,42]. Further, our data showed an associa-
tion between general satisfaction with care or marital sta-
tus with mental health but not with physical health
confirming the results of previous studies [43-45]. In our
sample it appeared that the dimensions were discrimina-
tive enough to distinguish between respondents with a
single illness and with two or more illnesses or low and
high socio-economic status or younger and older
respondents. Further, there was strong association
between SF-12 summary scores and self-rated general
health status collected independently using GPAS for the
same respondents (clinically significant large effect sizes
of 1.27 and 0.79 for PCS-12 and MCS-12 respectively).
This ability to discriminate between groups means that
clinicians can use scores better to understand the func-
tional status and health care needs of at-risk subgroups,
and also enables policy makers to measure clinical effec-
tiveness [10]. The ability to detect previously hypothe-
sized differences or associations between variables
showed the construct validity of SF-12 in Australia [6].
Further, the results suggest that the SF-12 has construct
validity when applied to an Australian primary care pop-
ulation with chronic illness.
Conclusion
The strong association between patient characteristics
such as socio-economic status, age, and ethnicity and SF-
12 physical and mental component summary scores
underlines the importance of considering these factors in
the management of chronically-ill patients in general
practice and adjusting for them in the assessment of the
performance of practices. The SF-12 appears to be a valid
Health and Quality of Life Outcomes 2009, 7:50 />Page 10 of 11
(page number not for citation purposes)
measure for assessing HRQOL of Australian chronically-
ill patients.
List of abbreviations
BP: Bodily Pain; GH: General Health; GP: General Practi-
tioner; GPAS: General Practice Assessment Survey;
HRQOL: Health-Related Quality of Life; ICC: Intra-Clus-
ter Correlation; MCS: Mental Health Component Sum-
mary; MCS-12: Mental Component Score derived from
the SF-12; MH: Mental Health; PCS: Physical Component
Summary; PCS-12: Physical Component Score derived
from the SF-12; PCS-36: Physical Component Score
derived from the SF-36; PF: Physical Functioning; RE: Role
Emotional; RP: Role Physical; RRMA: Rural, Remote and
Metropolitan Area; SD: Standard Deviation; SF: Social
Functioning; SF-12: Short Form 12-item Health Survey;
SF-36: Short Form 36-item Health Survey; VT: Vitality.
Competing interests
The authors declare that they have no competing interests.
Authors' contributions
UJ contributed to data analysis, interpreting the data and
drafting the manuscript. UJ and MH made substantial
contributions to conception and design of the study. JP,
CA, CH were involved in the data collection. All authors
were involved in drafting the manuscript or revising it crit-
ically for important intellectual content. All authors have
read and approved the final version of the manuscript.
Acknowledgements
This study was funded by the Australian Department of Health and Ageing.
The Department of Health and Ageing was not involved in the study design,
data collection, analysis or interpretation, and had no influence on the writ-
ing and submission of this article. The investigators would like to thank the
participating patients, and general practices and their staff, and the partici-
pating Divisions of General Practice for their assistance in recruiting prac-
tices and assisting practices with the feedback provided to them. We would
also like to thank other members of the PRACCAP study group, Jane
Grimm, Edward Swan, and Tanya Bubner for their valuable contribution
and Dr. Sarah Dennis for her comments. Our thanks also go to Sheryl
Scharkie, Roy Batterham, Heidi DePaoli and Robyn Alexander for their
assistance with data collection. JP is grateful to the National Health and
Medical Research Council (Program Grant 510135) for salary support.
References
1. Australian Institute of Health and Welfare: Chronic disease and
associated risk factors in Australia. 2006 [http://
www.aihw.gov.au/publications/phe/cdarfa06/cdarfa06.pdf]. Canberra:
AIHW
2. Australian Institute of Health and Welfare: Chronic diseases and
associated risk factors in Australia. Canberra: AIHW; 2001.
3. Britt H, Miller G, Knox S, Charles J, Valenti L, Pan Y, Henderson J,
Bayram C, O'Halloran J, Ng A: General Practice Activity in Aus-
tralia 2003–4. 2004 [ />gpaa03-04/gpaa03-04.pdf]. Canberra: Australian Institute of Health
and Welfare
4. Commonwealth Department of Health and Aged Care (CDoHaA):
Enhanced primary care program. 2007 [http://
www.health.gov.au/internet/main/publishing.nsf/Content/
Enhanced+Primary+Care+Program-1].
5. Harris MF, Zwar N: Care of patients with chronic disease: the
challenge for general practice. MJA 2007, 187:104-107.
6. Jenkinson C, Chandola T, Coulter A, Bruster S: An assessment of
the construct validity of the SF-12 summary scores ethnic
groups. J Public Health Med 2001, 23:187-194.
7. Burdine JN, Felix MRJ, Abel AL, Wiltraut CJ, Musselman YJ: The SF-
12 as a Population Health Measure: An Exploratory Exami-
nation of Potential for Application. Health Serv Res 2000,
35:885-904.
8. Lim LLY, Fisher JD: Use of the 12-item Short-Form (SF-12)
Health Survey in an Australian heart and stroke population.
Qual Life Res 1999, 8:1-8.
9. Fleishman JA, Lawarence WF: Demographic Variation in SF-12
Scores: True Differences or Differential Item Functioning.
Med Care 2003, 41(Suppl 7):III-75-III-86.
10. Lubetkin EI, Jia H, Gold MR: Use of the SF-36 in Low-Income
Chinese American Primary Care Patients. Med Care 2003,
41:447-457.
11. Fone D, Dunstan F, Lloyd K, Williams G, Watkins J, Palmer S: Does
social cohesion modify the association between area income
deprivation and mental health? A multilevel analysis. Int J Epi-
demiol 2007, 36:338-345.
12. Keles H, Ekici A, Ekici M, Bulcun E, Altinkaya V: Effect of chronic
diseases and associated psychological distress on heath-
related quality of life. Internal Medicne Journal 2007, 37:6-11.
13. Ferrer RL, Palmer R: Variation in health status within and
between socioeconomic strata. J Epidemiol Community Health
2004, 58:381-387.
14. Wainwright NWJ, Surtees PG: Places, people, and their physical
and mental functional health. J Epidemiol Community Health 2003,
58:333-339.
15. Lennon MC: Sex Differences in Distress: The Impact of Gen-
der and Work Roles. J Health Soc Behav 1987, 28:290-305.
16. Hodacre AL, Keane M, Kaulcy E, Moretti C: Making the connec-
tions. In Report of the 2004–2005 Annual Survey of Divisions of General
Practice Adelaide: Primary Health Care Research & Information Serv-
ice; 2006.
17. Ware JEJ, Kosinski M, Turner-Bowker DM, Gandek B: How to
Score Version 2 of the SF-12 Health Survey (With a supple-
ment Documenting Version 1). Lincoln, RI: QualityMetric Incor-
porated; 2002.
18. Schofield MJ, Mishra G: Validity of the SF-12 Compared with the
SF-36 Health Survey in Pilot Studies of the Australian Longi-
tudinal Study on Women's Health. Journal of Health Psychology
1998, 3:259-271.
19. Gandek B, Ware JE, Aaronson NK, Apolone G, Bjorner JB, Brazier JE,
Bullinger M, Kaasa S, Leplege A, Prieto L, Sullivan M: Cross-Valida-
tion of Item Selection and Scoring for the SF-12 Health Sur-
vey in Nine Countries: Results from the IQOLA Project. J Clin
Epidemiol 1998, 51:1171-1178.
20. Sanderson K, Andrews G: The SF-12 in the Australian popula-
tion: cross-validation of item selection. Aust N Z J Public Health
2002, 26:343-345.
21. Wilson D, Tucker G, Chittleborough C: Rethinking and rescoring
the SF-12. Soz Praventivmed. 2002, 47(3):172-177.
22. National Primary Care Research and Development Centre: Manual:
General Practice Assessment Survey (GPAS) Version 2. Man-
chester: University of Manchester; 2001.
23. Bower P, Mead N, Roland M: What dimensions underlie patient
responses to the General Practice Assessment Survey? A
factor analytic study. Fam Pract 2002, 19:489-495.
24. Australian Department of Primary Industries and Energy: Rural,
Remote and Metropolitan Areas (RRMA) Classification.
Canberra: DPIE; 1994.
25. Macintyre S, Ellaway A, Der G, Ford G, Hunt K: Do housing tenure
and car access predict health because they are simply mark-
ers of income of self esteem? A Scottish study. J Epidemiol Com-
munity Health 1998, 52:657-664.
26. Kontodimopoulos N, Pappa E, Niakas D, Tountas Y: Validity of SF-
12 summary scores in a Greek general population. Health
Qual Life Outcomes. 2007, 5:55.
27. Stolzenberg RM: It's about Time and Gender: Spousal Employ-
ment and Heath. AJS 2001, 107:
61-100.
28. Artazcoz L, Benach J, Borrell C, Cortes I: Unemployment and
Mental Health: Understanding the Interactions Among Gen-
Publish with BioMed Central and every
scientist can read your work free of charge
"BioMed Central will be the most significant development for
disseminating the results of biomedical research in our lifetime."
Sir Paul Nurse, Cancer Research UK
Your research papers will be:
available free of charge to the entire biomedical community
peer reviewed and published immediately upon acceptance
cited in PubMed and archived on PubMed Central
yours — you keep the copyright
Submit your manuscript here:
/>BioMedcentral
Health and Quality of Life Outcomes 2009, 7:50 />Page 11 of 11
(page number not for citation purposes)
der, Family Roles, and Social Class. Am J Public Health 2004,
94:82-88.
29. Rasbash J, Steele F, Browne W, Prosser B: A user's guide to
MLwiN version 2.0. In Centre for multilevel modelling Bristol: Univer-
sity of Bristol; 2005.
30. Fone DL, Lloyd K, Dunstan FD: Measuring the neighbourhood
using UK benefits data: a multilevel analysis of mental heath
status. BMC Public Health 2007, 7:69.
31. Snijders TAB, Bosker RJ: Multilevel Analysis: An introduction to basic and
advanced multilevel modeling London: Sage Publications; 1999.
32. Sixma HJ, Spreenwenberg PM, Pasch MA Van der: Patient satisfac-
tion with the general practitioner: a two-level analysis. Med
Care 1998, 36:212-229.
33. Commonwealth Department of Health and Aged Care: General Prac-
tice in Australia Canberra: DoHA; 2000.
34. Johnson JA, Maddigan SL: Performance of the RAND-12 and SF-
12 summary scores in type 2 diabetes. Qual Life Res 2004,
13:449-456.
35. Windsor TD, Rodgers B, Butterworth P, Anstey KJ, Jorm AF: Meas-
uring physical and mental health using the SF-12: implica-
tions for community surveys of mental health. Aust N Z J
Psychiatry 2006, 40:797-803.
36. Wyrwich KW, Nienaber NA, Tierney WM, Wolinsky FD: Linking
Clinical Relevance and Statistical Significance in Evaluating
Intra – Individual Changes in Health – Related Quality of Life.
Med Care 1999, 37:469-478.
37. Larson CO, Schlundt D, Patel K, Beard K, Hargreaves M: Validity of
the SF-12 for use in a low-income African American commu-
nity-based research initiative (REACH 2010). Prev Chronic Dis
2008, 5(2):A44.
38. Jayasinghe UW, Proudfoot J, Holton C, Powell Davies G, Amoroso C,
Bubner T, Beilby J, Harris MF: Chronically ill Australians' satis-
faction with accessibility and patient-centredness. Int J Qual
Health Care 2008, 20:105-114.
39. Mishra G, Schofield MJ: Norms for the physical and mental
health component summary scores of the SF-36 for young,
middle aged and older Australian women. Qual Life Res 1998,
7:215-220.
40. Furler JS, Harris E, Chondros P, Powell Davies PG, Harris MF, Young
DYL: The inverse care law revisited: impact of disadvantaged
location on accessing longer GP consultation times. Med J
Aust 2002, 177:80-83.
41. Georgiou A, Burns J, Harris MF: GP Claims for completing dia-
betes 'cycle of care'. Aust Fam Physician 2004, 33:755-757.
42. Alexander M, Berger W, Buchhloz P, Walt J, Burk C, Lee J, Arbuckle
R, Abetz L: The reliability, validity, and preliminary represent-
atives of the Eye Allergy Patient Impact Questionnaire
(EAPIQ). Health and Quality of Life Outcomes 2005, 3:67.
43. Marshall GN, Hays RD, Rand RM: Health status and satisfaction
with health care: Results from the Medical Outcome Study.
J Consult Clin Psychol 1996, 64:380-390.
44. Johnson JA, Coons SJ, Hays RD, Pickard AS: Health status and sat-
isfaction with pharmacy services. Am J Manag Care. 1999,
5(2):163-170.
45. Sherbourne CD, Hays RD: Marital status, social support, and
health transitions in chronic disease patients. J Health Soc
Behav 1990, 31:328-343.