báo cáo hóa học: " One-year health-related quality of life outcomes in weight loss trial participants: comparison of three measures" ppt
Bạn đang xem bản rút gọn của tài liệu. Xem và tải ngay bản đầy đủ của tài liệu tại đây (340.46 KB, 10 trang )
BioMed Central
Page 1 of 10
(page number not for citation purposes)
Health and Quality of Life Outcomes
Open Access
Research
One-year health-related quality of life outcomes in weight loss trial
participants: comparison of three measures
Ronette L Kolotkin*
1,2
, Josephine M Norquist
3
, Ross D Crosby
4,5
,
Shailaja Suryawanshi
6
, Pedro J Teixeira
7
, Steven B Heymsfield
6
,
Ngozi Erondu
6
and Allison M Nguyen
3
Address:
1
Obesity and Quality of Life Consulting, 762 Ninth Street #563, Durham, North Carolina 27705, USA,
2
Department of Community and
Family Medicine, Duke University Medical Center, 318 Hanes House, Box 2914, Durham, North Carolina 27710, USA,
3
Merck Research
Laboratories, UG1D-60, PO Box 1000, North Wales, Pennsylvannia 19454, USA,
4
Neuropsychiatric Research Institute, 120 Eighth Street South,
PO Box 1415, Fargo, North Dakota 58107, USA,
5
University of North Dakota School of Medicine and Health Sciences, 1919 Elm Street North,
Room 118, Fargo, North Dakota 58102, USA,
6
Merck Research Laboratories, 126 E Lincoln Avenue, Rahway, New Jersey 07065, USA and
7
Faculdade de Motricidade Humana, Estrada da Costa, 1495-688 Cruz Quebrada, Portugal
Email: Ronette L Kolotkin* - ; Josephine M Norquist - ;
Ross D Crosby - ; Shailaja Suryawanshi - ; Pedro J Teixeira - ;
Steven B Heymsfield - ; Ngozi Erondu - ; Allison M Nguyen -
* Corresponding author
Abstract
Background: The literature on changes in health-related quality of life (HRQOL) in weight loss studies is inconsistent,
and few studies use more than one type of measure. The purpose of the current study was to compare one-year changes
in HRQOL as a function of weight change using three different measures: a weight-related measure (Impact of Weight
on Quality of Life-Lite [IWQOL-Lite)]) and two generic measures (SF-36; EQ-5D).
Methods: Data were obtained from 926 participants (mean Body Mass Index (BMI) (kg/m
2
) = 35.4; 84% female; mean
age = 49.5 years) in a placebo-controlled randomized trial for weight loss. At baseline and one-year, participants
completed all three HRQOL measures. HRQOL was compared across weight change categories (≥ 5% and 0–4.9% gain,
0–4.9%, 5.0–9.9% and ≥ 10% loss), using effect sizes.
Results: The weight-related measure of HRQOL exhibited greater improvements with one-year weight loss than either
of the generic instruments, with effect sizes ranging from 0.24 to 0.62 for 5–9.9% weight reductions and 0.44 to 0.95 for
≥ 10% reductions. IWQOL-Lite Self-Esteem also showed a small improvement with weight gain. Changes in the two
generic measures of HRQOL were inconsistent with each other, and in the case of the SF-36, variable across domains.
For participants gaining ≥ 5% of weight, the greatest reductions in HRQOL occurred with respect to SF-36 Mental Health,
MCS, and Vitality, with effect sizes of -0.82, -0.70, and -0.63 respectively.
Conclusion: This study found differences between weight-related and generic measures of health-related quality of life
in a one-year weight loss trial, reflecting the potential value of using more than one measure in a trial. Although weight
loss was generally associated with improved IWQOL-Lite, physical SF-36 subscale and EQ-5D scores, a small amount of
weight gain was associated with a slight improvement on weight-specific HRQOL and almost no change on the EQ-5D,
suggesting the need for further research to more fully study these relationships. We believe our findings have relevance
for weight loss patients and obesity clinicians/researchers in informing them of likely HRQOL outcomes associated with
varying amounts of weight loss or gain.
Published: 9 June 2009
Health and Quality of Life Outcomes 2009, 7:53 doi:10.1186/1477-7525-7-53
Received: 16 March 2009
Accepted: 9 June 2009
This article is available from: />© 2009 Kolotkin et al; licensee BioMed Central Ltd.
This is an Open Access article distributed under the terms of the Creative Commons Attribution License ( />),
which permits unrestricted use, distribution, and reproduction in any medium, provided the original work is properly cited.
Health and Quality of Life Outcomes 2009, 7:53 />Page 2 of 10
(page number not for citation purposes)
Background
There is growing interest in assessing patient-reported out-
comes (PRO) in clinical trials along with more traditional
clinical primary endpoints. One type of PRO, health-
related quality of life (HRQOL), may be assessed using
either generic measures that are applicable to any popula-
tion or measures specific to the disease under study. In the
weight loss literature, HRQOL outcomes have been
reported using both types of measures.
Generic and disease-specific measures of HRQOL each
have their advantages and disadvantages. Generic meas-
ures are applicable to any population and scores may be
compared to general population norms as well as across
diseases. Disease-specific measures contain items of par-
ticular relevance to patients with the disease, and as such,
have inherent face validity and salience. Additionally, dis-
ease-specific measures have the potential to be more sen-
sitive to smaller differences between groups and smaller
changes over time than generic measures, because of their
specificity [1].
A meta-analysis [2] of 54 cross-sectional studies of obese
persons seeking or not seeking various weight loss treat-
ments focused only on studies that used the generic Med-
ical Outcomes Study Short Form-36 (SF-36) [3] or the
weight-related Impact of Weight on Quality of Life-Lite
(IWQOL-Lite) [4]. These authors found larger differences
among populations (i.e. general population, non-treat-
ment-seeking obese, conservative-treatment-seeking
obese, and bariatric surgery patients) for the IWQOL-Lite
than the SF-36. After adjusting for weight, the population
differences disappeared for the IWQOL-Lite, but
remained for the SF-36. In our own work with over 10,000
subjects who have taken the IWQOL-Lite, differences
across populations remain after controlling for BMI [5].
Differences between our findings and those from the van
Nunen et al meta-analysis could be partially due to differ-
ences in statistical methods. That is, the unit of analysis in
a meta-analysis is the study, whereas the unit of analysis
in a single study is the individual.
A review of HRQOL outcomes in 34 randomized control-
led trials for weight loss interventions indicated inconsist-
encies across studies, with varying types of measures used,
diverse assessment points, and differing outcomes [6].
Even when the same measure was used – for example, the
SF-36 – positive treatment effects were shown for some
domains, but not others, and these domains varied across
studies. When obesity-specific measures were used, a
greater percentage of the trials showed improved HRQOL
[6]. Since nearly all the weight loss trials used only one
type of HRQOL instrument, the opportunity to compare
changes in generic vs. obesity-specific measures within a
single trial was limited. In a 4-month trial Kaukua and col-
leagues [7] administered both the SF-36 and an obesity-
specific measure [Obesity-Related Psychosocial Problems
scale (OP Scale) [8]] to a group of men randomized to a
very-low-energy diet plus behavior modification or a wait
list control group. Improvements on two of the SF-36
domains (physical and social functioning) and the OP
Scale were maintained until the end of follow-up for the
treated subjects. In a case-controlled study by Karlsson et
al [9], both generic (Sickness Impact Profile) and obesity-
specific (OP Scale) HRQOL improved after gastric restric-
tion surgery. However, changes in the OP Scale were also
significant for women, but not men, in the control group.
Thus, the current literature on changes in HRQOL in
weight loss studies is inconsistent, and few studies use
more than one type of measure within a single study. The
purpose of the current study was to compare HRQOL out-
comes over a one-year time period as a function of weight
change in a weight loss clinical trial using three different
measures of HRQOL: IWQOL-Lite, SF-36, and EQ-5D
[10]. We are aware of no other studies that used these par-
ticular measures in a single weight loss trial.
Methods
Participants
Data were obtained from adults who participated in a
one-year randomized, placebo-controlled trial of an
experimental medication for weight loss (trial number
PN011). Quorum Review, Inc. (Seattle, Washington), an
independent institutional review board, approved the
study, and informed consent was obtained from all partic-
ipants. All research was conducted in compliance with the
Helsinki Declaration. For inclusion in the trial patients
had to be at least 18 years old and meet the following cri-
teria: body mass index (BMI) between 30–43 kg/m
2
, or
BMI ≥ 27 kg/m2 with obesity-related comorbidities, stable
weight for three months prior to screening, and the ability
to read and understand questionnaires. All participants
providing baseline and year-one HRQOL data were
included in the present analysis.
Procedures
Full details of the study have been described previously
(e.g. recruitment, retention, institutional review) [11].
Prior to randomization there was a two-week diet and
exercise run-in during which patients were administered
placebo in a single-blinded manner. Eligible participants
were then randomized in a 2:1 ratio to either the experi-
mental drug group or the placebo group. The patients
were instructed to follow a diet with a 500 kcal/day deficit
in caloric intake, and they received dietary and exercise
counseling. At baseline and at one-year follow-up,
patients completed HRQOL instruments as described
below.
Health and Quality of Life Outcomes 2009, 7:53 />Page 3 of 10
(page number not for citation purposes)
Measures
Impact of Weight on Quality of Life-Lite (IWQOL-Lite)
The IWQOL-Lite is a validated 31-item, self-report meas-
ure of weight-related quality of life that provides a total
score plus scores on five domains (Physical Function, Self-
Esteem, Sexual Life, Public Distress, and Work) [4]. The
IWQOL-Lite has been shown to have good internal con-
sistency (ranging from .90 to .96) [4], good test-retest reli-
ability (.83 to .94) [12], responsiveness to weight loss and
weight gain [13,14], sensitivity to treatment-seeking status
[15,16] and degree of obesity [17], and a scale structure
supported by confirmatory factor analysis [4]. Scores are
transformed to a 0 to 100 scale, where 100 represents the
best HRQOL.
Medical Outcomes Study Short Form Health Survey (SF-36, Version
2.0)
The SF-36 is a widely used survey instrument for assessing
a patient's generic HRQOL [3]. It has been validated in
numerous diseases and used across the world as an indi-
cator of a patient's perception of his or her current health
status. The SF-36 provides scores on eight domains: Phys-
ical Functioning, Role Physical, Bodily Pain, General
Health, Vitality, Social Functioning, Role Emotional, and
Mental Health. In addition, two component scores can be
calculated: the Physical Component Summary (PCS) and
Mental Component Summary (MCS). Scores are trans-
formed to a 0 to 100 scale, where 100 represents the best
HRQOL.
EQ-5D
The EQ-5D is a utility instrument that may be used as a
generic measure of health outcome. Applicable to a wide
range of health conditions and treatments, it provides a
simple descriptive profile and a single index value for
health status that can be used in the clinical and economic
evaluation of health care, as well as population health sur-
veys. The EQ-5D has been specially designed to comple-
ment other quality of life measures such as the SF-36 or
disease-specific measures. [18]. It is composed of five
questions assessing attributes including mobility, self-
care, usual activities, pain/discomfort, and anxiety/
depression.
.
Statistical Analyses
Data from the experimental drug group and placebo
group were pooled for the analyses. This approach was
warranted because no clinically meaningful differences in
efficacy or safety were observed between groups in previ-
ously published analyses [11]. Descriptive statistics
(mean, SD) for the HRQOL measures were calculated at
baseline and week 52. Changes in HRQOL over the 52-
week period were calculated as the difference between
baseline and week-52 scores. Patients were categorized
according to the percent of weight change observed dur-
ing this interval (≥ 5% gain, 0–4.9% gain, 0–4.9% loss, 5–
9.9% loss, and ≥ 10% loss). The purpose of using weight
change categories rather than weight as a continuous var-
iable was to facilitate clinical relevance and interpretation
of the findings. Effect size statistics for each group were
calculated by dividing the 52-week mean change score by
the standard deviation of the corresponding baseline
score. Estimates of 0.2, 0.5 and 0.8 were considered small,
moderate and large, respectively [19]. For each measure
and weight change category, mean change in domain
scores from baseline to one-year were calculated and com-
pared to a reference group using analysis of covariance
controlling for baseline scores. For this analysis, the 0–
4.9% weight loss category was chosen as the reference cat-
egory because weight loss above that threshold (i.e., ≥
5%) is considered a meaningful change from a clinical
perspective [20].
Results
The sample used in these analyses consisted of 926
patients (931 had completed the original 1-year trial [11];
five patients had incomplete HRQOL data and were
dropped from the current analyses). Of these 926
patients, 779 (84%) were women and 727 (79%) were
white. The mean (SD) age in years was 49.5 (11.1) with a
range of 20 to 78 years (Table 1). The average 52-week
weight loss was 2.7% (SD = 6.6, range -28.8% to 21.2%).
The frequencies (%) in the five weight change categories
were:
• ≥ 5% gain: 79 (8.5%)
• 0 to 4.9 gain: 243 (26.2%)
• 0 to 4.9% loss: 323 (34.9%)
• 5 to 9.9% loss: 168 (18.1%)
Table 1: Participant Baseline Characteristics (n = 926)
n (%)
Gender
Female 779 (84%)
Male 147 (16%)
Race
White 727 (78.5%)
Black 108 (11.7%)
Hispanic 72 (7.8%)
Asian 14 (1.5%)
Other 5 (0.5%)
Age (years) [Mean (SD)] 49.5 (11.1)
BMI (kg) [Mean (SD); range] 35.4 (3.8); 27.3–44.1
Health and Quality of Life Outcomes 2009, 7:53 />Page 4 of 10
(page number not for citation purposes)
• ≥ 10% loss: 112 (12.1%)
Baseline and mean one-year changes in IWQOL-Lite
scores by weight change category, and corresponding
effect sizes, are summarized in Table 2. Similar statistics
for the EQ-5D domains and the SF-36 are summarized in
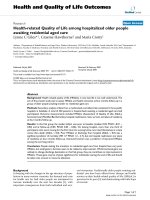
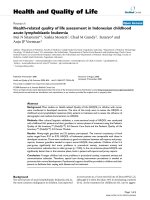
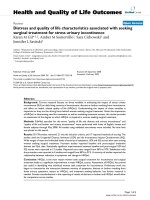
Tables 3 and 4, respectively. For both the IWQOL-Lite and
the EQ-5D, improvements in HRQOL scores were
observed in an increasing trend across the weight change
categories, although effect sizes for the IWQOL-Lite were
much larger (Figure 1). On the IWQOL-Lite a 5.0–9.9%
weight loss was associated with moderate effect sizes on
Physical Function, Self-Esteem, and total score (0.57,
0.58, and 0.62, respectively), and a ≥ 10% weight loss was
associated with large effect sizes on these domains (0.95,
0.95, and 0.93, respectively). Of note, weight gain was
associated with small improvements in IWQOL-Lite Self-
Esteem (effect size of 0.21 for the greater than or equal to
5% weight gain category and 0.34 for the 0 to 4.9% gain
category). However, no such improvements were
observed with weight gain on the EQ-5 D.
A different pattern of results emerged for the SF-36.
Patients in all weight change categories showed deteriora-
Table 2: IWQOL-Lite Scores at Baseline and 1-Year
IWQOL Scores by Weight loss/gain category Baseline Mean (SD) Change
a
Mean (SD) Effect Size
b
Total Score
>= 5% gain (n = 79) 72.1 (16.7) -0.4 (12.4) -0.02
0.1–4.9% gain (n = 243) 73.9 (15.6) 2.7 (11.0) 0.17
0–4.9% loss (n = 323) 74.2 (16.2) 5.5 (10.4) 0.34
5–9.9% loss (n = 164) 74.1 (16.2) 10.0 (11.2) 0.62
≥ 10% loss (n = 111) 71.4 (17.6) 16.4 (13.7) 0.93
Physical Function
>= 5% gain (n = 79) 73.5 (19.6) -4.1 (14.0) -0.21
0.1–4.9% gain (n = 244) 73.8 (18.7) 1.4 (13.8) 0.07
0–4.9% loss (n = 323) 74.2 (17.4) 5.6 (12.5) 0.32
5–9.9% loss (n = 167) 73.2 (19.7) 11.3 (14.5) 0.57
≥ 10% loss (n = 112) 70.5 (19.2) 18.3 (14.5) 0.95
Self Esteem
>= 5% gain (n = 79) 52.0 (24.7) 5.1 (20.6) 0.21
0.1–4.9% gain (n = 243) 56.9 (24.6) 8.4 (18.9) 0.34
0–4.9% loss (n = 323) 57.6 (26.3) 9.8 (16.5) 0.37
5–9.9% loss (n = 166) 58.4 (26.2) 15.3 (18.2) 0.58
≥ 10% loss (n = 112) 56.0 (23.4) 22.3 (18.9) 0.95
Sexual Life
>= 5% gain (n = 76) 76.1 (27.9) -1.7 (20.5) -0.06
0.1–4.9% gain (n = 238) 75.7 (25.7) 0.6 (21.3) 0.02
0–4.9% loss (n = 308) 75.3 (26.1) 5.0 (19.6) 0.19
5–9.9% loss (n = 155) 76.3 (27.7) 8.1 (20.8) 0.29
≥ 10% loss (n = 107) 74.9 (26.6) 14.2 (22.4) 0.53
Public Distress
>= 5% gain (n = 79) 81.3 (19.6) 0.1 (15.9) 0.005
0.1–4.9% gain (n = 243) 85.3 (17.0) 1.3 (12.2) 0.08
0–4.9% loss (n = 323) 85.0 (18.9) 3.6 (12.9) 0.19
5–9.9% loss (n = 166) 85.8 (15.8) 6.0 (11.7) 0.38
≥ 10% loss (n = 111) 81.8 (19.1) 11.7 (17.0) 0.61
Work
>= 5% gain (n = 79) 87.7 (16.1) -0.4 (13.4) -0.02
0.1–4.9% gain (n = 243) 88.4 (15.9) 0.2 (12.6) 0.01
0–4.9% loss (n = 321) 88.0 (15.8) 1.6 (12.4) 0.10
5–9.9% loss (n = 160) 89.3 (14.2) 3.4 (13.5) 0.24
≥ 10% loss (n = 111) 85.8 (19.0) 8.3 (18.0) 0.44
a
Negative changes indicate deterioration; positive changes indicate improvement
b
Based on standard deviation at baseline
Health and Quality of Life Outcomes 2009, 7:53 />Page 5 of 10
(page number not for citation purposes)
tion in MCS scores, ranging from small to moderately
large effects. PCS scores showed very small improvements
associated with a 5–9.9% weight loss and moderate
improvements for patients who experienced a ≥ 10% loss.
Weight gain was associated with very small to small reduc-
tions on PCS scores, but moderate to moderately large
reductions on MCS. With respect to SF-36 subscales, the
greatest improvement associated with weight loss
occurred on Physical Functioning, with a moderate
improvement for patients losing at least 10% of their
weight. Four domains of the SF-36 (Bodily Pain, Social
Functioning, Role Emotional, and Mental Health)
showed deterioration or no change in all weight change
categories. The SF-36 subscales showing the greatest dete-
rioration for a weight gain ≥ 5% were Mental Health and
Vitality (with effect sizes of -0.82, and -0.63 respectively).
Mean subscale score changes from baseline to one-year for
each weight change category were calculated for the three
measures and compared to the reference category of 0–
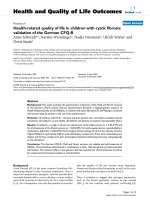
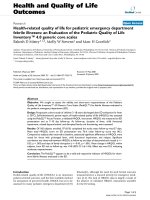
4.9% weight loss. Figure 2 shows mean score differences
between each weight loss category and the reference cate-
gory (0–4.9% loss) for the IWQOL-Lite total score. All
group comparisons were statistically significant (p <
0.05). In other words, both weight gain categories (> = 5%
and 0–4.9% gain) had negative change scores compared
to the reference category, indicating deterioration in
HRQOL, while both weight loss categories (5–9.9% and ≥
10% loss) had positive change scores, indicating improve-
ment in HRQOL over the one-year period. Similar trends
were observed across all 3 HRQOL measures and domains
(data not shown). However, for the SF-36, statistically sig-
nificant differences (p < 0.05) were only observed
between the reference group and the ≥ 10% weight loss
category, except for General Health and Vitality.
Discussion
Consistent with results of a review of randomized control-
led trials for weight loss interventions [6], we observed
greater improvements in the weight-related measure of
HRQOL than in two generic measures in a one-year
weight loss trial. Few weight loss studies have used both
obesity-specific and generic measures to assess HRQOL
outcomes within the same study. Kaukua and colleagues
reported stronger correlations between weight change and
HRQOL change for the OP Scale, an obesity-specific
measure, (r = 0.635) than for SF-36 physical functioning
(r = -0.502) [7].
Results of the two generic measures included in this trial
were inconsistent with each other, and the subscales of the
SF-36 were variable across domains. For the EQ-5D,
weight loss corresponded more closely to HRQOL
changes than did weight gain. Weight change (both loss
and gain) seemed to correspond closely for PCS scores of
the SF-36. Improvements in PCS were greater for the
10+% weight loss category than the 5–9.9% category;
weight gain was associated with small reductions in PCS
that were further reduced by additional weight gain. For
the SF-36 subscales, weight loss was associated with
improvement on some domains, but deterioration or no
change on others. Variability with respect to changes in
HRQOL, both within and across weight loss studies, has
been reported previously [6]. Physical Functioning and
PCS were most responsive to weight loss in the current
study, a finding also reported in some of the weight loss
trials reviewed (e.g. [7,21]). Social Functioning, Role
Emotional, Mental Health, and MCS showed poor corre-
spondence with weight change.
Few studies have explored the effects of weight gain on
HRQOL. Engel and colleagues [14] found that changes in
weight-related HRQOL for participants in a weight loss
trial were similar in degree, but opposite in direction for
weight loss and weight gain. That is, weight loss was asso-
ciated with improved HRQOL and weight gain was asso-
ciated with reduced HRQOL, and these changes occurred
in a linear fashion. Among the individuals who gained 5%
or more of their weight in our study, scores on Mental
Health, MCS, and Vitality showed the greatest deteriora-
tion. Unlike the Engel et al. study, we found improved
weight-related HRQOL for the group that gained 0–4.9%
of their weight and only a slight decrement for the group
that gained 5+% of their weight. Because no generic meas-
ures of HRQOL were used in the Engel et al. study, we can-
not compare that part of our results to theirs. A
prospective cohort study of 40,098 women participating
in the Nurses' Health Study [22] found that women who
Table 3: EQ-5D Scores at Baseline and 1-Year
EQ-5D Scores by Weight loss/gain category Baseline Mean (SD) Change
a
Mean (SD) Effect Size
b
≥ 5% gain (n = 79) 79 (16.8) -1.2 (19.5) -0.07
0.1–4.9% gain (n = 244) 77.8 (17.5) 0.4 (16.2) 0.02
0–4.9% loss (n = 323) 79.5 (14.6) 0.4 (15.1) 0.03
5–9.9% loss (n = 164) 79.6 (14.5) 4.7 (12.6) 0.32
≥ 10% loss (n = 111) 76.8 (16.5) 8.8 (15.7) 0.53
a
Negative changes indicate deterioration; positive changes indicate improvement
b
Based on standard deviation at baseline
Health and Quality of Life Outcomes 2009, 7:53 />Page 6 of 10
(page number not for citation purposes)
Table 4: SF-36 Scores at Baseline and 1 year
SF-36 Scores by Weight loss/gain category Baseline Mean (SD) Change
a
Mean (SD) Effect Size
b
Mental Component Score (MCS)
≥ 5% gain (n = 78) 53.6 (8.0) -5.6 (9.5) -0.70
0.1–4.9% gain (n = 241) 53.9 (6.9) -3.3 (9.3) -0.48
0–4.9% loss (n = 321) 53.7 (7.0) -3.8 (9.0) -0.54
5–9.9% loss (n = 162) 54.4 (6.6) -2.7 (9.2) -0.41
≥ 10% loss (n = 112) 53.3 (7.1) -0.7 (7.8) -0.10
Physical Component Score (PCS)
≥ 5% gain (n = 78) 51.8 (7.1) -1.7 (6.6) -0.24
0.1–4.9% gain (n = 241) 51.6 (6.9) -1.3 (7.4) -0.19
0–4.9% loss (n = 321) 52.0 (5.9) 0.2 (6.6) 0.03
5–9.9% loss (n = 162) 51.0 (7.2) 1.1 (6.4) 0.15
≥ 10% loss (n = 112) 51.0 (6.7) 2.8 (6.8) 0.42
Physical Functioning
≥ 5% gain (n = 79) 84.4 (18.4) -4.8 (17.0) -0.26
0.1–4.9% gain (n = 243) 84.1 (18.7 -2.2 (19.3) -0.12
0–4.9% loss (n = 323) 85.0 (17.0) 1.4 (17.0) 0.08
5–9.9% loss (n = 165) 82.0 (19.8) 2.8 (17.0) 0.14
≥ 10% loss (n = 112) 82.5 (18.3) 8.1 (19.5) 0.44
Role Physical
≥ 5% gain (n = 79) 90.0 (16.2) -7.8 (17.9) -0.48
0.1–4.9% gain (n = 243) 89.4 (18.4) -4.4 (22.9) -0.24
0–4.9% loss (n = 323) 90.8 (16.1) -2.3 (18.8) -0.14
5–9.9% loss (n = 165) 89.2 (17.2) -1.0 (18.9) -0.06
≥ 10% loss (n = 112) 89.2 (17.9) 3.7 (18.2) 0.21
Bodily Pain
≥ 5% gain (n = 79) 79.4 (22.2) -7.7 (24.4) -0.35
0.1–4.9% gain (n = 244) 80.0 (20.4) -7.1 (22.8) -0.35
0–4.9% loss (n = 323) 78.5 (18.8) -4.2 (22.5) -0.22
5–9.9% loss (n = 164) 77.4 (20.8) -2.2 (22.2) -0.11
≥ 10% loss (n = 112) 77.4 (19.6) 1.0 (22.0) 0.05
General Health
≥ 5% gain (n = 78) 78.0 (15.3) -4.9 (10.7) -0.32
0.1–4.9% gain (n = 243) 78.7 (15.2) -4.1 (14.2) -0.27
0–4.9% loss (n = 323) 79.8 (13.7) -3.0 (14.2) -0.22
5–9.9% loss (n = 166) 79.4 (14.2) 0.2 (12.4) 0.01
≥ 10% loss (n = 112) 76.9 (13.3) 4.8 (13.2) 0.36
Vitality
≥ 5% gain (n = 78) 67.9 (18.6) -11.8 (18.1) -0.63
0.1–4.9% gain (n = 243) 66.8 18.2) -6.9 (19.4) -0.38
0–4.9% loss (n = 322) 66.0 (17.8) -4.8 (17.5) -0.27
5–9.9% loss (n = 166) 67.3 (16.1) -0.8 (17.7) -0.05
≥ 10% loss (n = 112) 62.9 (18.1) 5.2 (19.0) 0.29
Social Functioning
≥ 5% gain (n = 79) 90.7 (17.3) -8.7 (19.3) -0.50
0.1–4.9% gain (n = 244) 91.2 (15.9) -5.9 (22.8) -0.37
0–4.9% loss (n = 323) 92.1 (15.4) -5.6 (19.4) -0.36
5–9.9% loss (n = 166) 93.0 (13.6) -3.5 (19.1) -0.26
≥ 10% loss (n = 112) 92.0 (16.7) 0.1 (20.0) 0.006
Health and Quality of Life Outcomes 2009, 7:53 />Page 7 of 10
(page number not for citation purposes)
had gained 5 pounds or more over the course of four years
reported significant impairment in SF-36 Physical Func-
tioning, Vitality, and Bodily Pain. In the present study
these three domains of the SF-36, as well as several others,
exhibited impairments associated with weight gain. As
more of the world's population is gaining weight, a poten-
tial fruitful focus of future investigations is the effect of
weight gain on HRQOL (the current literature focuses on
effects of weight loss and cross-sectional differences
among BMI groups).
Results of this study support the potential value of assess-
ing HRQOL changes in weight loss trials with more than
one instrument. In the best of all worlds we recommend
the use of an assessment battery, the approach taken in
the Swedish Obese Subjects studies [8], since each instru-
ment contributes somewhat different information. How-
ever, we recognize the practical limitations of this
approach in most clinical trials with respect to cost and
respondent burden.
We believe our findings have direct relevance for weight
loss patients and clinicians/researchers who work with
this population. Especially if replicated in other studies of
different weight loss interventions, we can use these
results to inform patients and clinicians/researchers of
Role Emotional
≥ 5% gain (n = 79) 91.5 (15.5) -7.3 (20.4) -0.47
0.1–4.9% gain (n = 243) 93.2 (14.9) -6.2 (22.7) -0.42
0–4.9% loss (n = 322) 93.3 (13.4) -5.6 (18.1) -0.41
5–9.9% loss (n = 163) 94.7 (11.9) -5.7 (19.1) -0.48
≥ 10% loss (n = 112) 94.4 (12.0) -1.9 (15.6) -0.16
Mental Health
≥ 5% gain (n = 78) 82.6 (13.3) -10.9 (16.6) -0.82
0.1–4.9% gain (n = 243) 82.8 (12.9) -5.0 (16.8) -0.39
0–4.9% loss (n = 322) 82.2 (13.1) -6.2 (15.8) -0.47
5–9.9% loss (n = 166) 81.4 (13.7) -3.1 (18.1) -0.23
≥ 10% loss (n = 112) 79.9 (13.9) 0.4 (15.4) 0.03
a
Positive changes indicate improvement; negative changes indicate deterioration
b
Based on standard deviation at baseline
Table 4: SF-36 Scores at Baseline and 1 year (Continued)
Effect sizes by category of weight changeFigure 1
Effect sizes by category of weight change.
Health and Quality of Life Outcomes 2009, 7:53 />Page 8 of 10
(page number not for citation purposes)
what HRQOL changes they can expect to experience with
varying amounts of weight loss or weight gain. For exam-
ple, based on the current findings as well as previous find-
ings [13] we can say with some certainty that weight loss
of at least 5% is most likely to have a positive effect on
weight-related physical function and self-esteem, as well
as cardiovascular risk factors [20]. Knowledge of this
information may serve to keep patients motivated, which
as clinicians and patients are well aware, is frequently a
challenge. On the other hand, knowledge of the likely
adverse effects on HRQOL with increased weight may
serve to reinforce the importance of weight maintenance.
We know from previous research [14] that weight regain
is associated with reduced weight-related HRQOL.
One of the strengths of this study is that we were able to
compare HRQOL changes on three different measures of
HRQOL. Although the SF-36 has been widely used in
weight loss studies [6,23] and the EQ-5D has been studied
with respect to BMI [24,25], this study is unique in its
comparison of three measures of HRQOL outcomes in
weight loss patients. Other strengths of this study include
the large sample size (n = 926) and the longitudinal
design with one-year follow-up assessment on all HRQOL
measures. However, this study is not without limitations.
The current sample was predominantly female (84%) and
Caucasian (79%), limiting generalizability to other
patient populations. Additionally, only a subset of the
sample experienced what might be considered clinically
meaningful weight loss. Only 30% of the sample lost at
least 5% of their baseline weight and only 12% lost at
least 10% of their baseline weight. This limits our ability
to make inferences about HRQOL changes as a result of
more substantial weight loss. On the other hand, having
large variability in weight change, including subjects who
gained weight, should increase the study's external valid-
ity. Another limitation of this study is that only 56% of
the trial participants completed the one-year protocol; it is
unknown in what ways attrition may limit the generaliza-
bility of our findings. In addition, it is unknown whether
the results we observed would generalize to other weight
loss methods and other placebo-controlled trials for dif-
ferent pharmacological agents. Finally, it would be an
over simplification to suggest that changes in HRQOL
depend solely on amount of weight change. Health care
providers and clinical researchers who treat obese individ-
uals recognize that changes in HRQOL could be influ-
enced by a variety of variables not explored in the current
Mean 1-Year change in IWQOL-Lite total score across weight change categories relative to the reference category (0–4.9% loss)Figure 2
Mean 1-Year change in IWQOL-Lite total score across weight change categories relative to the reference cat-
egory (0–4.9% loss).
Health and Quality of Life Outcomes 2009, 7:53 />Page 9 of 10
(page number not for citation purposes)
study, such as initial weight loss expectations, satisfaction
with weight loss results and the treatment program, self-
esteem and other psychological variables, as well as
comorbid health. We lack the data to address the potential
role of these other variables.
Conclusion
Because HRQOL outcomes vary with type of measure,
there is potential value in using more than one instrument
in studies of weight loss interventions. In a one-year
weight loss trial greater improvements were found in the
weight-related measure of health-related quality of life
than two generic measures. There was closer correspond-
ence between weight loss and improvements in HRQOL
for the weight-related measure than the other measures,
but for weight gain this was not the case. Results of the
two generic measures were inconsistent with each other
and, in the case of the SF-36, variable across domains. We
believe the current findings may be relevant for weight
loss patients and obesity clinicians and researchers in that
they can be used to inform expectations regarding
HRQOL and various levels of weight loss or gain.
Abbreviations
HRQOL: Health-related quality of life; PRO: Patient
reported outcomes; IWQOL-Lite: Impact of Weight on
Quality of Life-Lite questionnaire; SF-36: Medical Out-
comes Study Short Form-36; BMI: Body Mass Index; OP
Scale: Obesity-Related Psychosocial Problems scale; PCS:
Physical Component Summary; MCS: Mental Compo-
nent Summary; SD: Standard deviation.
Competing interests
RLK and RDC received consulting fees from Merck
Research Laboratories for their participation in this study.
RLK receives royalties from Duke University for the use of
the IWQOL-Lite. JMN, SS, SBH, NE, and AMN are
employed by Merck Research Laboratories, the sponsor of
this study.
Authors' contributions
RLK had the primary role in drafting the manuscript. All
other authors revised the manuscript for intellectual con-
tent and gave final approval for the current version. RLK,
RDC, and AMN conceived of the analysis design. RDC,
JMN and AMN did the statistical analyses and had the pri-
mary role in drafting the results, tables, and figures. NE
participated in the design and clinical monitoring of the
weight loss study.
Acknowledgements
We do not wish to acknowledge anyone. Merck Research Laboratories was
the sponsor of this study. Dr. Kolotkin and Dr. Crosby received consulting
fees from Merck Research Laboratories for their participation in this study.
Drs. Norquist, Suryawanshi, Heymsfield, Erondu, and Nguyen are
employed by Merck Research Laboratories, the sponsor of this study.
References
1. Hays RD: Generic versus disease-targeted instruments. In
Assessing Quality of Life in Clinical Trials: Methods and Practice Edited by:
Fayers PM, Hays RD. New York: Oxford University Press; 2005.
2. van Nunen AM, Wouters EJ, Vingerhoets AJ, Hox JJ, Geenen R: The
health-related quality of life of obese persons seeking or not
seeking surgical or non-surgical treatment: a meta-analysis.
Obes Surg 2007, 17(10):1357-1366.
3. Ware J, Snow K, Kosinski M, Gandek B: SF-36 Health Survey:
Manual and Interpretation Guide. Boston: The Health Institute,
New England Medical Center; 1993.
4. Kolotkin RL, Crosby RD, Kosloski KD, Williams GR: Development
of a brief measure to assess quality of life in obesity. Obes Res
2001, 9:102-111.
5. Kolotkin RL, Crosby RD: Manual for the Impact of Weight on
Quality of Life Measure (IWQOL and IWQOL-Lite). Dur-
ham, NC: Obesity and Quality of Life Consulting; 2008.
6. Maciejewski ML, Patrick DL, Williamson DF: A structured review
of randomized controlled trials of weight loss showed little
improvement in health-related quality of life. J Clin Epidemiol
2005, 58(6):568-578.
7. Kaukua J, Pekkarinen T, Sane T, Mustajoki P: Health-related qual-
ity of life in WHO Class II-III obese men losing weight with
very-low-energy diet and behaviour modification: a ran-
domised clinical trial. Int J Obes 2002, 26(4):487-495.
8. Sullivan M, Karlsson J, Sjostrom L, Backman L, Bengtsson C, Bouchard
C, Dahlgren S, Jonsson E, Larsson B, Lindstedt S, Naslund I, Olbe L,
Wedel H: Swedish obese subjects (SOS) – an intervention
study of obesity. Baseline evaluation of health and psychoso-
cial functioning in the first 1743 subjects examined. Int J Obes
Relat Metab Disord. 1993, 17(9):503-512.
9. Karlsson J, Sjostrom L, Sullivan M: Swedish obese subjects (SOS)
– an intervention study of obesity. Two-year follow-up of
health-related quality of life (HRQL) and eating behavior
after gastric surgery for severe obesity. Int J Obes Relat Metab
Disord 1998, 22(2):113-126.
10. Rabin R, de Charro F: EQ-5D: a measure of health status from
the EuroQol Group. Ann Med 2001, 33(5):337-343.
11. Erondu N, Gantz I, Musser B, Suryawanshi S, Mallick M, Addy C, Cote
J, Bray G, Fujioka K, Bays H, Hollander P, Sanabria-Bohorquez SM, Eng
W, Langstrom B, Hargreaves RJ, Burns HD, Kanatani A, Fukami T,
MacNeil DJ, Gottesdiener KM, Amatruda JM, Kaufman KD, Heyms-
field SB: Neuropeptide Y5 receptor antagonism does not
induce clinically meaningful weight loss in overweight and
obese adults. Cell metabolism 2006, 4(4):275-282.
12. Kolotkin RL, Crosby RD: Psychometric evaluation of the
Impact Of Weight On Quality Of Life-Lite Questionnaire
(IWQOL-Lite) in a community sample. Qual Life Res 2002,
11(2):157-171.
13. Kolotkin RL, Crosby RD, Williams GR, Hartley GG, Nicol S: The
relationship between health-related quality of life and weight
loss. Obes Res 2001, 9:564-571.
14. Engel SG, Crosby RD, Kolotkin RL, Hartley GG, Williams GR, Won-
derlich SA, Mitchell JE: The impact of weight loss and regain on
obesity-specific quality of life: mirror image or differential
effect. Obes Res 2003, 11:1207-1213.
15. Kolotkin RL, Crosby RD, Williams GR: Health-related quality of
life varies among obese subgroups. Obes Res 2002,
10(8):748-756.
16. Kolotkin RL, Crosby RD, Pendleton R, Strong M, Gress RE, Adams
TD: Health-related quality of life in patients seeking gastric
bypass surgery vs. non-treatment-seeking controls. Obes Surg
2003, 13:371-377.
17. White MA, O'Neil PM, Kolotkin RL, Byrne TK: Gender, race, and
obesity-related quality of life at extreme levels of obesity.
Obes Res 2004, 12(6):949-955.
18. Brooks R: EuroQol: the current state of play. Health Policy 1996,
37:53-72.
19. Cohen J: Statistical Power Analysis for the Behavior Sciences.
Second Edition. Hillsdale, NJ: Lawrence Erlbaum; 1988.
20. Van Gaal L, De Leeuw I: The beneficial effects of modest weight
loss on cardiovascular risk factors. Int J Obes Relat Metab Disord
1997, 21 Suppl 1:S5-S9.
21. Rejeski WJ, Focht BC, Messier SP, Morgan T, Pahor M, Penninx B:
Obese, older adults with knee osteoarthritis: weight loss,
exercise, and quality of life. Health Psychol 2002, 21(5):419-426.
Publish with BioMed Central and every
scientist can read your work free of charge
"BioMed Central will be the most significant development for
disseminating the results of biomedical research in our lifetime."
Sir Paul Nurse, Cancer Research UK
Your research papers will be:
available free of charge to the entire biomedical community
peer reviewed and published immediately upon acceptance
cited in PubMed and archived on PubMed Central
yours — you keep the copyright
Submit your manuscript here:
/>BioMedcentral
Health and Quality of Life Outcomes 2009, 7:53 />Page 10 of 10
(page number not for citation purposes)
22. Fine JT, Colditz GA, Coakley EH, Moseley G, Manson JE, Willett WC,
Kawachi I: A prospective study of weight change and health-
related quality of life in women. JAMA 1999,
282(22):2136-2142.
23. Kolotkin RL, Meter K, Williams GR: Quality of life and obesity.
Obes Rev 2001, 2:219-229.
24. Jia H, Lubetkin EI: The impact of obesity on health-related qual-
ity-of-life in the general adult US population. J Public Health
(Oxf) 2005, 27(2):156-164.
25. Sach TH, Barton GR, Doherty M, Muir KR, Jenkinson C, Avery AJ:
The relationship between body mass index and health-
related quality of life: comparing the EQ-5D, EuroQol VAS
and SF-6D. Int J Obes (Lond) 2006, 31:189-196.