báo cáo hóa học: "Rasch analysis of the Multiple Sclerosis Impact Scale (MSIS-29)" pot
Bạn đang xem bản rút gọn của tài liệu. Xem và tải ngay bản đầy đủ của tài liệu tại đây (294.63 KB, 10 trang )
BioMed Central
Page 1 of 10
(page number not for citation purposes)
Health and Quality of Life Outcomes
Open Access
Research
Rasch analysis of the Multiple Sclerosis Impact Scale (MSIS-29)
Melina Ramp*
1
, Fary Khan
2
, Rose Anne Misajon
3
and Julie F Pallant
4
Address:
1
Department of General Practice, University of Melbourne, 200 Berkeley Street, Carlton 3053, Victoria, Australia,
2
Department of
Rehabilitation Medicine, University of Melbourne, Royal Melbourne Hospital, Melbourne, Australia,
3
School of Political and Social Inquiry,
Monash University, Melbourne, Australia and
4
School of Rural Health, University of Melbourne, 49 Graham Street, Shepparton 3630, Victoria,
Australia
Email: Melina Ramp* - ; Fary Khan - ;
Rose Anne Misajon - ; Julie F Pallant -
* Corresponding author
Abstract
Background: Multiple Sclerosis (MS) is a degenerative neurological disease that causes
impairments, including spasticity, pain, fatigue, and bladder dysfunction, which negatively impact on
quality of life. The Multiple Sclerosis Impact Scale (MSIS-29) is a disease-specific health-related
quality of life (HRQoL) instrument, developed using the patient's perspective on disease impact. It
consists of two subscales assessing the physical (MSIS-29-PHYS) and psychological (MSIS-29-
PSYCH) impact of MS. Although previous studies have found support for the psychometric
properties of the MSIS-29 using traditional methods of scale evaluation, the scale has not been
subjected to a detailed Rasch analysis. Therefore, the objective of this study was to use Rasch
analysis to assess the internal validity of the scale, and its response format, item fit, targeting,
internal consistency and dimensionality.
Methods: Ninety-two persons with definite MS residing in the community were recruited from a
tertiary hospital database. Patients completed the MSIS-29 as part of a larger study. Rasch analysis
was undertaken to assess the psychometric properties of the MSIS-29.
Results: Rasch analysis showed overall support for the psychometric properties of the two MSIS-
29 subscales, however it was necessary to reduce the response format of the MSIS-29-PHYS to a
3-point response scale. Both subscales were unidimensional, had good internal consistency, and
were free from item bias for sex and age. Dimensionality testing indicated it was not appropriate
to combine the two subscales to form a total MSIS score.
Conclusion: In this first study to use Rasch analysis to fully assess the psychometric properties of
the MSIS-29 support was found for the two subscales but not for the use of the total scale. Further
use of Rasch analysis on the MSIS-29 in larger and broader samples is recommended to confirm
these findings.
Background
Multiple Sclerosis (MS) is a chronic and degenerative neu-
rological disease affecting an estimated 2.5 million people
worldwide [1]. MS causes a number of impairments such
as motor weakness, spasticity and incoordination, pain,
fatigue, blurred vision, sensory dysasthesias, depression,
Published: 22 June 2009
Health and Quality of Life Outcomes 2009, 7:58 doi:10.1186/1477-7525-7-58
Received: 21 December 2008
Accepted: 22 June 2009
This article is available from: />© 2009 Ramp et al; licensee BioMed Central Ltd.
This is an Open Access article distributed under the terms of the Creative Commons Attribution License ( />),
which permits unrestricted use, distribution, and reproduction in any medium, provided the original work is properly cited.
Health and Quality of Life Outcomes 2009, 7:58 />Page 2 of 10
(page number not for citation purposes)
anxiety, and bladder dysfunction. These have a significant
impact on a person's daily living activities (function), par-
ticipation and quality of life (QoL) [2-7]. QoL and
changes following treatment in persons with MS are diffi-
cult to measure despite recent advances in MS treatments
(medications), and support for adjuvant and supportive
interventions such as rehabilitation [8,9].
A number of measurement scales, both generic and dis-
ease specific, have been used to assess the quality of life
and functioning of patients with MS. These include the
Kurtzke Expanded Disability Status Scale (EDSS) [10],
Multiple Sclerosis Quality of Life (MSQOL-54) [11], the
Multiple Sclerosis Quality of Life Inventory (MSQLI) [12],
the Functional Assessment of Multiple Sclerosis (FAMS)
[13], the Multiple Sclerosis Functional Composite
(MSFC) [14], the UK Neurological Disability Scale
(UKNDS) [15], the Health-Related Quality of Life Ques-
tionnaire for Multiple Sclerosis (HRQOL-MS) [16] and
the Medical Outcomes 36-item Short-Form Health Survey
(SF-36) [17].
One scale that is increasingly being used in both research
and clinical settings is the Multiple Sclerosis Impact Scale
(MSIS-29) [18]. This scale was developed as a disease-spe-
cific measure of HRQoL using the patient's perspective on
disease impact in MS. It was designed to be a scientifically
rigorous, clinically useful, disease specific instrument to
enhance existing measures used in treatment trials, devel-
oped from and completed by patients with MS, ensuring
measurement of HRQoL outcomes relevant to those
patients that are sometimes overlooked by clinicians
[2,19]. The scale's authors engaged standard psychometric
techniques of classical test theory (CTT) to construct the
MSIS-29, on a United Kingdom community sample with
MS [18]. Using factor analysis, they identified two dimen-
sions that mirrored previous findings of patients' views of
health status, which they labelled physical impact and psy-
chological impact [18]. The physical impact dimension
(MSIS-29-PHYS: consisting of 20 items) and the psycho-
logical impact dimension (MSIS-29-PSYCH: consisting of
nine items) measure related, but distinct, constructs (cor-
relatingr r = 0.62), yielding two separate scale scores, with
higher scores indicating higher impact level [18].
Although a total impact score can be calculated, the
authors do not recommend its use in clinical trials or epi-
demiological research, as combining the subscales con-
ceals possible diverging effects of treatment on the two
health dimensions [18].
A number of studies have re-examined the psychometric
properties of the MSIS-29 using CTT methods [19-25].
Each study has shown overall support for the original
findings on the MSIS-29 physical and psychological
scale's data quality, scaling assumptions, acceptability,
reliability, external validity and responsiveness to change
in various settings and in a number of MS populations in
the UK [19,21,24], Ireland [20,23], the Netherlands
[22,26] and, more recently, Iran [25]. None of these sub-
sequent studies, however, re-examined the internal factor
structure of the MSIS-29 or its subscales.
As with all new scales, the MSIS-29 requires further valida-
tion in a variety of settings and samples, and utilizing dif-
ferent methodologies [18,19,21]. In particular the scale
authors suggest that the MSIS-29 should be subjected to
validation with newer psychometric methods such as
Rasch analysis [18,19,21]. Rasch analysis, which was orig-
inally developed by Danish mathematician Georg Rasch
[27], is increasingly being used in the development and
evaluation of clinical tools for the health and medical sci-
ences [28]. Rasch analysis provides the opportunity to
evaluate many aspects of a scale's functioning, including a
detailed assessment of response format, item content,
response bias, dimensionality and appropriate targeting
of a scale [29-31]. It also allows the transformation of
ordinal level scale scores into equal interval measurement,
which is particularly important when measuring change
or responsiveness to treatment [28,29]. Only scales that fit
the Rasch model fulfil the requirements of objective con-
joint measurement required for mathematical manipula-
tion of the scores.
To date, no study has made full use of the features availa-
ble in Rasch analysis to investigate the internal validity of
the MSIS-29. Two previous studies used Rasch analysis to
assess specific issues that arose in the course of their
research [23,26]. In addition to a study conducted in the
Netherlands [26], an Irish study showed support for the
MSIS-29 physical subscale's divergent validity using Rasch
calibrated interval level scale scores [23].
With the increasing use of the MSIS-29 in research in
many parts of the world further analysis of the scale's psy-
chometric properties needs to be undertaken. The aim of
this study was to use Rasch analysis to further test the
internal validity of the MSIS-29 subscales (MSIS-29-PHYS,
MSIS-29-PSYCH) and total scale (MSIS-29-TOTAL) in
terms of response format, item fit, model fit, item bias,
targeting, internal consistency and dimensionality in an
Australian sample.
Methods
Participants and setting
This study involves secondary analysis of data collected
for a larger study conducted in Melbourne, Australia eval-
uating the efficacy of rehabilitation in multiple sclerosis
patients [8]. Ethics approval for this study was granted by
the Royal Melbourne Hospital (RMH) Human Research
and Ethics Committees. A community sample of persons
Health and Quality of Life Outcomes 2009, 7:58 />Page 3 of 10
(page number not for citation purposes)
aged between 18–65 years with 'definite' MS (McDonald
criteria [32]) were recruited using the RMH MS Database
[8]. Of the 101 eligible patients who consented to the
broader study, 92 patients [66 (72%) women; 26 (28%)
men] were included in the current cross-sectional study,
having completed the MSIS-29 at baseline. These partici-
pants ranged in age from 29 to 65 years with a mean age
of 50.45 years (SD = 8.96 years). Years since diagnosis
ranged from 1 to 43 years (M = 10.56, SD = 7.40) with
30% (N = 26) classified as Relapsing/remitting, 58% (N =
53) as Secondary Progressive and the remainder (11,
12%) as Primary Progressive. Twenty percent (N = 18)
recorded Expanded Disability Status Scale (EDSS) [10]
scores between 0 and 3, 58% (N = 53) scored between 3.5
and 6.0 and 23% (N = 21) scored 6.5 and above.
Procedure & materials
As part of the larger study [8] participants were asked to
complete a questionnaire booklet which included the
MSIS-29 [18]. The MSIS-29 is a 29 item scale consisting of
two subscales, a 20-item scale measuring physical impact
(MSIS-29-PHYS) and a 9-item scale measuring psycholog-
ical impact (MSIS-29-PSYCH) [18]. All items have a poly-
tomous response format (range 1–5), with higher scores
indicating higher impact level. A total score for each sub-
scale can be derived by summing items and transforming
them into a score out of 100. The authors suggest a total
scale score can also be calculated (MSIS-29-TOTAL)[18],
however they advise caution against its use in clinical tri-
als and epidemiological studies. The MSIS-29 has been
shown to have good internal consistency, with Cron-
bach's alpha values for each of the subscales of between
0.87 and 0.96 [18,19,21,23]. A number of studies have
shown overall support for the convergent and discrimi-
nant construct validity of the MSIS-29-PHYS and MSIS-
29-PSYCH [19,20,22].
Statistical analyses
Separate Rasch analyses were conducted to assess the
internal validity of the MSIS-29-PHYS, MSIS-29-PSYCH
and MSIS-29-TOTAL using RUMM2020 software [33].
Each set of items was assessed for threshold ordering,
overall model fit, item fit, person fit, reliability, differen-
tial item functioning, targeting and dimensionality. The
procedures adopted were consistent with the published
guidelines of Tennant and colleagues [34,31].
Before conducting Rasch analyses a decision needs to be
made as to whether the rating scale model or the partial
credit model should be used to analyse the scales [29].
The partial credit model, unlike the rating scale model,
does not require assumptions to be met regarding item
distribution [34]. It allows items to have different num-
bers of response categories [29], and does not assume the
distance between response thresholds is uniform for all
items [34]. RUMM2020 provides the likelihood ratio test
to identify the form of Rasch model that is most appropri-
ate for a given set of data. A significant likelihood ratio test
indicates that the distance between response thresholds is
inconsistent, and therefore, a partial credit model is pre-
ferred [34].
For a scale to have good fit to the Rasch model it is
expected that patients with high levels of the measured
attribute (e.g. physical or psychological impact of MS),
will consistently endorse high scoring response options
across all items and patients with low levels will endorse
low scoring responses. All items are expected to have
ordered response thresholds, with the term threshold signi-
fying the point between adjacent response categories
where either response is equally probable. Disordered
thresholds occur when respondents inconsistently
endorse response categories. This can be the result of
ambiguous response labelling or too many response
options. The presence of disordered thresholds can be
detected from the threshold map provided by
RUMM2020, and the extent of the disordering deter-
mined by inspection of the category probability curves for
each item [34]. Disordered thresholds can be resolved,
where considered necessary, by collapsing adjacent
response categories.
Model fit was assessed using three summary statistics.
Good overall model fit was indicated by a non-significant
item-trait interaction chi-square probability value, indi-
cating the hierarchical ordering of items is consistent over
all levels of the trait. Item and person fit are indicated by
two item-person interaction fit residuals transformed to
approximate z-scores, with a mean of zero and standard
deviation of one indicating perfect fit to the model. Resid-
uals and chi-square probability values of individual items
or persons were inspected, with misfit indicated by fit
residual values > ± 2.5 and/or chi-square probability val-
ues < 0.05 (using a Bonferonni adjustment to the alpha
level for the number of items) [34]. High positive fit resid-
ual values indicate misfit to the model and high negative
fit residuals indicate redundancy. Internal consistency of
the scale was estimated by the Person Separation Index
(PSI), which is interpreted in the same way as a Cron-
bach's alpha coefficient, with values above 0.7 considered
acceptable [30,31].
Differential item functioning (DIF) was assessed to exam-
ine potential item bias caused by different groups (gender,
age groups) in the sample. An analysis of variance is con-
ducted for each item to examine scores over different lev-
els of the person factor, and over different levels of the
underlying trait (using a Bonferroni adjusted alpha level)
[34]. The current study assessed potential DIF on sex and
age group (< 53 years/≥ 53 years).
Health and Quality of Life Outcomes 2009, 7:58 />Page 4 of 10
(page number not for citation purposes)
To assess the ability of the scales to appropriately target
the population being measured, person-item threshold
distribution maps were inspected. A well targeted scale
should include a set of items that span the full range of
person estimates.
Possible response dependency among the items was
investigated by inspecting the residual correlation matrix
[34] for pairs of items with correlations exceeding 0.3.
Dimensionality of the scales was assessed using independ-
ent t-tests to compare person estimates derived from the
two most disparate subsets of scale items [35]. These sub-
sets of items are defined by positive and negative loadings
on the first factor extracted using a principal component
analysis of residuals. For a scale to be considered unidi-
mensional no more than five percent of cases should
show a significant difference between their scores on the
two subsets [34]. If more than five percent show a differ-
ence a binomial test of proportions is used to calculate the
95% confidence interval around the t-test estimate. Unidi-
mensionality is said to be supported if the value of five
percent falls within the 95% confidence intervals [34,36].
The sample size for Rasch analysis varies according to a
number of parameters, including the degree of required
precision of the person and item estimates, and the target-
ing of the sample. A well targeted sample is one in which
the person distribution closely matches the item distribu-
tion when they are both calibrated on the same metric
scale. A sample size of 64 cases is considered sufficient to
give a stable item calibration within ± 0.5 logit where the
sample is well targeted, rising to 144 when the sample is
poorly targeted [33,37].
Rasch calibrated person ability estimates for both sub-
scales were imported into SPSS [38] from RUMM2020
and the correlation between the two subscales was
assessed using a Spearman's correlation coefficient (rho).
Results
Rasch analysis
Likelihood ratio tests for all three scales were significant,
supporting the use of a partial credit Rasch model (MSIS-
29-PHYS: p < 0.001; MSIS-29-PSYCH: p = 0.015; MSIS-29-
TOTAL: p < 0.001).
MSIS-29 physical impact scale
The threshold map for the 20 items of the MSIS-29-PHYS
indicated that over half (11/20) of the items had some
degree of threshold disordering. A number of rescoring
options were tested, however, a global rescore was found
to be the most appropriate solution. All disordered
thresholds were resolved by reducing the original 5-point
response scale (12345) to a 3-point scale (01112), by
merging the three middle response categories ('a little',
'moderately' and 'quite a bit').
The overall fit statistics for the rescored MSIS-29-PHYS
showed good model fit (p = 0.363) and high internal con-
sistency (PSI = 0.93) (see Analysis 2, Table 1). The mean
fit residual value for items was -0.12 (SD = 1.29) showing
good individual item fit to the Rasch model, however,
Table 1: Summary fit statistics for original and final models for MSIS-29 subscales
Action Analysis Number Overall
model fit
Item fit Mean
(SD)
Person fit Mean
(SD)
PSI % significant t-tests
MSIS-29-PHYS
Original scale 1 χ
2
= 44.04, df = 20, p = .002 .31
(1.46)
09
(1.33)
.95
Rescoring to 3-point 2 χ
2
= 21.59, df = 20, p = .36 12
(1.29)
44
(1.64)
.93
Removal of 1 case 3 χ
2
= 19.34, df = 20, p = .50 10
(1.19)
44
(1.58)
.93 9.21%
(CI:4–14%)
MSIS-29-PSYCH
Original scale 4 χ
2
= 12.57,
df = 9, p = .18
.09
(1.28)
38
(1.58)
.90
Removal of 1 case 5 χ
2
= 14.79,
df = 8, p = .10
.10
(1.31)
33
(1.49)
.91 1.69%
PSI = Person Separation Index, SD = standard deviation, df = degrees of freedom, p = probability, CI = confidence interval
Health and Quality of Life Outcomes 2009, 7:58 />Page 5 of 10
(page number not for citation purposes)
individual person fit statistics showed some misfitting
persons, with a mean fit residual of -0.44 (SD = 1.64).
One case had a positive fit residual above 2.5 (3.22). After
this person's data was removed person fit and overall
model fit improved (see Analysis 3 – Table 1). In the final
solution one item (item 20: needing to go to the toilet
urgently) recorded a positive fit residual above 2.5 (3.72).
Given the Bonferroni adjusted p-value for the item was
non-significant and overall model fit was achieved it was
decided to retain this item (see Table 2).
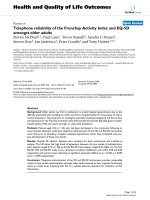
No differential item functioning was found for sex or age
group (under 53 years/53 years and over). The targeting
map for the MSIS-29-PHYS shows that the items and
thresholds adequately spanned the full range of person
scores except for a few persons recording very high or very
low scores (see Figure 1). This suggests that the MSIS-29-
PHYS is well targeted for the current sample of MS
patients.
No response dependency among the items was detected,
with all correlations among the items in the residual cor-
Table 2: Individual item fit statistics for the 20-item MSIS-29-PHYS
Item MSIS Item name Location SE Fit Resid Chi Sq Prob
1 Do physically demanding tasks -2.239 0.254 0.382 0.632 0.427
2 Grip things tightly (e.g. turning on taps) 0.219 0.201 0.453 1.509 0.219
3Carry things -0.788 0.235 0.361 0.138 0.710
4 Problems with your balance -0.481 0.279 0.747 0.259 0.611
5 Difficulties moving about indoors 1.682 0.256 0.294 0.156 0.693
6 Being clumsy 0.061 0.278 -1.097 2.381 0.123
7Stiffness 0.009 0.233 -0.200 0.424 0.515
8 Heavy arms and/or legs -0.258 0.218 -0.758 0.089 0.765
9 Tremor of your arms or legs 0.696 0.213 1.356 1.091 0.296
10 Spasms in your limbs 0.723 0.222 0.574 0.375 0.540
11 Your body not doing what you want it to do -0.577 0.204 -0.669 0.115 0.734
12 Having to depend on others to do things for you -0.102 0.219 -1.681 2.116 0.146
13 Limitations in your social and leisure activities at home 0.515 0.234 -0.938 4.469 0.035
14 Being stuck at home more than you would like to be 0.022 0.196 -0.721 0.148 0.701
15 Difficulties using your hands in everyday tasks 0.669 0.219 -0.268 0.384 0.536
16 Having to cut down the amount of time you spent on work or other daily activities -0.096 0.215 -0.702 0.033 0.855
17 Problems using transport (e.g. car, bus, train, taxi, etc.) 0.639 0.199 -0.916 0.258 0.611
18 Taking longer to do things -0.200 0.239 -0.884 0.086 0.770
19 Difficulty doing things spontaneously (e.g. going out on the spur of the moment) -0.075 0.206 -1.117 0.025 0.875
20 Needing to go to the toilet urgently -0.419 0.196 3.715 4.649 0.031
Values showing significant misfit bolded.
SE = Standard error, Fit Resid = Fit Residual, Chi-Sq = Chi-Square, Prob = probability
Fit Residual df = 82.6, Chi-square df = 1
Health and Quality of Life Outcomes 2009, 7:58 />Page 6 of 10
(page number not for citation purposes)
relation matrix falling below 0.3. Dimensionality of the
rescored MSIS-29-PHYS was assessed using a Principal
Component Analysis of the residuals to detect the two
most disparate subsets of scale items, suggested by posi-
tive and negative loadings on the first component
extracted. Results from a series of paired samples t-tests
used to compare person estimates on the two most dispa-
rate subsets showed support for the unidimensionality of
the MSIS-29-PHYS. Although seven of the 76 (9.21%)
patients showed significantly different scores on the two
subsets, the 95% confidence intervals around this esti-
mate, derived from a binomial distribution, included five
percent (CI: 4% to 14%), indicating that the unidimen-
sionality of the scale was supported.
MSIS-29 psychological impact scale
The 9-item MSIS-29-PSYCH showed good fit to the Rasch
model (p = 0.18) with good internal consistency (PSI =
.90) (see Analysis 4 – Table 1). The threshold map showed
disordered thresholds for three items (items 21, 22 & 26).
As the level of disorder revealed in the category probabil-
ity curves for these items was relatively minor and model
fit was satisfactory, the original 5-point response format
was retained.
Individual person fit statistics showed some misfitting
persons with a mean fit residual value of -0.38 (SD =
1.58). Inspection of individual person estimates showed
one person with a fit residual exceeding 2.5 (2.96). After
removal of this case the person fit statistics improved, and
the PSI increased (PSI = .91) (see Analysis 5 – Table 1).
Individual item fit statistics showed one misfitting item
(item 22: problems sleeping) with a positive fit residual
exceeding 2.5 (3.30) [31]. However, given the item had a
non-significant Bonferroni adjusted chi-square p-value
and that overall model fit was good, the item was retained
(see Table 3). No differential item functioning on the
MSIS-29-PSYCH was found for sex or age group.
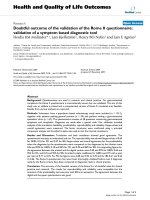
The targeting map for the MSIS-29-PSYCH showed the
items and thresholds spanned the range of person scores
except for those at the lower impact end (see Figure 2).
Independent t-tests comparing person ability estimates on
the two most opposing item subsets showed a significant
difference in scores for only one of the 59 t-tests (1.69%).
These results provide support for the unidimensionality of
the MSIS-29-PSYCH.
MSIS-29 total scale
The MSIS-29-TOTAL was then subjected to Rasch analysis.
Item thresholds of all 29 items were checked for disorder-
ing. As a large proportion of items (18 of the 29 items)
were found to have some level of disordering, a global res-
core of items was performed to resolve this problem. Col-
lapsing the original 5-point scale (12345) into a 3-point
scale (01112) resolved all disordering.
Targeting map for the 20-item MSIS-29-PHYS after rescoring and removal of one person (N = 91)Figure 1
Targeting map for the 20-item MSIS-29-PHYS after rescoring and removal of one person (N = 91).
Health and Quality of Life Outcomes 2009, 7:58 />Page 7 of 10
(page number not for citation purposes)
Table 3: Individual item fit statistics for the nine-item MSIS-29-PSYCH
Item MSIS Item name Location SE Fit Resid Chi Sq Prob
21 Feeling unwell 0.077 0.127 0.434 0.866 0.352
22 Problems sleeping -0.068 0.120 3.297 5.738 0.017
23 Feeling mentally fatigued -0.346 0.137 -0.342 0.834 0.361
24 Worries related to your MS -0.348 0.124 -0.110 1.199 0.273
25 Feeling anxious or tense -0.191 0.134 -0.768 1.299 0.254
26 Feeling irritable, impatient, or short tempered -0.206 0.141 0.452 0.096 0.757
27 Problems concentrating -0.059 0.141 -1.217 2.563 0.109
28 Lack of confidence 0.903 0.141 -0.428 2.167 0.141
29 Feeling depressed 0.238 0.136 -0.424 0.028 0.866
Values showing significant misfit bolded.
Fit Residual df = 69, Chi-square df = 1
SE = Standard error, Fit Resid = Fit Residual, Chi-Sq = Chi-Square, Prob = probability
Targeting map for the nine-item MSIS-29-PSYCH after removal of one person (N = 91)Figure 2
Targeting map for the nine-item MSIS-29-PSYCH after removal of one person (N = 91).
Health and Quality of Life Outcomes 2009, 7:58 />Page 8 of 10
(page number not for citation purposes)
To establish whether the total scale represents a single
underlying construct the dimensionality of the total res-
cored MSIS-29-TOTAL was examined, prior to generating
model fit statistics. Independent t-tests comparing scores
from the two most disparate subsets of items failed to find
support for the unidimensionality of the total scale with
11 out of 71 t-tests showing a significant difference
(15.49%, 95% CI: 10%, 21%). As expected, the items rep-
resenting the MSIS-29-PHYS and MSIS-29-PSYCH sepa-
rated into different factors. These results indicate that it is
not appropriate to combine the physical and psychologi-
cal items of the MSIS-29 to produce a total scale score. As
unidimensionality is an essential requirement for Rasch
analysis no further analyses were conducted on the com-
bined set of items.
Spearman correlation coefficients were calculated from
Rasch derived person estimates to assess the intercorrela-
tion between the MSIS-29-PHYS and MSIS-29-PSYCH.
There was a relatively strong correlation (rho = 0.62)
between these two scales, consistent with Hobart and col-
leagues' original finding that they measure similar but dis-
tinct constructs [18].
Discussion
Although previous studies using classical theory based
techniques have found support for the psychometric
properties of the MSIS-29, this is the first study to system-
atically assess all aspects of the scale using Rasch analysis.
Overall support was established for the psychometric
properties of the individual scales of the MSIS-29 (MSIS-
29-PHYS, MSIS-29-PSYCH) with adequate fit to the Rasch
model, no differential item bias, good internal consist-
ency and support for both the targeting and unidimen-
sionality of the scales. A number of issues emerged
however in relation to the response format of items, and
the fit of some items. The results also suggest that it is not
appropriate to combine the two subscales to form a total
MSIS score.
Inspection of the item response format for the MSIS-29-
PHYS, MSIS-29-PSYCH and MSIS-29-TOTAL revealed
issues regarding the ordering of response categories. Sub-
stantial disordering of thresholds was identified for many
of the MSIS-29-PHYS items, and minor disordering was
identified for some of the MSIS-29-PSYCH items. A reduc-
tion in number of response categories, from five to three,
for the MSIS-29-PHYS items resolved any disordering. No
rescoring was undertaken for the MSIS-29-PSYCH items
due to the relatively minor degree of disordering.
Problems with the response format in this study may be
influenced by the relatively small sample used in this
study and will need to be verified in larger and broader
samples before specific recommendations can be made. It
does however suggest that some modifications to the
response format used in this test may be warranted in
future studies to reduce potential confusion for respond-
ents. These results suggest that they are unable to reliably
distinguish between what is meant by the terms 'a little',
'moderately' and 'quite a bit'; which could be replaced by a
single category (e.g. moderately). Despite the reduction in
response options from five to three the revised MSIS-29-
PHYS scale showed good internal consistency (PSI = .93),
supporting this revision.
The rescored MSIS-29-PHYS and MSIS-29-PSYCH scales
each revealed a misfitting item (item 20: needing to go to
the toilet urgently; and item 22: problems sleeping, respec-
tively). Given the non-significant Bonferroni adjusted p-
values for each item, and that good fit to the Rasch model
for each scale was achieved, these items were retained.
The Rasch assumption of unidimensionality was sup-
ported for both the rescored MSIS-29-PHYS and MSIS-29-
PSYCH. This finding replicated the original structure of
the scale reported in earlier studies using factor analytic
techniques of CTT [18]. Unidimensionality was not satis-
fied for the MSIS-29-TOTAL, with results clearly showing
that the two scales should not be combined to produce a
total score. Consistent with previous research
[18,19,22,23], the current study showed that the two
MSIS-29 scales measure related, but distinct constructs, as
evidenced by an inter-correlation of rho = 0.62. The
authors of the MSIS-29 were justified in their caution that
a total scale score should not be used for clinical trials and
epidemiological purposes [18].
Although controversy exists over the appropriateness of
reducing human attributes to quantifiable scores [29],
measurement of outcomes such as HRQoL can provide a
more complete picture of disease burden. This is particu-
larly pertinent for clinical trials of MS due to the disease's
heterogeneous presentation, diverse symptoms and
unpredictable path, as well as its high prevalence and the
lack of a cure. This study provides further evidence for the
internal validity of the physical and psychological impact
scales of the MSIS-29, supporting their use in clinical and
research settings as a measure of HRQoL to augment med-
ical models of disease impact. This study also highlights
the contribution that Rasch analysis can make in the eval-
uation of scales, over and above the classical test theory
methods that have dominated the area of scale develop-
ment in the health and social sciences.
The sample size of 92 MS patients was considered ade-
quate for a Rasch analysis of the MSIS-29 [37], however
future studies utilising larger samples should be under-
taken using Rasch analysis to confirm the findings of this
study. Broader samples, including a wider variety of
Health and Quality of Life Outcomes 2009, 7:58 />Page 9 of 10
(page number not for citation purposes)
patients with MS drawn from different settings, should
also be utilized. Further evaluation of the response format
of the scales should be undertaken to examine the deci-
sion made in this study to rescore the response categories
of the MSIS-29-PHYS items. Ideally this would include the
administration of the original and revised version of the
MSIS scoring to the same people to compare their validity.
Longitudinal studies should also be undertaken to assess
the responsiveness of the MSIS-29 over time, using Rasch
calibrated interval-scaled scores. For clinical studies evalu-
ating the efficacy of various treatment and rehabilitation
interventions it is important to accurately calculate change
scores.
Conclusion
The MSIS-29 was designed as a disease-specific HRQoL
instrument to augment existing measures for MS clinical
trials. It was developed and evaluated using techniques
based within classical test theory. The current study was
the first to undertake a rigorous examination of the MSIS-
29 scales' psychometric properties using Rasch analysis.
Using an Australian MS sample this study found support
for the internal validity, internal consistency reliability,
targeting, and unidimensionality of the two MSIS-29 sub-
scales. Modifications to the scoring format was necessary
for the MSIS-29-PHYS, however, further validation of this
is necessary before clinical implementation would be rec-
ommended. The summation of all items to form a total
scale was not supported. The further use of Rasch analysis
on the MSIS-29 in larger and broader samples is recom-
mended to confirm the findings of the current study.
Competing interests
The authors declare that they have no competing interests.
Authors' contributions
MR conducted the data analysis and prepared a draft of
the manuscript. FK designed the study and collected the
data. RM participated in the preparation and revision of
the manuscript. JP supervised the design of the study, data
analysis and preparation of the manuscript. All authors
contributed to the preparation of the manuscript and read
and approved the final manuscript.
References
1. Atlas: Country Resources for Neurological Disorders [http:/
/www.who.int/mental_health/neurology/neurogy_atlas_lr.pdf]
2. Mitchell AJ, Benito-Leon J, Gonzalez J-MM, Rivera-Navarro J: Quality
of life and its assessment in multiple sclerosis: integrating
physical and psychological components of wellbeing. Lancet
Neurol 2005, 4(9):556-566.
3. Keegan BM, Noseworthy JH: Multiple Sclerosis. Annu Rev Med
2002, 53:285-302.
4. Ford HL, Gerry E, Tennant A, Whalley D, Haigh R, Johnson ME:
Developing a disease-specific quality of life measure for peo-
ple with multiple sclerosis. Clin Rehabil 2001, 15(3):247-258.
5. Khan F, McPhail T, Brand C, Turner-Stokes L, Kilpatrick T: Multiple
sclerosis: disability profile and quality of life in an Australian
community cohort. Int J Rehabil Res 2006, 29(2):87-96.
6. Khan F, Pallant J: Chronic pain in multiple sclerosis: prevalence,
characteristics, and impact on quality of life in an Australian
community cohort. J Pain 2007, 8(8):614-623.
7. Khan F, Pallant J: Use of the International Classification of
Functioning, Disability and Health (ICF) to identify prelimi-
nary comprehensive and brief core sets for multiple sclero-
sis. Disabil Rehabil 2007, 29(3):205-213.
8. Khan F, Pallant J, Brand C, Kilpatrick T: Effectiveness of rehabili-
tation intervention in persons with multiple sclerosis: a ran-
domized controlled trial. J Neurol Neurosurg Psychiatry 2008,
79(11):1230-5.
9. Khan F, Turner-Stokes L, Ng L, Kilpatrick T: Multidisciplinary
rehabilitation for adults with multiple sclerosis (Review).
Cochrane Database Syst Rev. 2007, 18(2):CD006036.
10. Kurtzke J: Rating neurologic impairment in multiple sclerosis:
an expanded disability status scale (EDSS). Neurology 1983,
33:1444-1452.
11. Vickrey BG, Hays RD, Harooni R, Myers LW, Ellison GW: A health-
related quality of life measure for multiple sclerosis. Qual Life
Res 1995, 4(3):187-206.
12. LaRocca NG, Ritvo PG, Miller DM, Fischer JS, Andrews H, Paty DW:
'Quality of life' assessment in multiple sclerosis clinical trials:
current status and strategies for improving multiple sclero-
sis clinical trial design. In Multiple sclerosis: advances in clinical trial
design, treatment and future perspectives Edited by: Goodkin DE, Rudick
RA. London: Springer-Verlag; 1996:145-160.
13. Cella DF, Dineen K, Arnason B, Reder A, Webster KA, Karabatsos
G, Chang C, Lloyd S, Mo F, Stewart J, et al.: Validation of the func-
tional assessment of multiple sclerosis quality of life instru-
ment. Neurology 1996, 47:129-139.
14. Rudick R, Antel J, Confavreux C, Cutter G, Ellison G, Fisher J, Lublin
F, Miller A, Petkau J, Rao S, et al.: Recommendations from the
National Multiple Sclerosis Society Clinical Outcomes
Assessment Task Force. Ann Neurol 1997, 42(3):379-382.
15. Sharrack B, Hughes RA: The Guy's Neurological Disability Scale
(GNDS): a new disability measure for multiple sclerosis. Mult
Scler 1999, 5:223-233.
16. Pfennings LE, Ploeg HM Van der, Cohen L, Bramsen I, Polman CH,
Lankhorst GJ, Vleugels L: A health-related quality of life ques-
tionnaire for multiple sclerosis patients. Acta Neurol Scand
1999, 100(3):148-155.
17. Hobart J, Freeman J, Lamping D, Fitzpatrick R, Thompson A: The SF-
36 in multiple sclerosis: why basic assumptions must be
tested. J Neurol Neurosurg Psychiatry 2001, 71(3):363-370.
18. Hobart J, Lamping D, Fitzpatrick R, Riazi A, Thompson A: The Mul-
tiple Sclerosis Impact Scale (MSIS-29) – A new patient-based
outcome measure. Brain 2001, 124:962-973.
19. Riazi A, Hobart J, Lamping D, Fitzpatrick R, Thompson A: Multiple
Sclerosis Impact Scale (MSIS-29): reliability and validity in
hospital based samples. J Neurol Neurosurg Psychiatry 2002,
73(6):701-704.
20. Costelloe L, O'Rourke K, Kearney H, McGuigan C, Gribbin L, Duggan
M, Daly L, Tubridy N, Hutchinson M: The patient knows best: sig-
nificant change in the physical component of the Multiple
Sclerosis Impact Scale (MSIS-29 physical). J Neurol Neurosurg
Psychiatry 2007, 78:841-844.
21. Riazi A, Hobart J, Lamping D, Fitzpatrick R, Thompson A:
Evidence-
based measurement in multiple sclerosis: the psychometric
properties of the physical and psychological dimensions of
three quality of life rating scales. Mult Scler 2003, 9:411-419.
22. Hoogervorst E, Zwemmer J, Jelles B, Polman C, Uitdehaag B: Multi-
ple Sclerosis Impact Scale (MSIS-29): relation to established
measures of impairment and disability. Mult Scler 2004,
10:569-574.
23. McGuigan C, Hutchinson M: The multiple sclerosis impact scale
(MSIS-29) is a reliable and sensitive measure. J Neurol Neuro-
surg Psychiatry 2004, 75(2):266-269.
24. Hobart J, Riazi A, Lamping D, Fitzpatrick R, Thompson A: How
responsive is the Multiple Sclerosis Impact Scale (MSIS-29)?
A comparison with some other self report scales. J Neurol
Neurosurg Psychiatry 2005, 76(11):1539-1543.
25. Ayatollahi P, Nafissi S, Eshraghian MR, Kaviani H, Tarazi A: Impact of
depression and disability on quality of life in Iranian patients
with multiple sclerosis. Mult Scler 2007, 13:275-277.
26. van der Linden FAH, Kragt JJ, Hobart JC, Klein M, Thompson AJ, van
der Ploeg HM, Polman CH, Uitdehaag BMJ: Proxy measurements
Publish with BioMed Central and every
scientist can read your work free of charge
"BioMed Central will be the most significant development for
disseminating the results of biomedical research in our lifetime."
Sir Paul Nurse, Cancer Research UK
Your research papers will be:
available free of charge to the entire biomedical community
peer reviewed and published immediately upon acceptance
cited in PubMed and archived on PubMed Central
yours — you keep the copyright
Submit your manuscript here:
/>BioMedcentral
Health and Quality of Life Outcomes 2009, 7:58 />Page 10 of 10
(page number not for citation purposes)
in multiple sclerosis: agreement between patients and their
partners on the impact of multiple sclerosis in daily life. J
Neurol Neurosurg Psychiatry 2006, 77(10):1157-1162.
27. Rasch G: Probabilistic models for some intelligence and
attainment tests. Volume Expanded edn. Chicago: The University of
Chicago Press; 1960.
28. Tennant A, McKenna SP, Hagell P: Application of Rasch Analysis
in the Development and Application of Quality of Life Instru-
ments. Value Health 2004:S22-S26.
29. Bond TG, Fox CM: Applying the Rasch model: fundamental
measurement in the human sciences. Mahwah, New Jersey:
Lawrence Erlbaum Associates; 2001.
30. DeVellis RF: Scale development: theory and applications. 2nd
edition. Thousand Oaks, CA: Sage Publications; 2003.
31. Pallant JF, Tennant A: An introduction to the Rasch measure-
ment model: An example using the Hospital Anxiety and
Depression Scale (HADS). Br J Clin Psychol 2007, 46(1):1-18.
32. McDonald WI, Compston A, Edan G, Goodkin D, Hartung HP, Lublin
FD, McFarland HF, Paty DW, Polman CH, Reingold SC, et al.: Rec-
ommended diagnostic criteria for multiple sclerosis: guide-
lines from the International Panel on the diagnosis of
multiple sclerosis. Ann Neurol 2001, 50(1):121-127.
33. Andrich D, Lyne A, Sheridan B, Luo G: Rasch Unidimensional
Measurement Models (RUMM2020 Version 4.0). Duncraig,
Western Australia: Rumm Laboratory Pty Ltd; 2003.
34. Tennant A, Conaghan PG: The Rasch Measurement Model in
Rheumatology: What is it and why use it? When should it be
applied, and what should one look for in a Rasch paper? Arthri-
tis Rheum 2007, 57(8):1358-1362.
35. Smith EV: Detecting and evaluating the impact of multidimen-
sionality using item fit statistics and principal component
analysis of residuals. Journal of Applied Measurement 2002,
3:205-231.
36. Tennant A, Pallant J: Unidimensionality matters! (A tale of two
Smiths?). Rasch Measurement Transactions 2006, 20(1):1048-1051.
37. Linacre JM: Sample size and item calibration stability. Rasch
Measurement Transactions 1994, 7(4):
328.
38. SPSS: SPSS Version 14.0. SPSS Inc; 2005.