báo cáo hóa học: " Fear of hypoglycaemia: defining a minimum clinically important difference in patients with type 2 diabetes" docx
Bạn đang xem bản rút gọn của tài liệu. Xem và tải ngay bản đầy đủ của tài liệu tại đây (273.17 KB, 8 trang )
BioMed Central
Page 1 of 8
(page number not for citation purposes)
Health and Quality of Life Outcomes
Open Access
Research
Fear of hypoglycaemia: defining a minimum clinically important
difference in patients with type 2 diabetes
Tom Stargardt*
1,2
, Linda Gonder-Frederick
3
, Karl J Krobot
4
and
Charles M Alexander
5
Address:
1
Health Services Management, Munich School of Management, Munich University, Germany,
2
Institute of Health Economics and Health
Care Management, Helmholtz Zentrum Munich, Germany,
3
Department of Psychiatry and Neurobehavioral Sciences, University of Virginia,
Charlottesville, VA, USA,
4
Outcomes Research, MSD Sharp & Dohme GMBH, Haar, Germany and
5
Outcomes Research, Merck & Co, Inc,
Whitehouse Station, NJ, USA
Email: Tom Stargardt* - ; Linda Gonder-Frederick - ;
Karl J Krobot - ; Charles M Alexander -
* Corresponding author
Abstract
Background: To explore the concept of the Minimum Clinically Important Difference (MID) of
the Worry Scale of the Hypoglycaemia Fear Survey (HFS-II) and to quantify the clinical importance
of different types of patient-reported hypoglycaemia.
Methods: An observational study was conducted in Germany with 392 patients with type 2
diabetes mellitus treated with combinations of oral anti-hyperglycaemic agents. Patients completed
the HFS-II, the Treatment Satisfaction Questionnaire for Medication (TSQM), and reported on
severity of hypoglycaemia. Distribution- and anchor-based methods were used to determine MID.
In turn, MID was used to determine if hypoglycaemia with or without need for assistance was
clinically meaningful compared to having had no hypoglycaemia.
Results: 112 patients (28.6%) reported hypoglycaemic episodes, with 15 patients (3.8%) reporting
episodes that required assistance from others. Distribution- and anchor-based methods resulted
in MID between 2.0 and 5.8 and 3.6 and 3.9 for the HFS-II, respectively. Patients who reported
hypoglycaemia with (21.6) and without (12.1) need for assistance scored higher on the HFS-II
(range 0 to 72) than patients who did not report hypoglycaemia (6.0).
Conclusion: We provide MID for HFS-II. Our findings indicate that the differences between having
reported no hypoglycaemia, hypoglycaemia without need for assistance, and hypoglycaemia with
need for assistance appear to be clinically important in patients with type 2 diabetes mellitus treated
with oral anti-hyperglycaemic agents.
Background
The goal of treatment of diabetes is to achieve glycemic
control in order to prevent long-term micro- and macro-
vascular complications. Due to the progressive nature of
beta cell failure in spite of treatment with anti-hyperglyc-
emic agents, HBA
1c
levels slowly rise even after an initial
fall in patients with type 2 diabetes [1-3]. Therefore an
increasing number of patients eventually need to be
Published: 22 October 2009
Health and Quality of Life Outcomes 2009, 7:91 doi:10.1186/1477-7525-7-91
Received: 3 June 2009
Accepted: 22 October 2009
This article is available from: />© 2009 Stargardt et al; licensee BioMed Central Ltd.
This is an Open Access article distributed under the terms of the Creative Commons Attribution License ( />),
which permits unrestricted use, distribution, and reproduction in any medium, provided the original work is properly cited.
Health and Quality of Life Outcomes 2009, 7:91 />Page 2 of 8
(page number not for citation purposes)
treated with combination medication regimens and/or
insulin [4,5].
One of the major challenges in the treatment of diabetes
is to achieve glycemic control while avoiding episodes of
hypoglycaemia [6-8]. Hypoglycaemia is due to excess
insulin levels in relation to circulating glucose. Etiologies
may include missed meals, physical activity, drug interac-
tions, or the anti-hyperglycaemic medication regimen
[6,7,9-12]. If untreated, hypoglycaemia may affect brain
function, both cognitive and motor. With severe hypogly-
caemia, convulsions, coma or death may occur [13,14].
Recurrent severe episodes of hypoglycaemia can lead to
behavioral changes [6], cognitive impairment [15], and
unawareness of hypoglycaemia [16]. Because of these neg-
ative consequences, patients may develop psychological
fear of hypoglycaemia. This fear can become phobic [17],
reduce quality of life [18], and impact adherence with dia-
betes management [7,12,13]. Fear of hypoglycaemia
decreases after interventions such as behavioral programs
and islet cell transplant surgery [19-21].
However, little is known about fear of hypoglycaemia in
patients with type 2 diabetes treated with combinations of
oral agents. This study therefore explores the concept of
the Minimum Clinically Important Difference (MID) for
the Worry Scale of the Hypoglycaemia Fear Survey (HFS-
II) in a large sample of patients with type 2 diabetes
treated with combinations of metformin and a sulphony-
lurea or metformin and a glitazone. According to the def-
inition of Jaeschke, et al., MID is "the smallest difference
in score [in the domain of interest] which patients per-
ceive as beneficial and which would mandate [in the
absence of troublesome side-effects and excessive cost] a
change in the patient's management" [22]. As even very
small absolute differences in patient-related outcomes
such as HFS-II can become statistically significant given
large group sizes, it is very important to find a threshold
that indicates whether a difference in score is clinically
meaningful or not [23].
This is the first study to develop a MID for fear of hypogly-
caemia. The MID was then used to quantify and evaluate
difference in HFS-II scores between patients who reported
no hypoglycaemic episodes, hypoglycaemic episodes
without need for assistance, and hypoglycaemic episodes
with need for assistance.
Methods
Setting and design
An observational multi-centre study was conducted in
Germany. Patients were recruited in a convenience sample
of 92 sites by their physicians, either GPs or diabetolo-
gists. Data were collected between October and December
2005. To be included, patients were required to be diag-
nosed with type 2 diabetes, 35 years or older, and had to
be treated during the 6 months prior to the study with
either a combination of metformin and a glitazone, or
with a combination of metformin and a sulphonylurea.
Patients were not eligible if they had been treated with
insulin in the past, were taking part in a clinical trial, or
were being treated for HIV or hepatitis. Data were col-
lected using medical records review and questionnaires.
Physicians were asked to provide information on the par-
ticipant's medical history, baseline laboratory measures,
and diabetes medications used during the six months
prior to the study. After informed consent, participants
completed the Treatment Satisfaction Questionnaire for
Medication version 1.4 (TSQM) [24], a socio-demo-
graphic questionnaire, and the Worry Scale of the HFS-II.
In addition, patients were asked about severity of
hypoglycaemic episodes during the previous six months.
Hypoglycaemia Fear Survey-II
The HFS-II is a 33-item questionnaire with two subscales
that measure 1) behaviours to avoid hypoglycaemia and
its negative consequences and 2) worries about hypogly-
caemia and its negative consequences. Responses are
made on a 5-point Likert scale where 0 = Never and 4 =
Always. This study used the 18-item Worry subscale which
has a score range of 0 - 72 with higher scores indicating
increased fear of hypoglycaemia. The HFS-II is a widely
used measure in clinical trials, has been translated into
more than 20 languages, and has demonstrated reliability
and validity [25,26].
Construction of MID
In general, studies have recommended using a variety of
methods to determine MID [27,28]. In this study, we used
a variety of established distribution-based and anchor-
based methods. With regard to distribution-based meth-
ods, we used the score's standard error of measurement,
the score's standard deviation multiplied by the square
root of 1 minus Cronbach's alpha [29,30], and multiples
of the score's standard deviation: 0.5, 0.20, 0.30, and 0.33
[23,27-29,31] to calculate MID. In addition, MID was
computed as 8% of the theoretical score ranges (HFS-II:
72 points) [28].
As one of the patient-based anchors, we used treatment
satisfaction to determine MID - due to its proximity to
self-reported treatment success. Our MID is based on the
assumption that patients who are not satisfied with their
treatment are more likely to either not adhere to medica-
tions, or to complain to their doctors, which in turn may
lead to a change in medications. We assume that treat-
ment satisfaction is closely related to self-reported treat-
ment success (i.e. 'worsening of condition' vs. 'no change
in condition' or 'small improvement' vs. 'no change'), a
concept that has been recommended to determine MID in
Health and Quality of Life Outcomes 2009, 7:91 />Page 3 of 8
(page number not for citation purposes)
many other studies [27,28,32]. Treatment satisfaction was
measured as the response to the seven-point scaled TSQM
question 14 'Taking all things into account, how satisfied
or dissatisfied are you with this medication'. The answer
categories that were less than 'satisfied' (e.g. 'somewhat
satisfied', 'dissatisfied', 'very dissatisfied', and 'extremely
dissatisfied') were combined as 'less than satisfied'. We
thus determined MID for the Worry Scale of HFS-II by tak-
ing the difference in score means between patients who
were 'satisfied' and patients who were 'less than satisfied'
with their medication. As negative side effects, especially
increased hypoglycaemia, may be also important and can
lead to decreased medication adherence or a change in
regimen, we also used responses to TSQM questions 6, 'To
what extent do the side effects interfere with your physical
health and ability to function', and TSQM question 8, 'To
what degree have medication side effects affected your sat-
isfaction with the medication', as anchors to determine
MID. However, questions 6 and 8 of the TSQM were only
answered by the smaller subsample of patients that expe-
rienced side-effects. Difference in means of the Worry
Scale of HFS-II of patients who stated that they were
'somewhat' affected and patients that stated that they were
'quite a bit' or 'a great deal' affected were compared.
Severity and fear of hypoglycaemia
According to the recommendations of the American Dia-
betes Association [16], severity of hypoglycaemic episodes
were categorized as 1) mild (little or no interruption of
activities; no treatment assistance needed), 2) moderate
(some interruption of activities; no assistance needed)
and 3) severe (assistance of a third party needed). A fourth
category, very severe hypoglycaemia, was added to capture
episodes that required medical assistance. In the question-
naire, the different levels of severity of hypoglycaemia
were defined for the patients who were asked if they expe-
rienced any of the four severity categories of hypoglycae-
mia during the last 6 month. If a patient reported episodes
of hypoglycaemia at different levels of severity, the patient
was classified according to the most severe episode
reported. Following recommendations by other studies
[11,12,16,33], the categories mild and moderate were
aggregated to 'hypoglycaemia without need for assistance'
and the categories severe and very severe were aggregated
to 'hypoglycaemia with need for assistance'. Results for
MID were then applied to evaluate whether the difference
between not having hypoglycaemic episodes and having
different levels of severity of hypoglycaemic episodes is
clinically important in this study population. In addition
the mean scores of the Worry Scale of HFS-II for patients
who reported hypoglycaemic episodes during the last six
month were compared to patients who did not report
hypoglycaemic episodes. One-way analysis of variance
and Tukey's honestly significant differences test were used
to test for statistical significance of differences in mean
scores. A p-value of 0.05 was considered statistically sig-
nificant. We also calculated Cohen's d statistics as a
marker of effect size for differences in HFS-II. Statistical
analyses were conducted using SAS version 9.1.3.
Results
From 402 patients recruited at 92 sites, two were excluded
because they did not meet inclusion or exclusion criteria,
and eight were excluded because they had not fully com-
pleted the Worry Scale of HFS-II. The final study popula-
tion thus comprised 392 patients, of whom 268 patients
were treated with metformin and a sulphonylurea, and
107 patients with metformin and a glitazone. For 17
patients it was unknown which of the two medication reg-
imens they were on. As the differences between patients
treated with metformin and a sulphonylurea and patients
treated with metformin and a glitazone did not reach sta-
tistical significance for hypoglycaemia (p = 0.1127) or
HFS-II scores (p = 0.5222), the medication groups were
combined for subsequent analysis.
Patient characteristics
Mean age (SD) of the study population was 62.7 (10.6)
years. 42.6% were female. 28.9% of patients had a history
of macrovascular complications, while 16.4% had a his-
tory of microvascular complications. Further details are
given in table 1. Average score (SD) of the Worry Scale of
HFS-II for the entire sample was 8.06 (10.4), with a min-
imum of 0 and a maximum of 51. While 125 patients
were extremely satisfied with their medication (TSQM
question on treatment satisfaction), 113 patients, 100
patients, and 44 patients reported being 'very satisfied',
'satisfied', and 'somewhat satisfied' with their medication,
respectively. The number of patients who were 'dissatis-
Table 1: Patient characteristics
Mean (SD)
Age, years 62.7 (10.6)
Gender
Female 42.6%
Male 57.4%
Married 62.8%
HBA
1c
7.24 (1.23)
HBA
1c
at goal [6.5%] 29.1%
Weight (kg) 87.3 (15.8)
BMI (kg/m
2
) 29.6 (4.6)
History of complications
Macrovascular 28.9%
Microvascular 16.4%
Duration of diabetes, years
<4 15.1%
4-6 24.6%
7-9 31.7%
> 9 28.6%
Health and Quality of Life Outcomes 2009, 7:91 />Page 4 of 8
(page number not for citation purposes)
fied', 'very dissatisfied', and 'extremely dissatisfied' were
only 4, 5, and 1, respectively.
Construction of MID
MIDs determined according to distribution-based meth-
ods varied widely (see table 2). While the MID for the
Worry Scale of HFS-II based on the standard error of
measurement was 2.0, MID based on 8% of the theoreti-
cal score range was 5.8. MIDs based on 0.2, 0.30, 0.33 and
0.5 multiplied by standard deviation, respectively, varied
between 2.1 and 5.2 for the Worry Scale of HFS-II.
Mean score (+/- SD, n = number of patients in category)
of the Worry Scale of HFS-II by satisfaction with treatment
was 5.3 (+/- 7.0, n = 125) for patients who were extremely
satisfied, 7.6 (+/- 9.4, n = 113) for patients who were very
satisfied, 9.4 (+/- 11.7, n = 100) for patients who were sat-
isfied, 13.5 (+/- 14.4, n = 44) for patients who were some-
what satisfied, 16.5 (+/- 13.0, n = 4) for patients who were
dissatisfied, 8.4 (+/- 12.8, n = 5) for patients who were
very dissatisfied, and 2.0 for a single patient who was
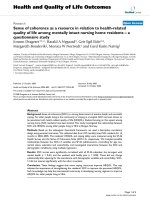
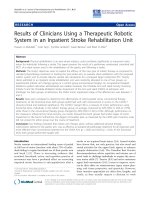
extremely dissatisfied. Comparing mean scores of the
Worry Scale of HFS-II for patients who were less than sat-
isfied with patients who were satisfied resulted in an MID
of 3.6 (see figure 1).
Using the TSQM questions on side effects (questions 6
and 8) resulted in a MID for the HFS-II Worry Scale of 3.6
and 3.9, respectively. The MIDs are based on the answers
of 29 patients who were 'somewhat' affected vs. 12
patients who were 'a great deal' or 'quite a bit' affected for
TSQM question 6 and on 15 vs. 31 patients for TSQM
question 8.
Severity and fear of hypoglycaemia
112 patients (28.6% of total sample) reported episodes of
hypoglycaemia during the previous 6 months. While 51
and 46 patients reported mild and moderate episodes of
hypoglycaemia, 9 and 6 patients reported severe and very
severe episodes of hypoglycaemia, respectively. Thus
among those reporting hypoglycaemia, 86.6% reported
hypoglycaemia without the need for treatment assistance,
while 13.4% reported hypoglycaemia with need for assist-
ance. The mean Worry Scale of HFS-II was 6.0 (SD 8.2,
95% CI [5.0; 6.9]) for patients who did not report
hypoglycaemic episodes during the previous 6 months,
and 13.3 (SD 13.4, 95% CI [10.8; 15.8]) for patients who
reported hypoglycaemia during the previous 6 months.
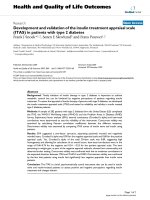
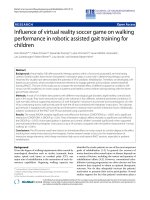
The crude difference in the Worry Scale of HFS-II between
patients who reported no hypoglycaemia and hypoglycae-
mia without need for treatment assistance was 6.1 (p =
0.0001, Cohen's d = -0.65 [SD 0.12]). HFS-II scores were
also higher in patients who reported hypoglycaemia with
need for assistance compared to those who reported
hypoglycaemia without need for assistance (p = 0.0100,
Cohen's d = -0.74 [SD 0.28]). The size of these effects was
generally larger than the MIDs determined by anchor- or
distribution-based methods (see figure 2).
Discussion
HFS-II scores in this study and for this patient group
reflected the expected patterns in fear of hypoglycaemia.
Patients who reported hypoglycaemia showed more fear
than those who did not, and patients who reported more
severe episodes of hypoglycaemia showed more fear that
those who reported less severe episodes. Based on the
MID results of this study, the difference in the Worry Scale
of the HFS-II between not having and having reported
hypoglycaemia without the need for assistance appears to
be clinically meaningful to patients. This is particularly
relevant because the vast majority of episodes of hypogly-
caemia reported in this study were those which patients
managed themselves without the need for assistance from
others.
To determine MID, two classes of methods have been dis-
cussed in the literature, distribution-based methods and
anchor-based methods [34]. Distribution-based methods
are based on mathematical calculations that involve
standard deviation, score range or Cronbach's alpha.
Table 2: Distribution- and anchor-based MIDs for the Worry Scale of HFS-II.
Method MID for HFS-II
Distribution-based MIDs
Standard deviation multiplied by 0.2 2.1
Standard deviation multiplied by 0.3 3.1
Standard deviation multiplied by 0.33 3.4
Standard deviation multiplied by 0.5 5.2
8% of theoretical score range 5.8
Standard error of measurement 2.0
Anchor-based MIDs
Satisfaction with medication (TSQM question 14) 3.6
Impact of side effects on physical health (TSQM question 6) 3.6
Impact of side effects on satisfaction with medication (TSQM question 8) 3.9
Health and Quality of Life Outcomes 2009, 7:91 />Page 5 of 8
(page number not for citation purposes)
Anchor-based methods are based on judgment of treat-
ment success [35]. Among the group of anchor-based
methods, either physician- or patient-based anchors can
be applied. While distribution-based methods that
involve calculations with the standard deviation, also
depend on the heterogeneity of the study population [23],
anchor-based methods critically depend on the validity of
patients' rating [23] and on choosing response categories
that reflect the importance of a change. No gold standard
for determining MID currently exists. Therefore we fol-
lowed the suggestion of Guyatt et al. 2002 that is more
accurately to report a range of MID retrieved by different
approaches than to recommend a single MID.
Wells et al., had patients compare their own health status
with that of their peers. MID was calculated from the dif-
ference in score between patients who felt 'somewhat bet-
ter than other patients' and patients who felt 'about the
same' [32]. Another approach is to have patients rate their
own improvement due to treatment. Depending on the
disease, MID is then calculated as the difference in mean
scores between patients who report a 'small improvement'
and those who felt 'a little worse', or between patients
who report a 'small improvement' and those who
reported 'no change' [22,23,29,36]. Walters and Brazier
surveyed change in condition over time to establish a MID
for quality of life measures, calculated as the changes in
score means between patients reporting 'an improvement'
and those reporting 'no change' in condition [31]. In our
study, one of the anchors chosen to determine MID was
based on treatment satisfaction ('less than satisfied' vs.
'satisfied') which we considered closely related to the con-
struct of self-reported treatment success ('no change' vs.
'small improvement') frequently recommended for stud-
ies that examine treatment effects [27,30].
The results for the MID using TSQM question 14 on treat-
ment satisfaction (3.6) and TSQM questions 6 and 8 on
side effects (3.6 and 3.9) were relatively consistent.
Anchor-based MID estimates of the HFS-II were well
within the range obtained from distribution-based meth-
ods. However, compared to the MID based on treatment
satisfaction (n = 154), the MID's based on side effects
were derived from the smaller number of patients (n = 29)
who reported side effects. Also, hypoglycaemia does not
appear to have been the only source for variation in treat-
ment satisfaction. Hypoglycaemia may not have been the
only side effect experienced by patients. For these reasons,
these results should be considered exploratory. The unex-
pected low HFS scores for patients who were 'very dissat-
isfied' (5 patients, HFS-II 12.8) and 'extremely dissatisfied'
(1 patient, HFS-II 2.0) compared to patients who were
'dissatisfied' (4 patients, HFS-II 16.5) or 'somewhat satis-
fied' (44 patients, HFS-II 13.5) may be due in part to the
low number of patients in the categories. Another expla-
nation is that perhaps these patients did not adhere to
Mean score of the Worry Scale of HFS-II, by TSQM question 14 on treatment satisfaction, and definition of an anchor-based MIDFigure 1
Mean score of the Worry Scale of HFS-II, by TSQM question 14 on treatment satisfaction, and definition of an
anchor-based MID.
13.0
9.4
7.6
5.3
0.0
2.0
4.0
6.0
8.0
10.0
12.0
14.0
16.0
less than satisfied satisfied very satisfied extremely statisfied
54
100
113 125N. Obs.
MID=13.0 – 9.4= 3.6
Health and Quality of Life Outcomes 2009, 7:91 />Page 6 of 8
(page number not for citation purposes)
their prescribed medication regimen due to their dissatis-
faction and, therefore, had less risk of hypoglycaemia.
While the response categories 'extremely dissatisfied',
'very dissatisfied', 'dissatisfied', and 'somewhat satisfied'
were aggregated to 'less than satisfied', we did not aggre-
gate the other response categories of the TSQM question
on treatment satisfaction. In our opinion, aggregating 'sat-
isfied', 'very satisfied', and 'extremely satisfied' and com-
paring these patients to patients 'less than satisfied' would
have no longer constituted a minimum clinically impor-
tant difference [27].
It is important to note, however, that our MID estimates
may not apply to other types of patients with diabetes
[37]. Patients in this study had type 2 diabetes managed
by combined oral anti-hyperglycemic medications, and
the majority of them (71%) reported no hypoglycaemic
episodes in the previous 6 months. Less than 4% reported
severe or very severe episodes. Different MID estimates
would likely be generated in the subgroup of patients with
type 1 diabetes who experience frequent, recurrent epi-
sodes of severe hypoglycaemia. Nonetheless, the results of
this study suggest that fear of hypoglycaemia, as measured
by the HFS-II, can be a useful outcome variable in diabetes
health services research, and that even relatively small dif-
ferences in scores can be clinically meaningful to patients
with type 2 diabetes mellitus using oral anti-hyperglyc-
emic medications.
Observational studies can provide valuable information
on effectiveness due to real-world settings and larger study
populations [38,39]. However, self-reported outcomes
from a large number of sites also introduce bias and limi-
tations. The participating physicians may not have always
had complete knowledge about parallel prescriptions to
their patients and patient's visits to other physicians or
hospitals. Eventually, this might have led to incomplete
data on patient's medical history, or inclusion of patients
who would have otherwise been excluded. Episodes of
hypoglycaemia were most likely underreported in our
study population, since many patients with diabetes may
not always recall or recognize symptoms of hypoglycae-
mia [6,10,17], or may have limited knowledge about
hypoglycaemia itself [40].
Conclusion
The methodological approach suggested in this study
might also be applicable to other patient reported out-
comes, in particular, when the MID cannot be based on
treatment success. By using the concept of MID, it could
be shown that the difference between having reported no
hypoglycaemia and having reported hypoglycaemia with-
out need for assistance is clinically meaningful to patients
with type 2 diabetes mellitus on oral anti-hyperglycaemic
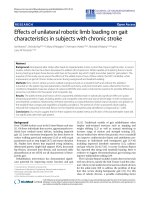
Mean score (+/- SD) of the Worry Scale of HFS-II, by severity of hypoglycaemiaFigure 2
Mean score (+/- SD) of the Worry Scale of HFS-II, by severity of hypoglycaemia.
6.0
12.1
21.6
0.0
5.0
10.0
15.0
20.0
25.0
reported no episode of
hypoglycaemia
reported hypoglycaemia without
need for assistance
reported hypoglycaemia
with need for assistance
(+/- 12.3)
(+/- 8.2)
(+/- 16.2)
Health and Quality of Life Outcomes 2009, 7:91 />Page 7 of 8
(page number not for citation purposes)
agents. Whether the MID estimates for HFS scores found
in this study are applicable to different types of diabetes
patients, countries, and cultures should be subject of
future research.
Conflict of interests statement
TS was on a research fellowship sponsored by Merck &
Co., Inc, by the time the article was written. LGF has been
working under a consultancy agreement for Merck & Co.,
Inc. LGF has also worked under consultancy agreements
or received research grants from Abbott Diabetes Care,
Abbott Labs. KJK and CA are employees of Merck & Co.,
Inc.
Authors' contributions
KJK conceived the idea to write this paper. TS analyzed the
data and drafted the first version of the manuscript. All
authors contributed to the conception and design of the
study, to interpreting the data, and to writing the manu-
script. All authors read and approved the final manu-
script.
References
1. Cook MN, Girman CJ, Stein PP, Alexander CM, Holman RR: Glyc-
emic control continues to deteriorate after sulfonylureas are
added to metformin among patients with type 2 diabetes.
Diabetes Care 2005, 28:995-1000.
2. Nathan DM, Buse JB, Mayer BD, Heine RJ, Holman RR, Sherwin R, et
al.: Management of hyperglycemia in type 2 diabetes: a con-
sensus algorithm for the initiation and adjustment of ther-
apy. Diabetes Care 2006, 29:1963-1972.
3. Cook MN, Girman CJ, Stein PP, Alexander CM: Initial mono-
therapy with either metformin or sulphonylureas often fails
to achieve or maintain current glycaemic goals in patients
with type 2 diabetes in UK primary care. Diabet Med 2007,
24:350-358.
4. Home PD, Jones NP, Pocock SJ, Beck-Nielsen H, Gomis R, Hanefeld
M, et al.: Rosiglitazone RECORD study: glucose control out-
comes at 18 months. Diabet Med 2007, 24:626-634.
5. Charbonnel B, Schernthaner G, Brunetti P, Matthews DR, Tan MH,
Hanefeld M: Long-term efficacy and tolerability of add-on
pioglitazone therapy to failing monotherapy compared with
addition of gliclazide or metformin in patients with type 2
diabetes. Diabetologia 2005, 48:1093-1104.
6. Chelliah A, Burke MR: Hypoglycemia in elderly patients with
diabetes mellitus. Drugs & Aging 2004, 21:511-530.
7. Davis S, Alonso MD: Hypoglycemia as a barrier to glycemic
control. J Diabetes Complications 2004, 18:60-68.
8. Amiel SA, Dixon T, Mann R, Jameson K: Hypoglycaemia in type 2
diabetes. Diabet Med 2008, 25:245-254.
9. Banarer S, Cryer PE: Gypoglycemia in type 2 diabetes. The Med-
ical Clinics of North America 2004, 88:1107-1116.
10. Boyle PJ, Zrebiec J: Physiological and behavioral aspects of gly-
cemic control and hypoglycemia in diabetes. South Med J 2007,
100:175-182.
11. Murata GH, Duckworth WC, Shah JH, Wendel CS, Mohler MJ, Hoff-
mann RM: Hypoglycemia in stable, insulin-treated verterans
with type 2 diabetes, a retrospective study of 1662 episodes.
J Diabetes Complications 2005, 19:10-17.
12. Zammitt NN, Frier BM: Hypoglycemia in type 2 diabetes. Dia-
betes Care 2005, 28:2948-2961.
13. Frier BM: Hypoglycemia and cognitive function in diabetes. Int
J Clin Pract 2001, S123:30-37.
14. Rosenthal JM, Amiel SA, Yágüez L, Bullmore E, Hopkins D, Evans M,
et al.: The effect of acute hypoglycemia on brain function and
activation. Diabetes 2001, 50:1618-1626.
15. Whitmer RA, Karter AJ, Yaffe K, Quesenberry CP Jr, Selby JV:
Hypoglycemic episodes and risk of dementia in older
patients with type 2 diabetes mellitus. JAMA 2009,
301:1565-1572.
16. American Diabetes Association Workgroup on Hypoglycemia:
Defining and reporting hypoglycemia in diabetes. Diabetes
Care 2005, 28:1245-1249.
17. Boyle PJ, Zrebiec J: Management of diabetes-related hypoglyc-
emia. South Med J 2007, 100:183-194.
18. Nattrass M, Lauritzen T: Review of prandial glucose regulation
with reaglinide: a solution to the problem of hyoglycemia in
the treatment of type 2 diabetes. Int J Obes 2000, 24:21-31.
19. Gonder-Frederick L, Cox DJ, Clarke W, Julian D: Blood glucose
awareness training. In Psychology in diabetes Care Edited by: Snoek
FJ, Skinner TC. New York: Wiley; 2000:169-206.
20. Cox DJ, Gonder-Frederick L, Polonsky W, Schlundt D, Kovatchev B,
Clarke W: Blood glucose awareness training (BGAT-2): Long-
term benefits. Diabetes Care 2001, 24:638-42.
21. Johnson JA, Kotovych M, Ryan EA, Shapiro AM: Reduced fear of
hypoglycemia in successful islet transplantation. Diabetes Care
2004, 27:624-25.
22. Jaeschke R, Singer J, Guyatt DH: Measurement of health status:
ascertaining the minimal clinically important difference. Con-
trol Clin Trials 1989, 10:407-415.
23. Guyatt GH, Osoba D, Wu AW, Wyrwich KW, Norman GR, the clin-
ical significance consensus meeting group: Methods to explain the
clinical significance of health status measures. Mayo Clin Proc
2002, 77:371-383.
24. Atkinson MJ, Sinha A, Hass SL, Colman SS, Kumar RN, Brod M, et al.:
Validation of a general measure of treatment satisfaction,
the Treatment Satisfaction Questionaire for Medication
(TSQM), using a national panel study of chronic disease.
Health and Quality of Life Outcomes 2004, 2:1-13.
25. Cox DJ, Irvine A, Gonder-Frederick L, Nowacek G, Butterfield J:
Fear of hypoglycemia: quantification, validation and utiliza-
tion. Diabetes Care 1987, 10:617-621.
26. Irvine A, Cox DJ, Gonder-Frederick L: The Fear of hypoglycemia
scale. In Handbook of psychology and diabetes: a guide to psychological
measurement and diabetes research and practice Edited by: Bradley C.
Langhorne: Hardwood Academia Publishing; 1994:133-158.
27. Revicki DA, Hays RD, Cella D, Sloan JA: Recommended methods
for determining responsiveness and minimally important dif-
ferences for patient-reported outcomes. J Clin Epidemiol 2008,
61:102-9.
28. U.S. Department of Health and Human Services FDA Center for Drug
Evaluation and Research, U.S. Department of Health and Human Serv-
ices FDA Center for Biologics Evaluation and Research, U.S. Depart-
ment of Health and Human Services FDA Center for Devices and
Radiological Health: Guidance for industry: patient-reported
outcome measures: use in medical product development to
support labelling claims. Health and Quality of Life Outcomes 2006,
4:1-20.
29. Yost KJ, Cella D, Chawla A, Holmgren E, Eton DT, Ayanian JZ, et al.:
Minimally important differences were estimated for the
Functional Assessment of Cancer Therapy-Colorectal
(FACT-C) instrument using a combination of distribution-
and anchor-based approaches. J Clin Epidemiol 2005,
58:1241-1251.
30. Beaton D, Bombardier C, Katz JN, Wright JG, Wells GA, Boers M, et
al.: Looking for important change/differences in studies of
responsiveness. The Journal of Rheumatology 2001, 28:
400-405.
31. Walters SJ, Brazier JE: Comparison of the minimally important
difference for two health state utility measures: EQ-5D and
SF-6d. Qual Life Res 2005, 14:1523-1532.
32. Wells GA, Tugwell P, Kraag GR, Baker PRA, Groh J, Redelmeier DA:
Minimum important difference between patients with rheu-
matoid arthitis: the patient's perspective. The Journal of Rheu-
matology 1993, 20:557-560.
33. Leese GP, Wang J, Broomhall J, Kelly P, Marsden A, Morrison W, et
al.: Frequency of severe hypoglycemia requiring emergency
treatment in type 1 and type 2 diabetes. Diabetes Care 2003,
26:1176-1180.
34. Lydick E, Epstein R: Interpretation of quality of life changes.
Qual Life Res 1993, 2:221-6.
35. Marquis P, Chassany O, Abetz L: A comprehensive strategy for
the interpretation of quality-of-life data based existing meth-
ods. Value in Health 2004, 7:93-104.
Publish with BioMed Central and every
scientist can read your work free of charge
"BioMed Central will be the most significant development for
disseminating the results of biomedical research in our lifetime."
Sir Paul Nurse, Cancer Research UK
Your research papers will be:
available free of charge to the entire biomedical community
peer reviewed and published immediately upon acceptance
cited in PubMed and archived on PubMed Central
yours — you keep the copyright
Submit your manuscript here:
/>BioMedcentral
Health and Quality of Life Outcomes 2009, 7:91 />Page 8 of 8
(page number not for citation purposes)
36. Wells GA, Beaton D, Shea B, Boers M, Simon L, Strand V, et al.: Min-
imal clinically important differences: review of methods. The
Journal of Rheumatology 2001, 28:406-412.
37. Norquist J, Girman C, Santanello N: Some considerations for the
interpretation of health-related quality of life data. Value in
Health 2005, 8:80-81.
38. Riedel A, Heien H, Wogen J, Plauschinat C: Loss of glycemic con-
trol in patients with type 2 diabetes mellitus who were
receiving initial metformin, sulfonylurea, or thiazolidinedi-
one monotherapy. Pharmacotherapy 2007, 27:1102-1110.
39. McKee M, Brotton A, Black N, McPherson K, Sanderson C, Bain C:
Methods in health services research: Interpreting the evi-
dence: choosing between randomised and non-randomised
studies. BMJ 1999, 319:312-315.
40. Murata GH, Hoffmann RM, Shah JH, Wendel CS, Duckworth WC: A
probabilistic model for predicting hypoglycemia in type 2
diabetes mellitus. Arch Intern Med 2004, 164:1445-1450.