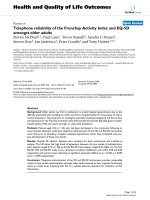
báo cáo hóa học: " Measurement properties of the Dizziness Handicap Inventory by cross-sectional and longitudinal designs" docx
Bạn đang xem bản rút gọn của tài liệu. Xem và tải ngay bản đầy đủ của tài liệu tại đây (801.45 KB, 16 trang )
BioMed Central
Page 1 of 16
(page number not for citation purposes)
Health and Quality of Life Outcomes
Open Access
Research
Measurement properties of the Dizziness Handicap Inventory by
cross-sectional and longitudinal designs
Anne-Lise Tamber*
1,2
, Kjersti T Wilhelmsen
3,4,5
and Liv Inger Strand
5
Address:
1
Faculty of Health Sciences, Oslo University College, Norway,
2
Institute of General Practice and Community Medicine, Faculty of
Medicine, University of Oslo, Norway,
3
Department of Physiotherapy, Bergen University College, Norway,
4
National Centre of Vestibular
Disorders, Department of Otorhinolaryngology/Head and Neck Surgery, Haukeland University Hospital, Bergen, Norway and
5
Department of
Public Health and Primary Health Care, Section for Physiotherapy Science, University of Bergen, Norway
Email: Anne-Lise Tamber* - ; Kjersti T Wilhelmsen - ;
Liv Inger Strand -
* Corresponding author
Abstract
Background: The impact of dizziness on quality of life is often assessed by the Dizziness Handicap
Inventory (DHI), which is used as a discriminate and evaluative measure. The aim of the present study was
to examine reliability and validity of a translated Norwegian version (DHI-N), also examining
responsiveness to important change in the construct being measured.
Methods: Two samples (n = 92 and n = 27) included participants with dizziness of mainly vestibular origin.
A cross-sectional design was used to examine the factor structure (exploratory factor analysis), internal
consistency (Cronbach's α), concurrent validity (Pearson's product moment correlation r), and
discriminate ability (ROC curve analysis). Longitudinal designs were used to examine test-retest reliability
(intraclass correlation coefficient (ICC) statistics, smallest detectable difference (SDD)), and
responsiveness (Pearson's product moment correlation, ROC curve analysis; area under the ROC curve
(AUC), and minimally important change (MIC)). The DHI scores range from 0 to 100.
Results: Factor analysis revealed a different factor structure than the original DHI, resulting in dismissal
of subscale scores in the DHI-N. Acceptable internal consistency was found for the total scale (α = 0.95).
Concurrent correlations between the DHI-N and other related measures were moderate to high, highest
with Vertigo Symptom Scale-short form-Norwegian version (r = 0.69), and lowest with preferred gait (r
= - 0.36). The DHI-N demonstrated excellent ability to discriminate between participants with and without
'disability', AUC being 0.89 and best cut-off point = 29 points. Satisfactory test-retest reliability was
demonstrated, and the change for an individual should be ≥ 20 DHI-N points to exceed measurement
error (SDD). Correlations between change scores of DHI-N and other self-report measures of functional
health and symptoms were high (r = 0.50 - 0.57). Responsiveness of the DHI-N was excellent, AUC = 0.83,
discriminating between self-perceived 'improved' versus 'unchanged' participants. The MIC was identified
as 11 DHI-N points.
Conclusions: The DHI-N total scale demonstrated satisfactory measurement properties. This is the first
study that has addressed and demonstrated responsiveness to important change of the DHI, and provided
values of SDD and MIC to help interpret change scores.
Published: 21 December 2009
Health and Quality of Life Outcomes 2009, 7:101 doi:10.1186/1477-7525-7-101
Received: 12 March 2009
Accepted: 21 December 2009
This article is available from: />© 2009 Tamber et al; licensee BioMed Central Ltd.
This is an Open Access article distributed under the terms of the Creative Commons Attribution License ( />),
which permits unrestricted use, distribution, and reproduction in any medium, provided the original work is properly cited.
Health and Quality of Life Outcomes 2009, 7:101 />Page 2 of 16
(page number not for citation purposes)
Background
The Dizziness Handicap Inventory (DHI) is used in clini-
cal work and in research to assess the impact of dizziness
on quality of life. The self-report questionnaire was origi-
nally designed to quantify the handicapping effect of diz-
ziness imposed by vestibular system disease [1], but has
also been used for persons with dizziness of other origins
[2-5]. The original American version has been translated
and adapted to several languages and cultures, like Swed-
ish [6], Chinese [7], and Dutch [8]. Translation of the DHI
has also been demanded by clinicians and researchers in
Norway.
Items included in the DHI were originally derived from
case histories of patients with dizziness, and the measure
was further examined in several studies involving patients
seen for vestibulometric testing [1]. The DHI contains 25
items, and a total score (0-100 points) is obtained by sum-
ming ordinal scale responses, higher scores indicating
more severe handicap. The scale was developed to capture
various sub-domains of self-perceived handicap and com-
prises 7 physical, 9 functional, and 9 emotional questions
[1]. Later studies of the underlying factor structure of the
DHI failed to support the empirically developed sub-
domains [9-11], which was also adressed in a recent
review article [12].
High internal consistency has been demonstrated for the
total scale as well as for the subscales [1]. Validity of the
DHI was indicated as higher scores were associated with
higher frequency of dizziness [1] and with greater func-
tional impairments [13]. Concurrent validity has been
examined in several studies, presenting variable results
[14-16]. Satisfactory test-retest reliability has been dem-
onstrated for the total scale as well as for the subscales,
and a change in the DHI total score should decrease by at
least 18-points in individual patients to be called a true
change [1]. The ability of the DHI to measure meaningful
or clinically important change, has scarcely been exam-
ined [12], and variable results regarding the ability of the
DHI to discriminate between treatment and control
groups, have been found in randomized controlled trials
[17-25]. The ability to detect real change in the concept
being measured, or the ability to distinguish between par-
ticipants who have and have not changed an important
amount [26,27], have not been reported.
Valuable information can be derived in the clinic from
tools assessing self-perceived consequences of dizziness,
presupposed satisfactory measurement properties. After
translating the DHI into Norwegian, the aim of the
present study was to examine reliability and validity of the
translated version, which was to be used as a descriptive
and evaluative measure. Responsiveness to important
change in the construct being measured was included, as
this has not been reported in the original DHI. Regarding
construct validity and responsiveness, the hypotheses of
correlations between scores of the DHI Norwegian version
and other related measures, are defined in Methods (Sta-
tistical analysis).
Methods
Translation
The translation followed international guidelines through
a process of reviews and modification [28,29]. Permission
to translate the DHI into Norwegian was granted by Gary
P. Jacobson, one of the test developers [1]. Translations
from American to Norwegian were made separately by
two physiotherapists familiar with dizzy patients and
knowledgeable in American and English. The translated
versions were discussed, and adjusted to obtain consensus
and close equivalence with the original version [29]. Back-
translation was performed by a bilingual person with Nor-
wegian and English at a professional academic level, and
with English as a native language. The original and the
back-translated English versions were compared by the
three translators, and if discrepancies were found, the
Norwegian version was adjusted to optimize conceptual
overlap [30]. The translated version was pilot tested on a
few Norwegian speaking patients with dizziness (n = 4),
and no particular problems were met regarding answering
the questions. The DHI in a Norwegian version (DHI-N)
is presented in Additional file 1, the sequence of rating
alternatives in line with Jacobson & Newman [31]: Yes =
4, Sometimes = 2, No = 0.
Design
A cross-sectional design was used to examine internal con-
sistency and aspects of validity, and longitudinal designs
were used to examine test-retest reliability and responsive-
ness.
Participants
Sample 1
Potential participants with complaints of dizziness from
the Oslo-Akershus region were recruited from General
Practice, ENT-specialists and the National Insurance
Administration (NIA 2003-2004). They received written
information about the project during the doctoral visit,
and/or by mail from the NIA, if registered with sick leave
because of dizziness during the last year. Inclusion criteria
were dizziness, age range 20-65 years, ability to read and
understand Norwegian language, and living in the Oslo-
Akershus region. Exclusion criteria were dizziness because
of cardio-vascular disease, neurological or other severe
system diseases, and not being able to answer the ques-
tionnaires or go through physical tests. Of the 112 indi-
viduals who volunteered for the study, 14 did not meet
the inclusion criteria, i.e. 98 participants were included.
Health and Quality of Life Outcomes 2009, 7:101 />Page 3 of 16
(page number not for citation purposes)
Sample 2
Patients between the ages of 18-70 years, examined in a
balance clinic at Haukeland University Hospital, Bergen
during the period of 2003-2005 were included provided
that their medical examination, which included standard
laboratory tests, suggested uncompensated vestibular
function as a consequence of vestibular neuronitis. Exclu-
sion criteria were evidence of central vestibular disorder or
progressive vestibular pathology, including Ménière's dis-
ease, genetic hearing loss and/or neurological/muscu-
loskeletal/visual/psychiatric disorders. Thirty-six patients
were included, 32 of these were asked to participate in the
reliability study.
The study was performed in accordance with the Helsinki
Declaration. Written informed consent was obtained
from all participants. The participants in sample 1 were
part of a larger study approved by the Regional Commit-
tee for Medical Research Ethics, Health Region South,
Norway. The participants in sample 2 were part of a larger
study approved by the Regional Committee for Medical
Research Ethics West, Norway.
Measures
The DHI is intended to measure the handicapping effects
of dizziness on physical, emotional and functional sub-
domains [1]. To examine validity and responsiveness of
the DHI-N, the following condition specific and generic
measures were included, all considered to be more or less
associated with the DHI-N:
Vertigo Symptom Scale - short form (VSS-sf) is a condition
specific questionnaire assessing perceived severity of ver-
tigo symptoms during the last month by measuring fre-
quency of dizziness, vertigo, imbalance and related
autonomic symptoms (nausea, sweating, etc.) [32]. The
scale includes 15 items, comprising two sub-scales indi-
cating the relative impact of vertigo and balance (VSS-sf-
V, 8 items) and autonomic/anxiety (VSS-sf-A, 7 items) on
the total score [32,33]. Five ordinal response categories
range from 'never' (score 0) to 'very often (most days)'
(score 4), and give a total score ranging from 0 to 60, the
VSS-sf-V ranges 0-32, and VSS-sf-A ranges 0-28, higher
scores indicating more severe symptoms [32]. The Norwe-
gian version of the VSS-sf used in the present study (VSS-
sf-N), has demonstrated satisfactory psychometric proper-
ties [34].
COOP/WONCA is a generic assessment tool measuring
perceived functional health status referring to the last two
weeks. Six charts, each with one question, have five ordi-
nal response categories: 1 is best and 5 is worst function-
ing. The charts include 'physical fitness' (A. What was the
hardest physical activity you could do for at least 2 minutes?),
'feelings' (B. How much have you been bothered by emotional
problems such as feeling anxious, depressed, irritable or down-
hearted and sad?), 'daily activities' (C. How much difficulty
have you had doing your usual activities or tasks, both inside
and outside the house because of your physical and emotional
health?), 'social activities' (D. Has your physical and emo-
tional health limited your social activities with family, friends,
neighbours or groups?), 'changes in health' (E. How would
you rate your overall health now compared to 2 weeks ago?),
and 'overall health' (F. How would you rate your health in
general?) [35]. Scores are derived from each individual
chart (range 1-5), or as a sum score (range 5-25) of 5
charts (excluding chart E: changes in health) [35,36]. Sat-
isfactory measurement properties have been reported in
different patient populations [35,37,38], also in the Nor-
wegian version [39-42].
The Disability Scale is a global self-report measure, and
used to assess disability in connection with dizziness [43].
The scale does not refer to any time period. It is scored on
a 6-point ordinal scale: 0 = 'no disability; negligible symp-
toms', 1 = 'no disability; bothersome symptoms', 2 = 'mild
disability; performs usual work duties, but symptoms
interfere with outside activities', 3 = 'moderate disability;
symptoms disrupt performance of both usual work duties
and outside activities', 4 = 'recent severe disability; on
medical leave or had to change job because of symptoms',
and 5 = 'long-term severe disability; unable to work for
over 1 year or established permanent disability with com-
pensation payment' [43]. The Disability Scale has shown
excellent reliability in patients with peripheral vestibular
disorders [44].
The Disability Scale seemed appropriate to use as an exter-
nal anchor to examine discriminate ability and respon-
siveness to important change of the DHI-N. The categories
of the Disability Scale differentiate levels of disability that
appear clinically important to patients and clinicians,
each category being easy to interpret and having intuitive
face validity. Vocational disability caused by dizziness and
vertigo is an infrequent cause of certified sickness absence,
but people with long term sickness-absentees with dizzi-
ness/vertigo, have a considerable risk of obtaining disabil-
ity pension in the future [45]. Therefore, the difference
between and change in categories of the Disability Scale
were used for discriminate purposes in the analysis.
Gait was assessed to measure functional balance, using a
marked path of ten meters; six meters effective test dis-
tance with two meters at either end for acceleration and
deceleration. Gait was registered during: 1) self-preferred
gait speed, and 2) fast gait speed. One trial was offered
before testing. Each person was then tested twice. Satisfac-
tory reliability of preferred gait speed (meters pr. second)
Health and Quality of Life Outcomes 2009, 7:101 />Page 4 of 16
(page number not for citation purposes)
has been shown in different patient populations [46], as
well as in patients with peripheral vestibular disorders
[44].
Procedures
Internal consistency, validity and responsiveness of the
DHI-N were examined in sample 1. Following informed
consent, consecutive participants in sample 1 received
self-administered questionnaires, to be returned by mail
prior to the appointment for interview and baseline test-
ing. A second test including all measures was adminis-
tered about 6 months later, using the same test procedure.
The same physiotherapist interviewed and tested all par-
ticipants on both occasions.
Internal consistency and test-retest reliability were exam-
ined in sample 2. The DHI-N was answered as part of a
more extensive physiotherapy examination prior to a pro-
gram of vestibular rehabilitation. The forms were com-
pleted twice, 48 hours apart: The first form was completed
on location, the second returned by mail. The form was
returned by 28 (88%) patients.
Statistical analyses
Forms with missing values exceeding 7 items (30%) of the
DHI-N total or exceeding 30% of the items in a DHI-N
sub-domain, were excluded from analysis. Missing values
in the included forms, were replaced by the mode value of
the respective DHI-N sub-domain [47].
Demographics and test data were examined by descriptive
statistics. Distributions of scores were examined by Q-Q
plots and by comparing mean and median of the scales
and subscales. As normality could be assumed, parametric
statistics could be used. Differences between groups were
checked by t-tests and ANOVA.
A possible floor and ceiling effect of the DHI-N was exam-
ined by descriptive statistics. According to Terwee et al.
[27], a floor or ceiling effect is considered present, if more
than 15% of the respondents have the lowest or highest
score.
The underlying structure of the DHI-N was examined by
exploratory factor analysis (EFA) following tests of sam-
pling adequacy by Kaiser-Meyer-Olkin Measure (> 0.6)
and Bartlett's test of Sphericity (< 0.05) [48,49]. Maxi-
mum likelihood parameter extraction technique and the
scree plot were used to determine the numbers of factors
to be retained for analysis [49]. The factor structure was
identified by using the oblique rotation method
(Oblimin) with delta = 0 allowing for moderate correla-
tion [49]. Item loadings were evaluated in line with pro-
posals from Costello and Osborne [50]: Item loadings <
0.40 suggest that an item is not sufficiently related to the
other items in the factor, or indicates an additional factor
to be explored; the minimum loading of an item is sug-
gested = 0.32; and loadings ≥ 0.32 on two or more factors,
indicate cross-loadings.
Internal consistency was examined by Cronbach's alpha,
and a value > 0.80 was considered satisfactory [48].
To examine construct validity, scores of the DHI-N were
correlated with those of condition specific and generic
measures. Degree of linear relationships between varia-
bles were quantified by Pearson's correlation coefficient
(r), and evaluated in line with guidelines proposed by
Cohen [51]: r = 0.10 - 0.29 = small (low correlation); r =
0.30 - 0.49 = medium (moderate correlation); r = 0.50 -
1.0 = large (high correlation) [51]. To acknowledge the
ordinal nature of the DHI, correlations were also explored
by Spearman's rho, but as similar values of correlation
coefficients were found, they are not reported. Analyses of
the gait tests were based on the mean scores of two trials.
Regarding construct validity, we hypothesized that the
impact of dizziness on quality of life assessed by the DHI-
N with proposed physical, emotional and functional sub-
domains, would show high correlation with symptoms of
vertigo/imbalance and autonomic/anxiety of the VSS-sf-
N, being related functional constructs. Additionally, since
both measures are condition-specific and gather informa-
tion by self-report, we expected that this pair of measures
would demonstrate the highest association of all. We also
hypothesized a high correlation between the DHI-N and
the COOP WONCA sum score, also assessing related func-
tional constructs. Since the DHI-N is condition specific
and the COOP/WONCA a generic measure, we expected
that the association in this pair of measures would be
lower, than between the DHI-N and the VSS-sf-N. Since
the perceived impact of dizziness assessed by the DHI-N
seems important for how patients report on perceived lev-
els of disability assessed by the Disability Scale, we
expected a high correlation between these measures. We
further hypothesized that the DHI-N and gait tests
assessed similar physical constructs, because gait is influ-
enced by dizziness, and gait is performed in many daily
activities as well as in social situations. However, the DHI-
N is a broader self-report measure, including a multitude
of items, while gait tests are performance based and pro-
vide separate measures of gait. We therefore hypothesized
a moderate and inverse correlation, i.e. higher perceived
handicapping effect of dizziness was associated with fewer
meters walked pr. second in preferred and fast gait.
As another indication of construct validity, the ability of
the DHI-N to discriminate between groups with 'no disa-
bility' (scores 0-1) versus 'disability' (scores 2-5) accord-
ing to the Disability Scale, was examined by ROC
(Receiver Operating Characteristics) curve analyses. Con-
siderations of the area under the ROC curve (AUC) fol-
Health and Quality of Life Outcomes 2009, 7:101 />Page 5 of 16
(page number not for citation purposes)
lowed guidelines presented by Hosmer and Lemeshow
[52]: ≤ 0.5 no discrimination; 0.7 ≤ ROC < 0.8 acceptable
discrimination; 0.8 ≤ ROC < 0.9 excellent discrimination;
and ROC ≥ 0.9 outstanding discrimination. The best cut-
off point of scores was identified, where the sum of the
percentages of misclassified participants was lowest [52].
We hypothesized that the DHI-N would demonstrate
acceptable discriminate ability (AUC ≥ 0.7).
Test-retest reliability was examined by intraclass correla-
tion coefficients (ICC) [53]. All within-subject variability
is assumed to be error of measurement in model
ICC(1.1), while in model ICC(3.1) the effect of any sys-
tematic shift in data are not considered part of the error of
measurement [54]. ICC values ≥ 0.70 are considered satis-
factory [27,53]. Within-subject standard deviation (S
w
)
denotes measurement error, and is expressed in the unit of
the measurement tool. The difference between two meas-
urements for the same subject is expected to be < 2.77 S
w
for 95% pairs of observations. A change must exceed this
value in individual patients, called Smallest Detectable
Difference (SDD
ind
), to claim a true change. The smallest
detectable difference of a group of people (SDD
group
) can
be calculated by dividing the SDD
ind
by vn [27,55]. Meas-
urement error was also examined in a plot described by
Bland and Altman [56]: Graphs with plots of individual
differences between scale responses at test and retest were
plotted against the mean change scores. In addition to
SDD values, the 'limits of agreement' include the mean
change in scores of the repeated measurements.
As an indication of responsiveness, validity of the DHI-N
was explored by correlating the change scores with those
of the VSS-sf-N, COOP/WONCA, Disability Scale, and
gait tests. The hypothesized strength of correlations
between change scores, were as previously defined for
construct validity.
Responsiveness of the DHI-N was also examined by using
an anchor-based method [27,57]. Scores on the Disability
Scale were used as an external criterion for important
change in the construct being measured, and its applica-
bility was considered adequate [58], if changes in scores in
the DHI-N and the Disability Scale correlated with r ≥
0.50. Change scores of the Disability Scale were regrouped
into 'improved', 'unchanged', and 'worsened'. 'Improved'
was defined as reduced disability by 2 or more categories
on the Disability Scale, 'unchanged' was defined as no
change and ± 1 category change, and 'worsened' was
defined as increased disability by 2 or more categories.
The number of 'worsened' (n = 4) was too small to deter-
mine minimally important change for deteriorated, and
they were therefore excluded from the analysis. Change
scores of the DHI-N were explored in ROC curve analyses
using this dichotomized scale of 'improved' and
'unchanged' participants as dependent variable. The AUC
was used as a measure of responsiveness, and AUC > 0.70
is considered adequate [27]. Considerations of the AUC
were as previously defined for discriminate ability. The
minimally important change (MIC) was defined as the
best cut-off point identified on the ROC curve to discrim-
inate between 'improved' and 'unchanged' participants
[57].
Due to missing data, the number of participants in some
analyses differed from the total sample size. Level of sig-
nificance was set at p-value ≤ 0.05. Statistical analyses
were performed with SPSS version 16.0 for Windows.
Results
Study samples
The study included 92 participants in sample 1 at base-
line, and 27 participants in sample 2; seven participants
were excluded initially due to missing data on the DHI-N
forms, six from sample 1 and one from sample 2. Details
regarding descriptive information of the samples are given
in Table 1. Similar mean age was seen in both samples,
while the relative proportion of women was about 10%
higher in sample 1. Duration of dizziness was longer in
sample 1 than in sample 2. All the participants in sample
2, and the majority of participants in sample 1 had dizzi-
ness of vestibular origin, mainly represented by sequelae
from vestibular neuronitis. Sample 1 also included partic-
ipants with unknown origin of dizziness and non-vestib-
ular dizziness, the latter mainly represented by anxiety,
neck problems and sequelae of head and/or neck trauma.
Table 1: Description of the study samples
Characteristics Sample 1 Community based
n = 92
Sample 2 Tertiary referral centre
n = 27
Female: n (%) 64 (70) 16 (59)
Age: mean (SD, min-max) 47.2 (11.46, 26-64) 47.5 (12.1, 24-73)
Duration of dizziness: mean months (SD, min-max) 58.2 (84.1, 2-418) 32 (51.5, 1-234)
Diagnostic groups:
Vestibular dizziness, n (%) 59 (64) 27 (100)
Non-vestibular dizziness, n (%) 9 (10)
Unknown origin, n (%) 24 (26)
Health and Quality of Life Outcomes 2009, 7:101 />Page 6 of 16
(page number not for citation purposes)
No significant differences were found in DHI-N scores
between diagnostic groups, age groups, gender, duration
of symptoms, or scores on applied measures.
At the time of the second test, sample 1 had 72 partici-
pants. Eleven participants had withdrawn from the study,
due to different reasons: total relief of symptoms (n = 4),
no time to participate (n = 2), other diseases (n = 3), wors-
ening of the condition (n = 1), or child birth (n = 1). In
addition, six participants failed to keep test appointments
despite several opportunities, and three DHI-N forms had
missing data exceeding the predefined level.
Floor or ceiling effects
The scores of the DHI-N ranged from 4 to 86 DHI points
in sample 1, and 11% of the participants had < 20 DHI
points and 1% had ≥ 80 DHI points. No floor or ceiling
effects were demonstrated.
Factor structure
Exploratory factor analysis revealed eight factors in the
DHI-N with eigenvalues > 1, which explained 71% of the
variance before rotation. The scree plot (Figure 1) indi-
cated two obvious factors to be retained for rotation. Fac-
tor I comprised almost all items included in the original
emotional subscale, in addition to four items in the func-
tional subscale (Table 2). Factor II comprised items
included in the original physical subscale, in addition to
one from the emotional and four from the functional sub-
scales (Table 2). The two factors had low correlation (r =
0.33) with delta set at zero. Five items were below mini-
mum loading (items 4, 10, 12, 17, and 20). Two items
cross-loaded (item 16 and 22), and two items (item15
and 16) indicated a possible additional factor (Table 2).
In the 3-factor solution, factor I comprised items origi-
nally included in the emotional and functional subscales
Scree Plot of eigenvalues of DHI-N items by exploratory factor analysis (EFA) (n = 92, sample 1)Figure 1
Scree Plot of eigenvalues of DHI-N items by exploratory factor analysis (EFA) (n = 92, sample 1).
Health and Quality of Life Outcomes 2009, 7:101 />Page 7 of 16
(page number not for citation purposes)
(Table 2). Factor II comprised items from the original
physical in addition to functional subscales. Factor III
comprised two items from the original emotional and two
from the functional subscales. The correlation between
the three factors was low (-0.36 ≤ r ≥ 0.26) with delta set
at zero. Three items loaded below minimum (items 4, 10,
and 12), and four items cross-loaded (item 3, 7, 15 and
22), indicating a possible additional factor (Table 2). A
four factor solution was also explored: two items cross-
loaded (7, and 22), three items loaded below minimum
(4, 14 and 17), and the fourth factor included only three
items. Results from the EFA revealed that the items of the
DHI-N loaded differently, than the suggested three sub-
domains of the original version. In further analysis, only
measurement properties for the total scale were thus
examined.
Internal consistency
Acceptable Cronbach's alpha values were indicated for the
DHI-N in sample 1, α = 0.88, and in sample 2, α = 0.95.
All items had item-total correlation > 0.20.
Construct validity
High correlations were shown between the DHI-N and the
VSS-sf-N total, the VSS-sf-N sub-scales, the COOP/
WONCA and the Disability scale (r ranging 0.50 - 0.69)
(Table 3). The highest correlation was found between the
DHI-N and VSS-sf-N total (r = 0.69). The association with
COOP/WONCA sum score was, however, almost as high
(r = 0.60), the individual charts also showing moderate to
high correlations (excluding chart E. Changes in health).
Moderate correlations between DHI-N and gait tests (pre-
ferred gait: r = -0.36, and fast gait: r = -0.40) were found
(Table 3).
Discriminate ability
The DHI-N showed excellent ability to discriminate
between participants who reported 'disability' (n = 68)
and 'no disability' (n = 24), according to the area under
the ROC curve: AUC being 0.89 (95% CI 0.81-0.97), as
shown in Figure 2. The cut-off point for best discrimina-
tion was 29 points, correctly classifying 85% of partici-
pants with 'disability' and 79% with 'no disability'. Those
Table 2: Factor structure and item loadings of the DHI-N by exploratory factor analysis (n = 92, sample 1)
Abbreviated item description
a
DHI - Norwegian version
b
2 - factor solution
DHI - Norwegian version
b
3 - factor solution
Factor I Factor II Factor I. Factor II. Factor III.
Physical
1 Looking up - 0.15 0.73 - 0.28 0.65 - 0.25
4 Walking down aisle 0.24 0.28 0.15 0.26 - 0.17
8 Ambitious activities 0.14 0.53 0.13 0.56 - 0.02
11 Quick movements of head < 0.01 0.58 - 0.09 0.56 - 0.06
13 Turning over in bed < 0.01 0.55 - 0.08 0.54 0.03
17 Walking down a sidewalk 0.11 0.30 0.10 0.32 > 0.01
25 Bending over - 0.12 0.76 - 0.14 0.74 - 0.05
Emotional
2 Feel frustrated 0.55 < 0.01 0.51 0.10 - 0.04
9 Leave home alone 0.43 0.24 0.01 0.08 - 0.90
10 Embarrassed in front of others 0.18 < 0.01 0.11 0.06 - 0.10
15 Afraid people think you intoxicated 0.19 0.35 0.54 0.36 - 0.03
18 Concentrate 0.69 < 0.01 0.69 0.14 > 0.01
20 Afraid to stay home alone 0.31 < 0.01 0.03 - 0.06 - 0.57
21 Feel handicapped 0.79 - 0.14 0.80 - 0.05 0.02
22 Stress on relationships 0.74 - 0.39 0.63 - 0.36 - 0.20
23 Depressed 0.61 < 0.01 0.50 - 0.05 - 0.20
Functional
3 Restrict travel 0.61 0.11 0.38 0.05 - 0.44
5 Getting into/out of bed < 0.01 0.64 - 0.05 0.65 0.28
6 Social activities 0.79 < 0.01 0.68 - 0.05 - 0.21
7 Reading 0.29 0.40 0.39 0.51 0.21
12 Avoid heights 0.14 0.30 0.13 0.31 - 0.01
14 Strenuous house/yard work 0.43 0.29 0.35 0.30 - 0.17
16 Walk by yourself 0.35 0.37 0.05 0.28 - 0.63
19 Walk around in the dark 0.16 0.52 0.15 0.54 - 0.01
24 Job/household responsibilities 0.71 0.10 0.80 0.23 0.14
a
Item loadings are presented according to the abbreviated item description of sub domains of the original version of the DHI questionnaire
(physical, emotional and functional subscales). Major loadings for every item ≥ 0.32 are bold face.
b
Exploratory factor analysis with Maximum
likelihood parameter extraction method with oblique rotation (pattern matrix).
Health and Quality of Life Outcomes 2009, 7:101 />Page 8 of 16
(page number not for citation purposes)
who reported 'disability' had a mean (SD) score of 46.4
(16.56) points, and those who reported 'no disability' had
a mean (SD) score of 21.6 (12.13) points.
Test-Retest reliability
Test-retest reliability of the DHI-N was satisfactory (ICC
1,1 = 0.90). Mean scores of the first test were somewhat
higher than retest scores, but the difference between
ICC(1,1) and ICC(3,1) analysis was minimal, showing lit-
tle systematic change from the first to the second test.
Absolute agreement (S
w
) was 7.1. The smallest detectable
difference for an individual (SDD
ind
) was accordingly
19.67 points on the DHI-N, while the smallest detectable
difference for a group (SDD
group
) was 3.78 points.
The central line in the Bland-Altman plot (Figure 3) shows
the mean change in scores from the first to the second
measurement, and the flanking dotted lines, the limits of
agreement, take the mean change in scores as well as the
SDD
ind
into consideration.
Responsiveness
The correlations between change in DHI-N scores and
those of the other self-report measures were high, correla-
tion coefficients (r) ranging 0.50-0.57 (Table 4). Highest
association was found between change in the DHI-N and
the condition specific VSS-sf-N (r = 0.57). Changes in VSS-
sf-N sub-scores had similar associations with the DHI-N
(VSS-sf-V-N, r = 0.51, VSS-sf-A-N, r = 0.50). The associa-
tion with the generic COOP/WONCA sum score (r = 0.56)
was almost as high as the VSS-sf-N total, while the change
scores of each COOP/WONCA chart were moderate to
high (excluding chart E. Change in health). Low correla-
tions of change scores between DHI-N and gait tests did
not reach statistical significance (Table 4).
The Disability scale was found suitable as an external cri-
terion of change in the construct being measured, r being
0.51 (Table 4). A significant difference in change of the
DHI-N scores (<0.001) was found between the 'improved'
group (n = 20) and the 'unchanged' group (n = 43) (Table
5). The scale demonstrated excellent ability to discrimi-
nate between 'improved' and 'unchanged' participants
according to the area under the ROC curve: AUC being
0.83 (95% CI: 0.71-0.94), as shown in Figure 4. The
anchor based MIC was identified as 11 points (Table 5),
correctly classifying 75% of the 'improved' and 77% of the
'unchanged' participants.
Discussion
In this cross-sectional and longitudinal study of patients
with dizziness, measurement properties of a translated
and adapted Norwegian version of the Dizziness Handi-
cap Inventory (DHI-N), were examined. The factor analy-
sis revealed a different factor structure than suggested in
the original version, resulting in dismissal of subscale
scores. Satisfactory internal consistency of the total scale
was found. Concurrent correlation between the DHI-N
and other measures of related constructs were moderate to
high, highest for the VSS-sf-N and lowest for preferred gait
speed. The DHI-N demonstrated excellent ability to dis-
criminate between participants with and without 'disabil-
ity', AUC being 0.89, and the best cut-off point for
discrimination was 29 points. Satisfactory test-retest relia-
bility was demonstrated, and change should be ≥ 20 DHI-
N points for an individual (SDD) to exceed measurement
error. Correlation between change scores of the DHI-N
and those of other self report measures, were high. The
DHI-N demonstrated excellent ability to discriminate
between self-perceived 'improved' versus 'unchanged' par-
ticipants, AUC being 0.83. The anchor based MIC was
Table 3: Tests, scores and examination of validity of the DHI-N (n = 92, sample 1)
Outcome measures (scale range) Baseline Mean (SD), Range DHI-N total Pearson's r
DHI-N total (0 - 100) 39.91 (18.95), 4 - 86 1
VSS-SF-N total (0 - 60) 14.58 (9.87), 0 - 49 0.69**
VSS-SF-V-N (0 - 32) 8.63 (6.98), 0 - 29 0.64**
VSS-SF- A-N (0 - 28) 5.95 (4.58), 0 - 20 0.50**
COOP/WONCA (5 - 25) 12.49 (3.52), 4 - 22 0.60**
A Physical (1-5) 2.48 (1.01) 0.34**
B Feelings (1-5) 2.76 (1.03) 0.35**
C Daily activities (1-5) 2.36 (0.95) 0.54**
D Social activities (1-5) 2.32 (1.09) 0.48**
E Change in health (1-5) 2.81 (0.68) 0.07
F Overall health (1-5) 2.85 (0.79) 0.43**
Disability Scale (0 - 5) 2.58 (1.29), 0 - 5 0.58**
Preferred gait (m/sec) 1.28 (0.27), 0.38 - 1.98 - 0.36**
Fast gait(m/sec) 2.00 (0.33), 1.17 - 3.00 - 0.40**
* p < 0.05 (2-tailed), ** p < 0.01 (2-tailed).
Health and Quality of Life Outcomes 2009, 7:101 />Page 9 of 16
(page number not for citation purposes)
identified as 11 DHI-N points. Measurement properties of
the DHI-N seemed, accordingly, to be highly satisfactory.
Translation
The items included in the DHI, were considered relevant
and adequate for dizzy patients in the Norwegian culture,
which was a prerequisite for translating the measure [29].
Recommended guidelines were followed [28,29], and as
all the steps in the translation process were reported, the
process can be validated by others [30]. The response cat-
egories and scoring system were initially kept in line with
the original suggestions ('yes', 'no', 'sometimes') [1], and
as reported in a previous publication [59]. However, to be
in line with a recently published version [31], the
sequence of response categories were changed, as shown
in Additional file 1. A one page or a two page question-
naire would be favourable to eliminate the problem of
missing data from unanswered backside pages.
Study samples
As recommended when developing an assessment tool for
a particular population [27], the recruitment of dizzy
patients was broad, with participants from primary health
care, as well as from tertiary referral centres, settings in
which the DHI-N questionnaire will be used in the future.
The mean age and gender of the participants in sample 2,
were comparable to the participants included when the
original DHI scale was developed and tested [1]. The tar-
get population of the DHI was patients with vestibular
system disease, and it might be argued that the DHI, there-
Ability of the DHI-N to discriminate between patients with ' disability' and 'no disability' examined by ROC curve analysis (n = 92, sample 1)Figure 2
Ability of the DHI-N to discriminate between patients with ' disability' and 'no disability' examined by ROC
curve analysis (n = 92, sample 1).
Health and Quality of Life Outcomes 2009, 7:101 />Page 10 of 16
(page number not for citation purposes)
fore, should not be used in patients with dizziness of
other origins. Sample 1 had a broader recruitment, and
also included participants with non vestibular and
unknown origin of dizziness, and was thus neither
directly comparable to sample 2, nor to the sample used
in development of the scale. However, patients seen at ter-
tiary referral centres are referred from General Practition-
ers in primary health care and from other medical
specialists. The reason for referral is often associated with
uncertain aetiologies, thus probably presenting a multi-
tude of origins. Therefore, dizziness, rather than the origin
of dizziness, should probably be the indication for using
the questionnaire. It was favourable that the participants
in the present study reported a wide range of scores on the
DHI-N questionnaire, without showing floor or ceiling
effects. In that way, measurement properties of the broad
scale scores have been taken into consideration.
In our study, the sample sizes for testing measurement
properties of the DHI-N, seem mostly adequate, accord-
ing to quality criteria proposed by Terwee et al. [27]. A
sample size ≥ 50 is, however, proposed in test-retest relia-
bility studies [27], while in our study of test-retest reliabil-
ity, only 27 participants were included. SDD
ind
estimated
in sample 2 were in line with the initial findings in the
DHI (SDD ≥ 18) [1]. However, previous studies with
larger sample sizes, have demonstrated a smaller SDD
ind
in the DHI [8,16]. Our results are at least safe estimates of
Intra-individual differences between the DHI-N scores at test and retest plotted against the mean DHI-N change scores (n = 27, sample 2)Figure 3
Intra-individual differences between the DHI-N scores at test and retest plotted against the mean DHI-N
change scores (n = 27, sample 2). The central horizontal line represents the mean difference in scores of repeated meas-
urements, and the dotted lines represent the 95% limits of agreement.
100,0080,0060,0040,0020,000,00
Mean DHI score
30,00
20,00
10,00
0,00
-10,00
-20,00
-30,00
Difference in DHI score
Health and Quality of Life Outcomes 2009, 7:101 />Page 11 of 16
(page number not for citation purposes)
measurement error, but later studies of reliability should
preferably include a larger sample size. The sample size for
the factor analysis should preferably be 4-10 subjects pr
item [27,50]. However, as acceptable sampling adequacy
was demonstrated, we considered the sample size (n = 92)
acceptable for exploring the factor structure in the present
study.
Factor structure and internal consistency
We applied exploratory factor analysis (EFA), which is rec-
ommended when the factor structure of a measure has not
been established [49,50]. The analysis did not confirm the
originally suggested content domains of the DHI. Previ-
ous results from principal components analysis (PCA) of
the DHI in the original language [9], as well as of other
translated versions [10,11], have demonstrated various
underlying factor structures. Different results from factor
analyses of the same instrument may have several causes,
such as use of different methods of analyses (EFA versus
PCA), translation, patient samples, and sample size, but
might also indicate limitations in item construction, and
that the initial factor structure could be flawed [29,50].
According to a recent publication, the authors of the orig-
inal version have also abandoned calculations of subscale
scores [31]. Internal consistency of the DHI-N total scale
by Cronbach's alpha was above the recommended limits
[48], and in line with previous results [1].
Construct validity
Construct validity of the DHI-N was supported, as the pre-
defined hypotheses of concurrent correlations with other
measures, were confirmed. The high and highest correla-
tion was demonstrated between the DHI-N and the VSS-
sf-N, and was also high for the VSS-sf-N subscale scores.
Although the DHI-N subscale scores were abandoned in
the present study, the results indicate that the DHI-N
includes similar physical and emotional constructs, as the
VSS-sf-N. Using the concepts from International Classifi-
cation of Function (ICF) [60], these condition specific
questionnaires appear to measure similar constructs, but
at different functional levels. While the DHI-N items
appear to capture the limiting effect of dizziness on per-
formance of activities, the VSS-sf-N items appear to cap-
ture severity of symptoms, reflecting impairments of body
functions [60].
The hypothesis of high association between the sum
scores of the DHI-N and COOP/WONCA was confirmed,
but the association was higher than expected, taking into
consideration that the COOP/WONCA is a generic meas-
ure. The high association indicates similarity of functional
constructs. The handicapping effect of dizziness (DHI-N)
and functional health status (COOP/WONCA sum score)
may represent related functional problems according to
ICF [60]. Both ask questions about performance of activi-
ties and/or limitations and participation in different areas
of every-day life. The association was found to be particu-
larly high between DHI-N total score and the COOP/
WONCA chart C. daily activities. Previous findings of cor-
relations between the DHI and subscales of the generic SF-
36, ranged from 0.11 to 0.71 [15,16]: Fielder et al. [15]
found high associations between the DHI total score and
8 sub scores of the SF-36 (Spearman's rho ≥ 0.53), while
the findings of Enloe and Shields [16] showed variable
associations with the DHI sub-scores. Results from the
present and the previous studies, indicate associations
between two versions of the DHI and two generic meas-
ures of health.
The hypothesis of moderate correlation between the DHI-
N and gait as a measure of balance was also confirmed.
We might have expected even higher correlation, since
patients with dizziness tend to have impaired balance.
However, taking into consideration that the DHI-N is a
broad self-report measure and gait tests a performance
measure that only yields one test result, a moderate corre-
Table 4: Responsiveness; correlations between change scores of the DHI-N and other measures (n = 72, sample 1)
Outcome measures, change DHI-N total, change Pearson's r
VSS - SF-N total 0.57**
VSS - SF-V-N 0.51**
VSS - SF-A-N 0.50**
COOP/WONCA (A, B, C, D, F) 0.56**
A Physical 0.30*
B Feelings 0.40**
C Daily activities 0.39**
D Social activities 0.52**
E Change in health 0.02
F Overall health 0.39**
Disability scale 0.51**
Preferred gait 0.10
Fast gait 0.20
* p < 0.05 (2-tailed), ** p < 0.01 (2-tailed).
Health and Quality of Life Outcomes 2009, 7:101 />Page 12 of 16
(page number not for citation purposes)
lation is more realistic [48]. The results from participants
with multiple origins of dizziness, are thus also in line
with previous findings from patients with vestibular dis-
orders [13,61]. The results support construct validity of
the DHI-N.
In agreement with several authors [27,46,48,62], the abil-
ity to discriminate between participant groups that are
known to have a trait or condition of interest, and those
who do not (i.e. discriminate between 'known' groups),
was used to indicate construct validity of the DHI-N. The
Ability of the change scores of DHI-N to discriminate between 'improved' versus 'unchanged' participants examined by ROC curve analysis (n = 63, sample 1)Figure 4
Ability of the change scores of DHI-N to discriminate between 'improved' versus 'unchanged' participants
examined by ROC curve analysis (n = 63, sample 1).
Table 5: Responsiveness; ability of the DHI-N change scores to discriminate between participants reported to be 'improved' versus
'unchanged' on the Disability scale (n = 63, sample 1).
DHI-N change Baseline scores
Mean (SD)
Test 2 scores
Mean (SD)
Change scores
Mean (SD)
Smallest
Detectable
Difference
Area under the
ROC curve
(95% CI)
ROC cut-off point:
MIC-ROC
Improved 42.70 (15.14) 24.40 (14.93) 18.30 (12.64) 19.67 0.83 11
Unchanged 38.23 (19.55) 34.05 (18.93) 4.19 (9.47) (0.71 - 0.94)
Health and Quality of Life Outcomes 2009, 7:101 />Page 13 of 16
(page number not for citation purposes)
questionnaire was shown to have excellent ability to dis-
criminate between dizzy patients with and without per-
ceived 'disability', according to the Disability Scale. The
hypothesis of acceptable discrimination was confirmed,
and construct validity was supported. The optimal cut-off
point found in this study also corresponds to previous
findings of 'mild' self perceived handicap, ranging 0-30
points on the DHI [13]. Previously, the DHI has also
shown ability to discriminate between groups of dizzy
patients according to frequency of dizziness episodes [1],
and levels of functional impairment [13].
Test-retest reliability
Relative test-retest reliability was satisfactory [53], and
comparable to initial results by Jacobson and Newman
[1]. The risk of recall bias in the present study was consid-
ered minimal, since filling out the form was part of an
extensive test battery and separated by 48 hours. A some-
what higher correlation seen in the original study may be
due to short retest interval (same day). There are no defi-
nite guidelines as to how long the time interval should be,
however, time should be long enough to secure that pre-
vious self-reported responses are forgotten, and short
enough for stability of the condition to be retained [48].
Knowledge of absolute reliability of an instrument allows
identification of change beyond measurement error. No
absolute value is recommended, but should preferably be
small for instruments to be useful as an outcome measure.
The SDD for an individual in the present study was some-
what large (20 DHI-N points), but is similar to the value
reported in the original study (18 points) [1]. The SDD
ind
makes it possible to judge whether or not a change is
above measurement error, as recommended by Terwee et
al [27]. As there tended to be a systematic change in scores
between repeated measurements (Figure 3), this should
probably also be taken into consideration when judging
change scores.
Responsiveness
Responsiveness of the DHI-N was supported, as the
hypotheses of correlations between change scores of the
DHI-N versus the VSS-sf-N total, as well as the COOP/
WONCA sum, were confirmed. However, the hypotheses
of correlations with performance based gait tests were not
confirmed. The highest association between change scores
of the DHI-N and the VSS-sf-N indicated similar con-
structs; a reduction in perceived handicapping effect of
dizziness was associated with a reduction in perceived fre-
quency of symptoms of dizziness. The correlation with
change scores of the COOP/WONCA sum was shown to
be almost as high; reduction in the perceived handicap-
ping effects of dizziness was associated with better func-
tional health. This is in line with the associations that
were found between the scales in cross-sectional analysis.
The scale did not show significant relationship with
changes in gait speed. Previously, moderate correlation
between change in DHI and change in the mean score of
equilibrium, derived from six sensory conditions assessed
by Computerized Dynamic Posturography (CDP), has
been demonstrated [63]. According to Finch et al. [46],
change scores of measures at different functional levels
(ICF) could be expected to correlate between r = 0.2 - 0.5.
The lack of relationship with gait tests in the present
study, may imply that although gait speed is considered a
measure of functional balance and disability, gait is per-
haps more a physical characteristic, than a construct [46].
The use of change in gait speed to validate change in the
DHI-N scale may therefore be questioned.
Responsiveness was further supported by the ability of the
DHI-N to discriminate between self-perceived clinically
'improved' and 'unchanged' participants. The criterion for
improvement was a reduction of 2 or more categories on
the Disability Scale. The applicability of the Disability
Scale as external criterion of important change, was found
acceptable according to a review of current approaches to
defining clinically meaningful change [58], although,
according to criteria suggested by Terwee et al [27], a
stronger correlation is preferable. The content of the DHI
was, however, designed to capture several aspects of self-
perceived consequences of dizziness that no previous
questionnaires had covered, thus there is no 'gold stand-
ard'. The Disability Scale assesses self-perceived disability,
has favourable levels of ordinal categories, a change in cat-
egories imply important clinical change, and high concur-
rent correlation with the DHI-N indicates similar
functional constructs. The same measures were used at
baseline and follow-up, reducing possible biases that are
reported from use of scales, where the client must estimate
change from a previous state at an earlier time [48].
The area under the ROC curve indicated excellent discrim-
inate ability according to recommended limits [27]. How-
ever, the optimal cut-off point of 11 DHI-N points, the
anchor based MIC, was within the limits of measurement
error at the level of an individual (SDD
ind
≥ 20 DHI-N
points), but exceeded the level estimated for groups
(SDD
group
≥ 4 DHI-N points). Thus, the DHI-N is consid-
ered responsive in the construct being measured, but a
real change must exceed measurement error.
Ability to measure change in an instrument have been
examined by different methods [26,55,64-66]. Several
authorities [55,64,66], define sensitivity to change as the
ability of an instrument to detect change in general, while
responsiveness is defined as the ability of an instrument to
detect a clinically important change, and a real change in
the concept being measured. The DHI has been used in
previous studies to explore change in general and change
Health and Quality of Life Outcomes 2009, 7:101 />Page 14 of 16
(page number not for citation purposes)
in scores due to effect of treatment [7,12,16], thus indicat-
ing sensitivity of the DHI, according to the definitions
above. The ability of the DHI to discriminate between
change scores in groups of participants with dizziness
who were expected to change differently according to the
treatment received, has been demonstrated in the original
version [18,21,23,24], and also in a translated version
[17,25]. These studies did, however, not address respon-
siveness as a quality of the DHI questionnaire to detect
important and real change in the constructs being meas-
ured. The present study is the first to address and demon-
strate this ability in the DHI scale, i.e. to detect self-
perceived important change in the construct being meas-
ured using an anchor based approach.
Challenges and limitations
Several challenges and limitations of the present study
have already been discussed, also in relation to quality cri-
teria for measurement properties proposed by Terwee et
al. [27]. We recognize that the widely used DHI has limi-
tations in itself, having only three response categories for
each item to describe the handicapping effect of dizziness,
and to capture change. It is a challenge that the subscales
are used in the original DHI, while we recommend that
only the sum scale should be used, since this relates to the
question of equivalence between the scales. The use of the
Disability Scale as an anchor for important change in the
DHI-N seems appropriate, since it reflects important lev-
els of functioning for the individual. Other relevant exter-
nal criteria of important change might also be explored in
future studies, still realizing the lack of 'a golden stand-
ard'.
Conclusions
The total scale of the Dizziness Handicap Inventory, Nor-
wegian version demonstrated satisfactory measurement
properties as a discriminate and evaluative measure, and
can therefore be used to assess the impact of dizziness on
quality of life in Norwegian speaking patients. This is the
first study that has addressed and demonstrated anchor
based responsiveness of the DHI to self-perceived clini-
cally important change, also providing values of SDD, and
MIC to help interpret change scores.
List of abbreviations
AUC: Area under the ROC curve; DHI: Dizziness Handi-
cap Inventory; DHI-N: Dizziness Handicap Inventory,
Norwegian version; EF: Exploratory factor analysis; MIC:
Minimally important change; PCA: Principal component
analysis; ROC: Receiver operating characteristic; SDD:
Smallest detectable difference; VSS-sf: Vertigo Symptom
Scale - short form; VSS-sf-N: Vertigo Symptom Scale -
short form - Norwegian version; VSS-sf-V: Vertigo Symp-
tom Scale - short form - vertigo/balance subscale; VSS-sf-
V-N: Vertigo Symptom Scale - short form- vertigo/balance
subscale - Norwegian version; VSS-sf-A: Vertigo Symptom
Scale - short form- autonomic/anxiety subscale; VSS-sf-A-
N: Vertigo Symptom Scale - short form - autonomic/anxi-
ety subscale - Norwegian version.
Competing interests
The authors declare that they have no competing interests.
Authors' contributions
A-LT designed and carried out the study using sample 1,
performed the statistical analysis of data from sample 1:
factor analysis, internal consistency, validity, discriminate
ability and responsiveness, drafted and wrote the article.
KTW designed and carried out the test-retest study using
sample 2, performed statistical analysis of data in test-
retest reliability and internal consistency, helped to inter-
pret results, to draft and write the article. LIS contributed
to plan the article and relevant statistical analysis, helped
to interpret results, to draft and write the article. All
authors read and approved the final version.
Additional material
Acknowledgements
A special thanks to Kathryn Hermansen, Oslo University College, who
took part in the translation process. Thanks to all participants, the National
Insurance Administration (now part of the Norwegian Labour and Welfare
Organisation, established in 2006) and collaborate partners for assisting in
recruitment of eligible participants to the study.
References
1. Jacobson GP, Newman CW: The development of the Dizziness
Handicap Inventory. Arch Otolanryngol Head Neck Surg 1990,
116:424-427.
2. Cattaneo D, Regola A, Meotti M: Validity of six balance disorders
scales in persons with multiple sclerosis. Disability & Rehabilita-
tion 2006, 28:789-795.
3. Kaufman KR, Brey RH, Chou L-S, Rabatin A, Brown AW, Basford JR:
Comparison of subjective and objective measurements of
balance disorders following traumatic brain injury. Medical
Engineering & Physics 2006, 28:234-239.
4. Treleaven J, Jull G, LowChoy N: Standing balance in persistent
whiplash: a comparison between subjects with and without
dizziness. J Rehabil Med 2005, 37:224-229.
5. Ardic FN, Topuz B, Kara CO: Impact of Multiple Etiology on
Dizziness Handicap. Otology & Neurotology 2006, 27:676-680.
6. Jarlsäter S, Mattson E: Test of reliability of Dizziness Handicap
Inventory and the Activities-specific Balance Confidence
Scale for use in Sweden. Advances in Physiotherapy 2003,
5:137-144.
7. Poon DMY, Chow LCK, Au DKK, Hui Y, Leung MCP: Translation
of the Dizziness Handicap Inventory into chinese, validation
Additional file 1
Dizziness Handicap Inventory - Norwegian version (DHI-N). Ques-
tionnaire (Norwegian version) of the Dizziness Handicap Inventory
(DHI-N).
Click here for file
[ />7525-7-101-S1.DOC]
Health and Quality of Life Outcomes 2009, 7:101 />Page 15 of 16
(page number not for citation purposes)
of it, and evaluation of the quality of lifw of patients with
chronic dizziness. Ann Otol Rhinol Laryngol 2004, 113:1006-1011.
8. Vereeck L, Truijen S, Wuyts F, Heyning PH Van de: Test-retest reli-
ability of the Dutch version of the Dizziness Handicap Inven-
tory. B-ENT 2006, 2:75-80.
9. Asmundson GJG, Stein MB, Ireland D: A factor analytic study of
the dizziness handicap inventory: does it assess phobic avoid-
ance in vestibular referrals? Journal of vestibular Research
1999:63-68.
10. Perez N, Garmendia I, Garcia-Granero M, Martin E, Garcia-Tapia R:
Factor analysis and Correlation Between Dizziness Handi-
cap Inventory and Dizziness Characteristics and Impact on
Quality of Life Scales. Acta Otolaryngol 2001, 2001:145-154.
11. Vereeck L, Truijen S, Wuyts FL, Heyning PH Van de: Internal con-
sistency and factor analysis of the Dutch version of the Diz-
ziness Handicap Inventory. Acta Oto-Laryngologica 2007,
127:788-795.
12. Duracinsky M, Mosnier I, Bouccara D, Sterkers O, Chassany O: Lit-
erature Review of Questionnaires Assessing Vertigo and
Dizziness, and Their Impact on Patients' Quality of life. Value
in Health 2007, 10:273-284.
13. Whitney SL, Wrisley DM, Brown KE, Furman JM: Is perception of
handicap related to functional performance in persons with
vestibular dysfunction? Otology & Neurotology 2004, 25:139-143.
14. Jacobson GP, Newman CW, Ireland D, Balzer GK: Balance Func-
tion Test Correlates of the Dizziness Handicap Inventory. J
Am Acad Audiol 1991:253-260.
15. Fielder H, Denholm SW, Lyons RA, Fielder CP: Measurement of
health status in patients with vertigo. Clin Otolaryngol
1996:124-126.
16. Enloe LJ, Shields RK: Evaluation of health-related quality of life
in individuals with vestibular disease using disease-spesific
and general outcome measures. Physical Therapy 1997,
77:891903.
17. Johansson M, Akerlund D, Larsen HC, Andersson G: Randomized
controlled trial of vestibular rehabilitation combined with
cognitive-behavioral therapy for dizziness in older people.
Otolaryngol Head Neck Surg 2001, 125:151-156.
18. Yardley L, Donovan-Hall M, Smith H, Wash BM, Mullee M, Bronstein
AM: Effectiveness of primary care-based vestibular rehabili-
tation for chronic dizziness.
Ann Intern Med 2004, 141:598-605.
19. Zimbelman JL, Stoecker J, Haberkamp TJ: Outcome in Vestibular
rehabilitation. Physical Therapy case reports 1999, 2:232-240.
20. Krebs DE, Gill-Body KM, Riley PO, Parker SW: Double-blind, pla-
cebo-controlled trial of rehabilitation for bilateral vestibular
hypofunction: preliminary report. Otolaryngol Head Neck Surg
1993, 109:735-741.
21. Mruzek M, Nichols DS, Burnett CN, Welling DB: Effects of vestib-
ular rehabilitation and social reinforcement on recovery fol-
lowing ablative vestibular surgery. The Laryngoscope 1995,
105(7 Pt 1):686-692.
22. Cattaneo D, Jonsdottir J, Zocchi M, Regola A: Effects of balance
exercises on people with multiple sclerosis: a pilot study.
Clinical Rehabilitation 2007, 21:771-781.
23. Yardley L, Kirby S: Evaluation of booklet-based self manage-
ment of symptoms in Meniere Disease: a randomized con-
trolled trial. Psychosomatic Medicine 2006, 68:762-769.
24. Cohen HS, Kimball KT: Increased independence and decreased
vertigo after vestibular rehabilitation. Otolaryngol Head Neck
Surgery 2003, 128:60-70.
25. Hansson EE, Mansson NO, Ringsberg KAM, Hakansson A: Dizziness
among patients with whiplash-associated disorder: a rand-
omized controlled trial. J Rehab Med 2006, 38:387-390.
26. Terwee CB, Dekker FW, Wiersinga WM, Prummel MF, Bossuyt
PMM: On assessing responsiveness of health-related quality of
life instruments: Guidelines for instrument evaluation. Qual-
ity of Life Research 2003, 12:349-362.
27. Terwee CB, Bot SD, de Boer MR, van de Windt DA van der, Knol DL,
Dekker J, Bouter LM, de Vet HC: Quality criteria were proposed
for measurement properties of health status questionnaires.
Journal of Clinical Epidemiology 2007, 60:34-42.
28. Sartorius N, Kuyken W: Translation of health status instru-
ments. In Quality of Life assessment: International perspectives Edited
by: Orley J, Kuyken W. Berlin: Springer-Verlag; 1994:3-18.
29. Streiner DL, Norman GR: Translation. In Health measurement scales
Oxford: Oxford University Press; 2003:23-26.
30. Maneesriwongul W, Dixon JK: Instrument translation process: a
methods review. Journal of advanced Nursing 2004, 48:175-186.
31. Jacobson GP, Newman CW: Assessing Dizziness-Related Qual-
ity of Life. In Balance Function assessment and management Edited by:
Jacobson GP, Shepard NT. San Diego, CA: Plural Publishing, Inc;
2008:99-131.
32. Yardley L, Burgneay J, Andersson G, Owen N, Nazareth I, Luxon LM:
Feasability and effectiveness of providing vestibular rehabili-
tation for dizzy patients in the community. Clin Otolaryngol
1998:422-448.
33. Yardley L, Jahanshahi M, Hallam RS: Psychosocial aspects of disor-
ders affecting balance and gait. In Clinical Disorders of Balance, Pos-
ture and Gait 2nd edition. Edited by: Bronstein AM, Brandt T,
Wollacott MH, Nutt JG. London: Arnold; 2004:382-384.
34. Wilhelmsen K, Strand LI, Nordahl SHG, Eide GE, Ljunggren AE: Psy-
chometric properties of the Vertigo symptom scale - short
form. BMC Ear Nose Throat Disord 2008, 8:2.
35. Measuring functional health status with the COOP/WONCA
Charts. A manual [ />research_tools/assessment_tools/Coopwonca_handleiding.pdf]
36. van Baalen B, Odding E, van Woensel MPC, van Kessel MA, Roebr-
oeck ME, Stam HJ: Reliability and sensitivity to change of meas-
urement instruments used in a traumatic brain injury
population. Clinical Rehabilitation 2006, 20:686-700.
37. Kinnersley P, Peters T, Stott N: Measuring functional health sta-
tus in primary care using the COOP-WONCA charts:
acceptability, range of scores, construct validity, reliability
and sensitivity to change. British Journal of General Practice 1994,
44:545-549.
38. Lindegaard Peter M, Bentzen N, Christiansen T: Reliability of the
COOP/WONCA charts. Test-retest completed by patients
presenting psychosocial health problems to their general
practitioner. Scand J Prim Health Care 1999, 17:145-148.
39. Holm I, Risberg MA, Steen H: Outpatient physical therapy influ-
ences the patients' health-related quality of life. Advances in
Physiotherapy 2005, 7:40-47.
40. Linaker Olav M, Moe A: The COOP/WONCA charts in an acute
psychiatric ward. Validity and reliability of patients' self-
report of functioning. Nord J Psychiatry 2005, 59:121-126.
41. Bentsen BG, Natvig B, Winnem M: Questions you didn't ask?
COOP/WONCA Charts in clinical work and research. Fam
Pract 1999, 16:190-195.
42. Bruusgaard D, Nessoy I, Rutle I, Furuseth K, Natvig B: Measuring
Functional Status in a Population Survey. The Dartmouth
Functional Health Assessment Charts/Wonca used in a Epi-
demiological Study. Fam Pract 1993, 10:212-218.
43. Shepard NT, Telian SA: Practical management of the balance disorder
patient London: Singular Publishing Group Inc; 1996.
44. Hall CD, Herdman SJ: Reliability of clinical measures used to
assess patients with peripheral vestibular disorders. Journal of
Neurologic Physical Therapy 2006, 30:74-81.
45. Skoien AK, Wilhelmsen K, Gjesdal S: Occupational disability
caused by dizziness and vertigo: a register-based prospective
study. The British Journal Of General Practice 2008, 58:619-623.
46. Finch E, Brooks D, Stratford PW, Mayo NE: Physical Rehabilitation Out-
come Measures. A Guide to Enhanced Clinical Decision Making
2nd edi-
tion. Hamilton, Ontario: BC Decker Inc; 2002.
47. Christophersen K-A: Additive indexer. In Databehandling og statis-
tisk analyse med SPSS Edited by: Christophersen K-A. Oslo: Unipub
forlag; 2003:247-255.
48. Streiner DL, Norman GR: Health Measurement Scales a practical guide
to their development and use 3rd edition. Oxford: Oxford University
Press; 2003.
49. Preacher KJ, MacCallum RC: Repairing Tom Swift's Electric Fac-
tor Analysis Machine. Understanding Statistics 2003, 2:13-43.
50. Costello AB, Osborne JW: Best Practices in Exploratory Factor
Analysis: Four Recommmendations for Getting the Most
From Your Analysis. Practical Assessment, Research and Evaluation
2005:10.
51. Cohen J: Statistical power analysis for behavioural sciences 2nd edition.
Hillsdale, N. J.: Lawrence Erlbaum; 1988.
52. Hosmer DW, Lemeshow S: Applied Logistic Regression 2nd edition.
New York: John Wiley & Sons, Inc; 2000.
53. Domholdt E: Physical Therapy Research. Principles and applications 2nd
edition. Philadelphia: W.B. Saunders Company; 2000.
Publish with BioMed Central and every
scientist can read your work free of charge
"BioMed Central will be the most significant development for
disseminating the results of biomedical research in our lifetime."
Sir Paul Nurse, Cancer Research UK
Your research papers will be:
available free of charge to the entire biomedical community
peer reviewed and published immediately upon acceptance
cited in PubMed and archived on PubMed Central
yours — you keep the copyright
Submit your manuscript here:
/>BioMedcentral
Health and Quality of Life Outcomes 2009, 7:101 />Page 16 of 16
(page number not for citation purposes)
54. Shrout PE, Fleiss JL: Intraclass Correlations: Uses in Assessing
Rater Reliability. Psychological Bulletin 1979, 86:420-428.
55. Beaton DE: Understanding the relevance of measured change
through studies of responsiveness. SPINE 2000, 25:3192-3199.
56. Bland JM, Altman DG: Statistics notes: Measurement error. BMJ
1996, 312:1654.
57. de Vet HCW, Ostelo RWJG, Terwee CB, van der Roer N, Knol DL,
Beckerman H, Boers M, Bouter LM: Minimally important change
determined by a visual method integrating an anchor-based
and a distribution-based approach. Quality of Life Research 2007,
16:131-142.
58. Crosby RD, Kolotkin RL, Rhys WG: Defining clinically meaning-
ful change in health-related quality of life. Journal of Clinical Epi-
demiology 2003, 56:395-407.
59. Whitney SL, Herdman SJ: Physical Therapy Assessment of Ves-
tibular Hypofunction. In Vestibular rehabilitation 2nd edition. Edited
by: Herdman SJ. Philadelphia: F.A. Davis Company; 2000:371-372.
60. World Health Organization: International Classification of Func-
tioning, Disability and Health. 2001 [ />cations/icf/en/]. Geneva: WHO (ISBN - 10 9241545429)
61. Whitney SL, Borello-France D, Redfern MR: Comparison of gait
parameters of subjects with known periferal vestibular dis-
ease and age matched controls. Physical Therapy 1994:S36.
62. Jerosch-Herold C: An evidence-based approach to choosing
outcome measures: a checklist for the critical appraisal of
validity, reliability and responsiveness studies. British Journal of
Occupational Therapy 2005, 68:347-353.
63. Murray K, Carroll S, Hill K: Relationship between change in bal-
ance and self-reported handicap after vestibular rehabilita-
tion therapy. Physiother Res Int 2001, 6:251-263.
64. Liang MH: Evaluating Measurement Responsiveness. J Rheuma-
tol 1995:1191-1192.
65. Liang MH: Longitudinal construct validity: Establishment of
clinical meaning in patient evaluation instruments. Medical
care 2000, 38:84-90.
66. Stratford PW, Binkley JM, Riddle DL: Health Status Measures:
Strategies and Analytic Methods for Assessing Change
Scores. Physical Therapy 1996, 76:1109-1123.