AEROSOL CHEMICAL PROCESSES IN THE ENVIRONMENT - CHAPTER 2 docx
Bạn đang xem bản rút gọn của tài liệu. Xem và tải ngay bản đầy đủ của tài liệu tại đây (443.75 KB, 24 trang )
23
2
Physical Chemistry of
Aerosol Formation
Markku Kulmala, Timo Vesala, and Ari Laaksonen
CONTENTS
Introduction 23
Homogeneous Nucleation 25
One-Component Nucleation 25
Classical Theory 25
Self-Consistency 27
Nucleation Theorem 27
Scaling Correction to Classical Theory 28
Binary Nucleation 29
Classical Theory 29
Explicit Cluster Model 31
Hydration 32
Nucleation Rate 32
Heterogeneous Nucleation 33
Binary Heterogeneous Nucleation on Curved Surfaces 33
Free Energy of Embryo Formation 33
Nucleation Rate 35
Nucleation Probability 36
The Effect of Active Sites, Surface Diffusion, and Line Tension on Heterogeneous
Nucleation 36
Activation 38
Condensation 40
Vapor Pressures and Liquid Phase Activities 40
Mass Flux Expressions 42
Uncoupled Solution 42
Semi-Analytical Solution 43
Acknowledgments 44
References 45
INTRODUCTION
The formation and growth of aerosol particles in the presence of condensable vapors represent
processes of major importance in aerosol dynamics. The emergence of new particles from the vapor
changes both the aerosol size and composition distributions. The size distribution of the aerosol at
a given time is affected by particle growth rates, which in turn are governed partially by particle
compositions. Aerosol deposition, which transfers chemical species from the atmosphere, is influ-
enced by particle size. It is easy to see, therefore, that the physical and chemical aspects of aerosol
L829/frame/ch02 Page 23 Monday, January 31, 2000 2:03 PM
© 2000 by CRC Press LLC
24
Aerosol Chemical Processes in the Environment
dynamics are very closely coupled. In short, chemical reactions determine particle compositions
and modify their dynamics significantly, while the number, size, and composition of aerosol particles
determine conditions for heterogeneous and liquid-phase chemical reactions.
The formation of aerosol particles by gas-to-particle conversion (GPC) can take place through
several different mechanisms, including (1) reaction of gases to form low vapor pressure products
(e.g., the oxidation of sulfur dioxide to sulfuric acid), (2) one- or multicomponent (in the atmosphere
generally with water vapor) nucleation of those low pressure vapors, (3) vapor condensation onto
surfaces of preexisting particles, (4) reaction of gases at the surfaces of existing particles, and (5)
chemical reactions within the particles. Steps 1, 4, and 5 affect the compositions of both vapor and
liquid phases. Step 2 initiates the actual phase transition (step 3) and increases aerosol particle
number concentration, while step 3 increases aerosol mass.
The purpose of this chapter is to focus on Steps 2 and 3 of the rather generalized picture of
GPC given above. In actuality, the formation of new particles from the gas phase is only possible
through homogeneous nucleation, or through nucleation initiated by molecular ion clusters too
small to be classified as aerosol particles. Heterogeneous nucleation on insoluble particles initiates
changes in particle size and composition distributions, but does not increase particle number
concentration. Soluble aerosol particles may grow as a result of equilibrium uptake of vapors
(mostly water), but only when the vapor becomes supersaturated can significant mass transfer in
the form of condensation take place between the phases.
The driving force of the transition between vapor and liquid phases is the difference in vapor
pressures in gas phase and at liquid surfaces. For a species not dissociating in liquid phase, the
vapor pressure (
p
l,i
) at the surface of aerosol particle is given by:
(2.1)
Here,
X
i
is the mole fraction of component
i
,
Γ
i
is the activity coefficient,
Ke
i
is the Kelvin effect
(increase of saturation vapor pressure because of droplet curvature), and
p
s,i
is the saturation vapor
pressure (relative to planar surface). For more detailed discussion of liquid phase activities, refer
to the chapter subsection “Vapor Pressure and Liquid Phase Activities.”
If the partial pressure of species
i
in the gas phase (
p
g,i
) is higher than
p
l,i
, a net mass flux may
develop from gas phase to liquid phase. A prerequisite is the existence of (enough of) liquid surfaces;
this is the case if the aerosol contains a sufficient amount of soluble particles that are able to absorb
water and other vapors at subsaturated conditions (i.e., grow along their Köhler curves). Conden-
sation will then start as soon as the vapor becomes effectively supersaturated. However, if liquid
surfaces are not present, supersaturation may grow until heterogeneous nucleation wets dry particle
surfaces and triggers condensation. If the preexisting soluble and insoluble particle surface area is
not sufficient to deplete condensable vapors rapidly enough, supersaturation may reach a point
where homogeneous nucleation creates embryos of the new phase.
The phase transition between vapor and liquid phases is often made easier by the presence of
more than one condensing species. The reason for this can be understood from Equation 2.1: mixing
in the liquid phase tends to lower the equilibrium vapor pressure
p
l,i
of species
i
compared with
p
s,i
, and therefore effective saturation takes place at lower vapor densities in multicomponent vapor
than in vapor containing a single species.
Homogeneous nucleation may create new particles in air with low aerosol concentration, but
a high effective supersaturation is needed. Therefore, homogeneous nucleation is always a multi-
component process in the atmosphere, involving a vapor such as sulfuric acid, which has a very
low saturation vapor pressure and can form droplets with water even at low relative humidities.
Homogeneous nucleation of pure water requires relative humidities of several hundred percent,
and is thus out of the question in the atmosphere. Heterogeneous nucleation can take place at
p X TXKe TXp T
li
ii i si
,
,
(, ) (, ) ()=Γ
L829/frame/ch02 Page 24 Monday, January 31, 2000 2:03 PM
© 2000 by CRC Press LLC
Physical Chemistry of Aerosol Formation
25
significantly lower effective supersaturations than homogeneous nucleation. Atmospheric hetero-
geneous nucleation of water is, in principle, possible; the required relative humidities (R.H.) would
be just a few percent over one hundred (depending on the surface characteristics of the particles)
and lower still if some other vapor were to participate. However, usually the atmospheric R.H. does
not reach values high enough for heterogeneous nucleation of water to take place because rapid
condensation on soluble aerosol particles depletes the vapor already at relative humidities below
101%. This is the process predominantly responsible for the generation of clouds and fogs in the
atmosphere. Here, the starting point of condensation is not a genuine nucleation process, and can
be called activation of soluble aerosol particles. Note also that in the case of activation, other vapors
besides water may have an effect: by depressing the equilibrium vapor pressure of the particles
(
p
l,i
), they may lower the threshold R.H. at which activation takes place.
This chapter focuses on the various aspects of aerosol formation by gas-to-particle conversion.
Subsequent chapter sections are devoted to a review of theoretical investigations on one- and two-
component homogeneous nucleation; heterogeneous nucleation; activation of soluble particles; and
condensational growth of aerosol particles, respectively.
HOMOGENEOUS NUCLEATION
To date, several different theories have been proposed to explain homogeneous nucleation from
vapor (for review, see Reference 1). These theories can be roughly divided into microscopic and
macroscopic ones. From a theoretical point of view, the microscopic approach is more fundamental,
as the phenomenon is described starting from the interactions between individual molecules.
However, microscopic nucleation calculations have thus far been limited to molecules with relatively
simple interaction potentials, such as the Lennard-Jones potential, and are therefore of little practical
value to aerosol scientists who usually deal with molecules too complex to be described by these
potentials. The macroscopic theories, on the other hand, rely on measurable thermodynamic quan-
tities such as liquid densities, vapor pressures, and surface tensions. This enables them to be used
in connection with real molecular species; and although certain assumptions underlying these
theories can be called into question, their predictive success is in many cases reasonable. We shall
therefore focus on the macroscopic nucleation theories below.
O
NE
-C
OMPONENT
N
UCLEATION
Classical Theory
The first quantitative treatment that enabled the calculation of nucleation rate at given saturation
ratio and temperature was developed by Volmer and Weber,
2
Farkas,
3
Volmer,
4,5
Becker and Döring,
6
and Zeldovich,
7
and is called the classical nucleation theory. The classical theory relies on the
capillary approximation:
it is assumed that the density and surface energy of nucleating clusters
can be represented by those of bulk liquid. According to the classical theory, the reversible work
of forming a spherical cluster from
n
vapor molecules is equal to the Gibbs free energy change
and can be written as:
(2.2)
where the chemical potential change between the liquid and vapor phases is given by
∆µ
= –
kT
ln
S
,
S
is the saturation ratio of the vapor,
k
is the Boltzmann constant,
T
is temperature,
σ
is the
surface tension of bulk liquid,
A
denotes the surface area of the cluster with a volume of
V
=
nv
,
and
v
is the liquid-phase molecular volume. The equilibrium number concentration of
n
-clusters
is given by:
WGn A
n
==+∆∆µσ
L829/frame/ch02 Page 25 Monday, January 31, 2000 2:03 PM
© 2000 by CRC Press LLC
26
Aerosol Chemical Processes in the Environment
(2.3)
In the classical theory, the constant of proportionality
q
0
is assumed to be equal to
N
, the total
number density of molecular species in the supersaturated vapor (often approximated by the
monomer density).
In supersaturated vapor, the first term of Equation 2.2 is negative and proportional to the number
of molecules in the cluster, whereas the second term is positive and proportional to
n
2/3
. Conse-
quently, the Gibbs free energy will exhibit a maximum as a function of cluster size. The cluster
corresponding to the maximum is called critical, as it is in unstable equilibrium with the vapor;
clusters smaller than the critical one will tend to decay, whereas clusters larger than the critical
one will tend to grow further. Thus, the term “nucleation rate” refers to the number of critical
clusters appearing in a unit volume of supersaturated vapor in unit time. Below, the properties of
the critical cluster are denoted by an asterisk.
The radius
r
* of the critical cluster can be located by setting the derivative of
∆
G
with respect
to
n
zero, resulting in the so-called Kelvin equation:
(2.4)
The critical work of formation is then given by
(2.5)
To derive an equation for the nucleation rate, one has to consider the kinetics of cluster
formation; that is, rates at which clusters of various sizes grow because of addition of monomers
from the vapor (condensation), and rates at which they shrink because of evaporation. The details
of the kinetics are bypassed here (for more information, see e.g., Reference 8), noting just that the
steady-state nucleation rate is given by:
(2.6)
Here, the condensation rate
R
= (
kT
/2
π
m
)
1/2
NA
* is the number of molecules impinging on a unit
surface per unit time, multiplied by the surface area of the critical cluster,
m
is the mass of a vapor
molecule, and the so-called Zeldovich factor
(2.7)
accounts for the difference between the steady-state and equilibrium concentrations, and for the
possibility of re-evaporation of supercritical clusters. It is assumed here that the sticking probability
of molecules hitting the critical cluster is unity. In the steady-state, the cluster size distribution
remains constant as a function of time, which can result either from constant monomer concentration
(which is a generally used approximation), or from monomer production during nucleation. Note
that uncertainties in the pre-exponential factors of Equation 2.6 have a much smaller effect on the
value of the nucleation rate than uncertainties in
W
*.
Nq GkT
nn
=−
()
0
exp ∆
r
v
kT S
*
ln
=
2σ
W
v
kT S
*
(ln)
=
16
3
32
2
πσ
J RNZ W kT=−
()
exp *
Z
kT
v
A
=
σ 2
*
L829/frame/ch02 Page 26 Monday, January 31, 2000 2:03 PM
© 2000 by CRC Press LLC
Physical Chemistry of Aerosol Formation
27
Self-Consistency
Later investigators (Courtney,
9
Blander and Katz,
10
and Reiss et al.,
11
) have pointed out that with
q
0
=
N
, Equation 2.3 does not obey the law of mass action (see also Reference 12), and have argued
that a correct treatment of nucleation kinetics results in multiplication of
I
in Equation 2.6 by a
factor of 1/
S
(i.e.,
q
0
in Equation 2.3 should equal the number concentration of molecules in saturated
vapor). Relatedly, Girshick and Chiu
13
and Girshick
14
considered the limiting consistency problem
caused by the fact that the classical distribution of
n
-clusters does not return the identity
N
1
=
N
1
.
They proposed a self-consistency corrected (SCC) model in which the work of nucleus formation
is calculated from
(2.8)
where
A
1
is the surface area of a (spherical) monomer in liquid phase and CNT denotes classical
theory. The nucleation rate is then
(2.9)
Note that, although the SCC approach offers a correction for both the mass action consistency and
limiting consistency problems, the choice of Equation 2.8 must be regarded as somewhat arbitrary.
Wilemski
12
argued that the mass action consistency problem is more serious than the limiting
consistency problem because mass action consistency is fundamentally necessary, while limiting
consistency is not a fundamental property that must be satisfied by a distribution.
The predictive powers of the classical theory and the SCC model appear quite similar, although
the classical theory predicts lower nucleation rates than the SCC model. Both theories predict the
critical supersaturations
S
cr
(supersaturation at which the nucleation rate reaches a certain level) of
some substances rather well and others not so well; the classical theory seems to succeed especially
with butanol
15
and the SCC model with toluene.
13
The prediction of correct nucleation rates is
usually more difficult than that of critical supersaturations because
J
is generally a very steep
function of
S
, and thus both of the above theories predict in some cases nucleation rates differing
from the experimental ones by several orders of magnitude. A common problem with both theories
is the incorrect temperature dependence of the predicted
S
cr
found with many substances. In any
case, the fact that almost-correct critical supersaturations are predicted by theories relying on the
capillarity approximation is quite remarkable in itself.
N
UCLEATION
T
HEOREM
An important new development in nucleation studies is the rigorous proof of the so-called Nucle-
ation Theorem, given by Oxtoby and Kashchiev.
16
The Nucleation Theorem relates the variation
of work of formation of the critical cluster with its molecular content:
(2.10)
Here
n
i
denotes the number of molecules belonging to species
i
in a multicomponent vapor, and
µ
ig
is the gas-phase chemical potential of species
i
in a multicomponent vapor. This result was first
proposed for one-component systems by Kashchiev,
17
who assumed that the surface energy of the
WWkTSA
SCC CNT
**
ln=− −
1
σ
J
AkT
S
J
SCC CNT
=
()
exp
1
σ
∂
∂
=−
W
n
ig
T
i
jg
*
,
µ
µ
L829/frame/ch02 Page 27 Monday, January 31, 2000 2:03 PM
© 2000 by CRC Press LLC
28
Aerosol Chemical Processes in the Environment
nucleus is only weakly dependent on supersaturation. Viisanen et al.
18
derived the Nucleation
Theorem using statistical mechanical arguments that assume that the critical cluster and the sur-
rounding vapor can be treated as if decoupled. This approach was generalized to binary systems
by Strey and Viisanen,
19
and Viisanen et al.
20
extended Kashchiev’s original derivation to the two-
component case. However, only with the work of Oxtoby and Kashchiev
16
was it was realized that
the Nucleation Theorem is a completely general thermodynamic statement free of any specific
model-related assumptions, and holds down to the smallest nucleus sizes. The Nucleation Theorem
is particularly useful because it allows the measurement of numbers of molecules in critical clusters.
This is possible because the rate of nucleation depends on the work of nucleus formation and on
a pre-exponential kinetic factor, which in turn is only weakly dependent on supersaturation. It can
be shown that
(2.11)
where m is between 0 and 1. Measurements of molecular content of critical clusters have been
performed by Viisanen and Strey,
15
Viisanen et al.,
18,20,21
Strey and Viisanen,
19
Strey et al.,
22,23
and
Hruby et al.
24
These studies have shown that with one-component nuclei, the Kelvin equation
predicts the critical nucleus size surprisingly well, down to about 40 to 50 molecules.
Scaling Correction to Classical Theory
Applying the Nucleation theorem to a general form of reversible work of critical nucleus formation
W* = W
CNT
– f(n*, ∆µ), where the function f gives the departure from classical theory, McGraw
and Laaksonen
25
derived the following differential equation:
(2.12)
In the classical theory, f = 0, and the equation can be solved to give n*
CNT
= C(T)∆µ
–3
. The
temperature-dependent function C(T) is identified with the help of the Kelvin relation to be C(T)
= (32πσ
3
v
2
)/3.
In general, f is non-zero; and without additional information, Equation 2.12 cannot be solved.
However, in the special case that each side of Equation 2.12 vanishes separately, a class of
homogeneous solutions is obtained for n* and the product fn*:
(2.13)
(2.14)
As ∆µ → 1, one must have n* → n*
CNT
and, hence, C′(T) = C(T). Thus, in the generalized theory,
the number of molecules in the critical nucleus is the same as in the classical theory, in agreement
with experiments. The work of nucleus formation, on the other hand, becomes
(2.15)
that is, the difference from the classical theory being given by a function that depends on temperature
only and not only supersaturation. This is also in accord with experiments, as the classical theory
∂
∂
=+
(ln)
,
kT J
nm
ig
T
i
jg
µ
µ
∆
∆∆
∆µ
µµ
µ
dn
d
n
d
d
fg
*
**+=
()
32
nCT*()=′
−
∆µ
3
fn D T*()=
−
∆µ
1
WW DT
CNT
*
*
()=−
L829/frame/ch02 Page 28 Monday, January 31, 2000 2:03 PM
© 2000 by CRC Press LLC
Physical Chemistry of Aerosol Formation 29
predicts with many substances the supersaturation dependence of nucleation rate reasonably well.
(The predictions of the supersaturation dependence and the molecular content of the nucleus are
of course linked by the Nucleation Theorem.)
McGraw and Laaksonen
25
showed that the scaling relation (Equation 2.15) is supported by
results
26
from the density functional theory of nucleation
26
; but they did not present a general theory
for calculating the temperature-dependent function D(T). However, Talanquer
27
pointed out that
D(T) can be obtained by requiring that the work of nucleus formation, W*, goes to zero at the
spinodal line (see Reference 28). The function D(T) then becomes
(2.16)
Talanquer obtained the chemical potential at the spinodal, ∆µ
s
, from the Peng-Robinson equation
of state, and showed that this scaling correction (Equation 2.16) substantially improves the classical
nucleation rate predictions for several nonpolar and weakly polar substances.
BINARY NUCLEATION
Classical Theory
Classical binary nucleation theory (extension of the Kelvin equation to two-component systems)
was first used by Flood,
29
Volmer,
5
and Neumann and Döring.
30
Unaware of the earlier work, Reiss
31
considered binary nucleation, and noted that the growing binary clusters can be thought of as moving
on a saddle-shaped free energy surface, the saddle point corresponding to the critical cluster. Building
on Reiss’ work, Doyle
32
derived the so-called generalized Kelvin equations for binary critical
clusters. These equations contained derivatives of surface tension with respect to particle composi-
tion. In 1981, Renninger et al.
33
noted that the equations of Doyle were thermodynamically incon-
sistent, and that the correct binary Kelvin equations do not contain any compositional derivatives
of surface tension. This is, incidentally, in accord with the early German investigators. Wilemski
34
showed how the derivatives are removed by the correct use of the Gibbs adsorption equation, and
Mirabel and Reiss,
35
and Nishioka and Kusaka
36
later argued that there are even more fundamental
thermodynamical reasons for the derivative terms not to appear (see also Reference 28). The
discussion below, however, follows Wilemski’s derivation.
The change of Gibbs free energy of formation of a spherical binary liquid cluster from the
vapor phase is expressed as (e.g., see Reference 31)
(2.17)
where n
i
denotes the number of molecules of the ith species in the cluster, ∆µ
i
is the change of the
chemical potential of species i between the vapor phase and the liquid phase taken at the pressure
outside of the cluster, r is the radius of the cluster, and σ is the surface tension. The properties of
the cluster are assumed to be the same as for macroscopic systems with plane surfaces; and possible
effects on density and surface tension caused by the curvature of the cluster are neglected (the
capillarity approximation). Following Wilemski
34,37
and Zeng and Oxtoby,
26
one can write the total
number of molecules of species i in the cluster as:
(2.18)
Here, n
s
i
and n
b
i
are the numbers of surface and interior (“bulk”) molecules of the ith species
in the cluster, respectively. The above-mentioned thermodynamic quantities are determined using
the bulk mole fraction X
b
.
DT CT
s
() ()=
−
∆µ
2
2
∆∆ ∆Gn n r=+ +
11 2 2
2
4µµπσ
nnn
ii
s
i
b
=+
L829/frame/ch02 Page 29 Monday, January 31, 2000 2:03 PM
© 2000 by CRC Press LLC
30 Aerosol Chemical Processes in the Environment
The saddle point on the free energy surface can be found by setting
(2.19)
Applying these conditions to Equation 2.17 and making use of the Gibbs-Duhem equation and the
Gibbs adsorption isotherm (see, for example, References 34 and 37),
(2.20)
(2.21)
one obtains the binary Kelvin equations
(2.22)
The partial molecular volumes v
i
are related to the cluster radius as follows:
(2.23)
Note that the v
i
values depends on composition, and they are determined at X
b
. From the Kelvin
equations, one obtains
(2.24)
which can be solved numerically to find the bulk mole fraction X*
b
of the critical cluster at given
gas-phase chemical potentials. For the radius and the free energy of formation of the critical cluster,
one has
(2.25)
(2.26)
Finally, as noticed by Laaksonen et al.,
38
the total number of molecules in the critical cluster can
be calculated using Equations 2.23 and 2.27
(2.27)
(which follows from the addition of Equations 2.20 and 2.21).
The predictions of binary classical nucleation theory have been found to be qualitatively correct
in the case of nearly ideal mixtures.
19
However, for systems in which surface enrichment of one
of the components takes place (marked by considerable nonlinear variation of surface tension over
∂
∂
=
∆G
n
i
n
j
0
nd nd
bl bl
11 22
0µµ+=
nd nd Ad
sl sl
11 22
0µµσ++=
∆µ
σ
i
i
v
r
+=
2
0
*
4
3
3
11 2 2
πrnvnv=+
∆∆µµ
12 21
vv=
r
v
i
i
* =−
2σ
µ∆
∆Gr**=
4
3
2
πσ
nd nd Ad
ll
11 22
0µµσ++=
L829/frame/ch02 Page 30 Monday, January 31, 2000 2:03 PM
© 2000 by CRC Press LLC
Physical Chemistry of Aerosol Formation 31
the mole fraction range), the predictions of the theory become unphysical. For example, with
constant alcohol vapor concentration in a water/alcohol system, addition of water vapor will
suddenly result in lowering the predicted nucleation rate, associated with a prediction of negative
total number of water molecules in the critical cluster.
Explicit Cluster Model
An alternative (classical) way to find the critical cluster would be, instead of using the Kelvin
equations, to construct the free energy surface (∆G – n
1
– n
2
) with Equation 2.17, and locate the
saddle point, for example, with the help of a computer. This can be readily done with systems
exhibiting no surface enrichment, that is, if X
b
= X = n
2
/(n
1
+ n
2
). If this is not the case, a method
is needed to calculate X
b
for a general (n
1
, n
2
)-cluster. Flageollet-Daniel et al.
39
proposed to treat
water/alcohol clusters in terms of a microscopic model, allowing for enrichment of the alcohol at
the surface of the cluster, and at the same time depleting the interior of alcohol. Laaksonen and
Kulmala
40
have proposed an alternative explicit cluster model and demonstrated
41
that for a number
of water/alcohol systems, the agreement with the cluster model and experiments is rather good.
The cluster model describes a two-component liquid cluster as composed of a unimolecular
surface layer and an interior bulk core with
(2.28)
The volume of a cluster is calculated assuming a spherical shape. The numbers of molecules in
the surface layer are determined from
(2.29)
where A
i
is the partial molecular area of species i. The surface composition is assumed to be
connected to the surface tension of a bulk binary solution via a phenomenological relationship:
(2.30)
Here, X
s
= n
s
2
/(n
s
1
+ n
s
2
), and σ
i
denotes the surface tension of pure i. This description is, in effect,
an approximation to the Gibbs adsorption isotherm. The cluster size is allowed to affect the
distribution between surface and interior molecules as the partial molecular areas are taken as
curvature dependent (for details, see Reference 41). The cluster model predicts, for a given set of
total numbers of molecules at fixed gas temperature, the numbers of interior and surface molecules
in the cluster. The surface tension, liquid phase activities, and density are calculated using the
interior composition. These quantities and the total number of molecules are then used to determine
the binary nucleus by creating a saddle surface in three-dimensional (∆G – n
1
– n
2
) space and
searching the saddle point.
The principal difference between the cluster model and the classical theory is that in the former,
the cluster size is allowed to affect the relative fractions of the molecules at the surface and in the
interior, and thereby also the mole fraction of the critical cluster. Surprisingly enough, it seems
that this is sufficient for correcting the unphysical predictions of the classical theory, at least
qualitatively (although one should bear in mind that the approximate nature of Equation 2.30 and
the equations describing the molecular areas might contribute). Laaksonen
41
found that the theory
produced well-behaved activity plots (plots of vapor phase activities at which the nucleation rate
is constant at given temperature), and that the predicted nucleation rates were within 6 orders of
nnn
ii
s
i
b
=+
ArnAnA
ss
==+4
2
11 22
π
σ
σσ
X
Xv Xv
Xv Xv
b
ss
ss
()
=
−
()
+
−
()
+
1
1
11 2 2
12
L829/frame/ch02 Page 31 Monday, January 31, 2000 2:03 PM
© 2000 by CRC Press LLC
32 Aerosol Chemical Processes in the Environment
magnitude of the measured rates in several water/alcohol systems. Furthermore, Viisanen et al.
20
showed that the explicit cluster model predicts almost quantitatively correct numbers of molecules
in critical water/ethanol clusters over the whole composition range.
Hydration
The association of molecules in the vapor phase can significantly affect their nucleation behavior.
It is known that methanol, for example, has a considerable enthalpy of self-association, and one
should therefore treat both the theoretical predictions and experimental results of the methanol
nucleation with caution. Another system with a tendency to associate is the binary sulfuric
acid/water mixture, which is important in ambient aerosol formation. The very high enthalpy of
mixing of these species causes them to form hydrates in the gas phase. The hydrates consist of one
or more sulfuric acid and several water molecules, and have a stabilizing effect on the vapor. In
other words, it is energetically more difficult to form a critical nucleus out of hydrates than out of
monomers (although from a kinetic viewpoint, hydration does make nucleation a little bit easier).
Jaecker-Voirol et al.
42
deduced a correction for the classical free energy of cluster formation,
taking into account the effect of hydration. The hydrates were assumed to contain one sulfuric acid
and one or more water molecules. Expressing the chemical potential difference of species i with
the help of liquid and gas phase activities, one obtains
(2.31)
where the activities are given by A
il
= p
i,sol
/p
i,s
and A
ig
= p
i
/p
i,s
; and p
i
, p
i,s
, and p
i,sol
denote the partial
pressure, saturation vapor pressure, and vapor pressure over the solution, respectively.
The correction for the acid activities has the following form:
(2.32)
The correction factor C
h
due to hydration is given by:
(2.33)
where the subscripts w and a refer to water and acid, respectively, K
i
is the equilibrium constant
for hydrate formation, and h is the number of water molecules per hydrate. Jaecker-Voirol et al.
42
noted that an approximate expression is obtained for the equilibrium constants by taking the
derivative of ∆G of a hydrate with respect to the number of water molecules. Kulmala et al.
43
extended the classical hydration model into systems where the gas phase number concentrations
of acid and water molecules may be of the same order of magnitude. They also showed that the
fraction of free molecules to the total number of molecules in the vapor can be solved numerically,
rendering the equilibrium constants unnecessary. However, the resulting sulfuric acid hydrate
distributions were shown to be similar to those calculated by Jaecker-Voirol et al.
42
Nucleation Rate
The nucleation rate in a binary system is:
44
∆µ
i
ig
il
kT
A
A
=− ln
−
=− −kT
A
A
kT
A
A
kT C
ag
al
cor
ag
al
h
ln ln ln
C
Kp KK Kp
Kp KK Kp
h
w sol h w sol
h
w
h
w
h
n
a
=
++…+×…×
++…+×…×
1
1
112
112
,,
L829/frame/ch02 Page 32 Monday, January 31, 2000 2:03 PM
© 2000 by CRC Press LLC
Physical Chemistry of Aerosol Formation 33
(2.34)
Here, F is the total number of molecular species in the vapor, and R
AV
is the average condensation
rate. For nonassociating vapors, one obtains
(2.35)
where Φ is the angle between the n
2
-axis and the direction of cluster growth at the saddle point of
the free energy surface. The Zeldovich nonequilibrium factor Z can be obtained from second
derivatives of ∆G at the saddle point (see Reference 44 for details). An approximate expression for
Z was given by Kulmala and Viisanen,
45
who derived the classical binary equations starting from
the “average monomer” concept. In this case the Zeldovich factor is reduced to that of the one-
component case (Equation 2.7 with v = (1 – X)v
1
+ Xv
2
) and S = (A
1g
/A
1l
)
1–X
(A
2g
/A
2l
)
X
. The
corresponding approximate growth angle is the steepest descent angle with tan Φ = X/(1 – X).
Although it is true that the nucleation rate is governed primarily by the exponent of ∆G, one
should be careful when using the kinetic expressions. Kulmala and Laaksonen
46
showed that various
kinetic expressions presented in the literature produced H
2
O/H
2
SO
4
nucleation rates differing from
each other by several orders of magnitude. In a recent study, Vehkamäki et al.
47
used numerical
methods to solve the binary kinetic equations exactly. They found that in the water/sulfuric acid
system the exact rates were within one order of magnitude of those produced by the analytical
expressions of Stauffer.
44
HETEROGENEOUS NUCLEATION
The quantification of heterogeneous nucleation is even more difficult than that of homogeneous
nucleation. This is due to the complexity of interactions between the nucleating molecules and the
underlying surface. The heterogeneous nucleation rate is strongly dependent on the characteristics
of the surface, and it is extremely difficult to produce well-defined surfaces for experimental
investigations. The lack of experimental data, on the other hand, makes it difficult to verify any
theoretical ideas. It seems probable that in the future more information of the details of heteroge-
neous nucleation phenomena will be acquired through molecular dynamics or Monte Carlo simu-
lations, rather than through laboratory experiments (see Reference 48).
A further complication, compared to laboratory conditions, emerges when one tries to carry
out calculations of heterogeneous nucleation at ambient conditions: in the lab, the surface materials
at least are known, but this is usually not the case in the atmosphere. The uncertainties associated
with atmospheric heterogeneous nucleation calculations can therefore by very large. However, some
guidance can be acquired about the conditions at which heterogeneous nucleation can take place
using the classical nucleation theory, which is reviewed below. Also considered are some factors
that may be important, but are left out of the classical description.
BINARY HETEROGENEOUS NUCLEATION ON CURVED SURFACES
Free Energy of Embryo Formation
In classical nucleation theory, the Gibbs free energy of formation of a liquid embryo from a binary
mixture of vapors onto a curved surface is given by the expression
49
:
(2.36)
I R FZ G kT
AV
=−
()
exp *∆
R
RR
RR
AV
=
+
12
1
2
2
2
sin cosΦΦ
∆GnkT
A
A
nkT
A
A
SS
a
ag
al
b
bg
bl
=− − + + −
()
ln ln
12 12 23 13 23
σσσ
L829/frame/ch02 Page 33 Monday, January 31, 2000 2:03 PM
© 2000 by CRC Press LLC
34 Aerosol Chemical Processes in the Environment
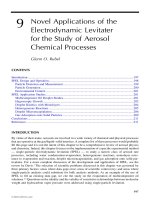
σ
ij
and S
ij
are the surface free energy and surface area of the interface, respectively, between phases
i and j. The gas phase is indexed by 1, the liquid phase embryo by 2, and the substrate by 3. The
contact angle θ is given by cos θ = m = (σ
13
–σ
23
)/σ
12
, and the values of S
12
and S
23
by
(2.37)
(2.38)
Here,
(2.39)
(2.40)
(2.41)
where r is the radius of the embryo and R
p
the radius of the solid surface (see Figure 2.1).
One should notice that the heterogeneous nucleation theory gives the same value for the critical
radius as the homogeneous theory. However, the differentiation demands some calculus. After it is
completed, one finds that the critical value for the Gibbs free energy is given by (see, for example,
Reference 49):
(2.42)
FIGURE 2.1 A cluster (2) on aerosol particle (3) in gas phase (1).
Sr
12
2
21=−
()
πψcos
SR
p23
2
21=−
()
πφcos
cos ψ=−
−
()
rRm
d
p
cos φ=
−
()
Rrm
d
p
dRr rRm
pp
=+−
()
22
12
2
/
∆Grfmx*
*
(,)=
2
3
2
12
πσ
L829/frame/ch02 Page 34 Monday, January 31, 2000 2:03 PM
© 2000 by CRC Press LLC
Physical Chemistry of Aerosol Formation 35
where
(2.43)
and
(2.44)
and
(2.45)
Nucleation Rate
The nucleation rate can be given as (see References 44 and 46):
(2.46)
Here, F denotes the total number of nucleating molecules, clusters, particles, etc., depending on
the system in question. (For example, in homogeneous nucleation, F would be the total number of
molecules in the vapor, and in ion-induced nucleation the number of ions). In the case of hetero-
geneous nucleation, the identification of F is not straightforward. Several different expressions for
the heterogeneous nucleation rate can be found in the literature. These differ from each other in
the way of counting F; one can use the binary sulfuric acid/water system as an example.
When very small solid particles act as condensation nuclei, the nucleation rate is defined as
50
:
(2.47)
Here, N
par
is the number concentration of the solid particles.
Another formula includes the adsorption mechanism through the quantity N
ads
(the number of
water and acid molecules adsorbed per unit area on the solid nuclei). In the case of atmospheric
H
2
SO
4
, the number of acid molecules is several orders of magnitude smaller than the number of
water molecules, and it is sufficient to count only the adsorbed water molecules N
w
ads
= βτ. Here,
β is the impinging rate of molecules on the surface of the solid particle, and τ is the time that a
molecule spends on the surface of the solid particle, given by τ = τ
o
exp(E/RT), where τ
o
is a
characteristic time and E is the heat of adsorption. Hamill et al.
51
used the value 2.4 × 10
–16
s for
τ
o
, and the value 10,800 cal mol
–1
for E. Lazaridis et al.,
52
on the other hand, made use of the fact
that τ
o
corresponds to 1/ν
o
,
53
where ν
o
is the characteristic frequency of vibration. The vibration
between two molecules can be calculated using the nearest-neighbor harmonic oscillator approxi-
mation. The angular frequency (ω) of the oscillator is:
(2.48)
fmx
mx
g
x
xm
g
xm
g
mx
xm
g
(,)=+
−
+−
−
+
−
+
−
−
1
1
23 3 1
3
3
3
2
gxmx=+ −
()
12
2
12/
x
R
r
p
=
*
IRFZ
G
kT
av
=−
exp
*∆
IRNZ
G
kT
av par1
=−
exp
*∆
ωπν
µ
== ⋅2
1
2
2
dV
dr m
L829/frame/ch02 Page 35 Monday, January 31, 2000 2:03 PM
© 2000 by CRC Press LLC
36 Aerosol Chemical Processes in the Environment
where m
µ
is the reduced mass of the two molecules. For V, Lazaridis et al.
52
used the modified
Lennard-Jones potential of polar molecules, resulting in τ
o
= 2.55 × 10
–13
s, which corresponds to
water–water interaction. For E, they used the latent heat of condensation (see Reference 53).
The minimum nucleation rate is now given by
51
(2.49)
and the maximum nucleation rate by
51
(2.50)
The minimum nucleation rate has been derived assuming the nucleation takes place when the
condensation nucleus is covered with critical clusters. The expression for maximum rate assumes
that a new particle is produced instantaneously when one critical cluster is formed on the conden-
sation nucleus.
51
The effect of sulfuric acid hydration can be included in the expressions for the nucleation rate.
For details, see Reference 52.
NUCLEATION PROBABILITY
The heterogeneous nucleation rate is a somewhat arbitrary concept. In some cases, it would be
better to consider the number of aerosol particles that have nucleated. This number depends on the
nucleation time (or duration of the experiment), nucleation rate (per unit time and unit area), and
the surface area of the pre-existing particle. Denote the initial number concentration of aerosol
particles by N
0
. The number of non-nucleated particles can be obtained by solving the following
differential equation.
(2.51)
After integration, one has, for non-nucleated particles,
(2.52)
The probability of an embryo appearing on an aerosol particle with radius R
p
is then:
(2.53)
and τ is the duration of the experiment, or nucleation time.
THE EFFECT OF ACTIVE SITES, SURFACE DIFFUSION, AND LINE TENSION ON
H
ETEROGENEOUS NUCLEATION
Lazaridis et al.
54
have developed a model for heterogeneous nucleation on aerosol particles with
so-called active sites, following the work of Gorbunov and Kakutkina.
55
Active sites refer to areas
at which nucleation is easier compared to the surroundings. Active sites may be caused by variations
IrNRZN
G
kT
w
ads
av par2
2
=−
π * exp
*∆
IRNRZN
G
kT
w
ads
av par3
2
4=−
π exp
*∆
dN
dt
NI R
p
=− 4
2
π
NN RI
p
=−
[]
0
2
4exp πτ
PRI
p
=− −
[]
14
2
exp πτ
L829/frame/ch02 Page 36 Monday, January 31, 2000 2:03 PM
© 2000 by CRC Press LLC
Physical Chemistry of Aerosol Formation 37
in surface composition, curvature, roughness, etc. In the model of Lazaridis et al.,
54
the interaction
between an embryo and an active site is described by a contact angle smaller than that between
the embryo and the surrounding substrate. The embryo formation occurs via three successive stages.
In the beginning, the surface area of the interface between the liquid embryo and the substrate (S
23
)
is smaller than the surface area of the active site (S). When the embryo has grown enough, so that
S
23
= S, the contact angle, and thereby the form of the embryo, start to change. Finally, after the
transformation stage, the embryo continues to grow with a new contact angle. As expected, active
sites enhance the nucleation rate. Furthermore, Lazaridis et al.
54
found that the curve describing
nucleation probability as a function of particle size has a steeper slope in the active site model
compared with a model employing uniform surfaces.
Another important feature missing from the classical theory is surface diffusion. Pound et al.
56
has pointed out that surface diffusion delivers molecules more efficiently to the embryo than
impingement from the vapor. The two-dimensional diffusion coefficient can be determined as (see
Reference 57):
(2.54)
Here, δ is the mean jump distance, and τ
D
the average jump time from site to site:
(2.55)
with τ
0
denoting the vibration period of an adatom and U the activation energy for diffusion. The
rate of molecules arriving to the embryo is given by the following expression (see, for example,
Reference 58):
(2.56)
v
is the average velocity of the adsorbed molecules (v = δ/τ
D
). The nucleation rate per unit area
and unit time is given by:
(2.57)
Lazaridis
58
found several orders of magnitude enhancements in theoretical nucleation rates of water
at 273K when surface diffusion was allowed for.
The discontinuity of two or more volume phases is connected to surface tension. Line tension,
on the other hand, arises from the discontinuity between two or more surface phases. The Gibbs
free energy, which takes into account the line tension (σ
t
), is
(2.58)
The inclusion of a positive line tension increases the critical value for the Gibbs free energy
and decreases the corresponding nucleation rate and nucleation probability. However, experi-
mental results show higher nucleation rates than the classical theory.
59
The concept of negative
line tension, which has been studied by Scheludko et al.,
60
will decrease the Gibbs free energy
D
D
=
δ
τ
2
4
ττ
D
UUT=−
()
0
exp /
RR
Nv
aa p
a
ads
=
2πφ
φ
sin
I R ZN G kT
aa
ads
=−
()
exp *∆
∆Grfmx
R
SR
t
p
pt
**(,)
tan
sin=−+
2
3
2
2
12 23
πσ
σ
φ
πσ φ
L829/frame/ch02 Page 37 Monday, January 31, 2000 2:03 PM
© 2000 by CRC Press LLC
38 Aerosol Chemical Processes in the Environment
and increase the nucleation rate. Lazaridis
58
has studied the effect of line tension on heterogeneous
nucleation in more detail.
ACTIVATION
Recent studies have shown (see, for example, Reference 61) that atmospheric aerosol particles are
very often internally mixed (i.e., they are at least partly soluble). This section examines the activation
process, which will follow the hygroscopic growth of soluble aerosol particles. In the atmosphere,
the most important solvent is water; however, other vapors may take part in the process.
Traditionally, the activation of aerosol particles into cloud droplets has been described by the
Köhler theory (see, for example, Reference 62); as the saturation ratio S of water increases,
hygroscopic salt particles take up water so that they stay in equilibrium with the environment.
When S exceeds 100% (usually by a fraction of 1%, the exact number depending on the particle
size and on its composition), the particles start to grow spontaneously. A Köhler curve plots the
particle radius versus the saturation ratio; a maximum in S is seen at the activation radius of the
particle in question.
In the ordinary Köhler theory, a solution droplet consisting of water and some nonvolatile salt
is considered. The Kelvin equation for the droplet reads
(2.59)
Here, p
1
is the partial vapor pressure of water. The vapor pressure of water above the solution is
determined by the liquid phase activity.
When other condensable vapor (typically some acid) is present in the system and condenses
on the droplet simultaneously with water, Equation 2.59 is still valid. However, all thermodynamic
variables now refer to the ternary solution; and to complete the calculation, one has to find out the
acid mole fraction. One can therefore write a second Kelvin equation that describes the equilibrium
of the acid:
(2.60)
Equations 2.59 and 2.60 can now be solved simultaneously with a simple iterative method to
yield the equilibrium radius of the ternary solution droplet at any (p
1
, p
2
). One thus obtains a Köhler
surface rather than a Köhler curve, the axes being the particle radius and the saturation ratios of
the two vapors. The question that arises is: what is the route that a droplet follows in crossing this
surface? Kulmala et al.
63
presented equilibrium curves for droplets at various constant nitric acid
vapor concentrations. Such conditions could be realized, for example, in flow diffusion chambers,
where the walls act as a source for vapor. However, in atmospheric situations, condensation depletes
the water-soluble vapor; that is, in equilibrium growth calculations, it is necessary to account for
the conservation of number of moles:
(2.61)
where n
2g
= N
2
/C, N
2
is the gas phase concentration of species 2, and C is the concentration of
droplets, n
2
is number of moles of species 2 in a droplet, and the total number of moles n
t
is a
constant that usually equals n
2g
at low R.H.
ln
,
p
p
v
kTr
sol
1
1
1
2
=
σ
ln
,
p
p
v
kTr
sol
2
2
2
2
=
σ
nnn
gt22
+=
L829/frame/ch02 Page 38 Monday, January 31, 2000 2:03 PM
© 2000 by CRC Press LLC
Physical Chemistry of Aerosol Formation 39
To determine the equilibrium growth curve in the presence of a highly water-soluble gas such
as nitric acid by solving Equations 2.59 to 2.61 numerically, one needs thermodynamic data such
as equilibrium vapor pressures as functions of mole fractions and temperature for the three-
component system. (Actually, the system has more than three components, as far as the thermo-
dynamic data is concerned, because the salt and the acid are decomposed into various ionic species
in the liquid phase.) When the droplets are dilute enough (R.H. above 99%) and the dry particles
are larger than about 30 nm, Equations 2.59 to 2.61 can be cast in the form of a single equation.
64
Furthermore, the effect caused by a slightly soluble aerosol species
65
that contributes solute into
the liquid phase throughout droplet growth can be accounted for (see Reference 64 for details).
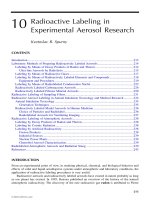
Figure 2.2 shows what happens to an ordinary Köhler curve calculated for 30-nm ammonium sulfate
particles when the effects of a slightly soluble 500-nm calcium sulfate core and absorption of 1
ppb of nitric acid are taken into account (droplet concentration 100 cm
–3
).
66
The figure indicates
that nonactivated droplets can grow to a 10-µm size range, forming a visible pollution fog. (Note
that the fog has to be formed relatively slowly for nonactivated droplets to grow to large sizes;
otherwise, the ambient R.H. might exceed 100% and activation may take place.)
With most clouds, the activation of aerosol particles is a very dynamic process as the ambient
parameters (temperature, vapor concentrations) change constantly while the droplets are growing,
and water vapor depletion is no longer an equilibrium process. It is therefore advisable to use
condensation theories in studies of cloud droplet activation. Kulmala et al.
63,67
have studied the
FIGURE 2.2 Curve (a) is the conventional Köhler curve for an initial 30-nm dry particle consisting of
ammonium sulfate at 298K. Curve (b) shows the effect of an insoluble 400-nm core; the amount of ammonium
sulfate is the same as with curve (a). The effect of insoluble material was studied in detail by Hänel.
86
Curve
(c) shows what happens when the 400-nm core consists of slightly soluble rather than insoluble material. The
solubility used (0.00209 g cm
–3
) corresponds to that of CaSO
4
.
87
The sharp minimum of the curve shows the
point at which all of the core is dissolved. CaSO
4
was chosen as the example because it occurs commonly as
gypsum dust or as the product of reaction of CaO in fly ash with H
2
SO
4
in the air. CaSO
4
has been found in
fogwater collected in Po Valley, Italy.
88
Other possibilities exist, including many slightly soluble organics. In
curve (d), the effect of a highly soluble gas, nitric acid, has been added. The initial gas phase concentration
of HNO
3
is 1 ppbv, and the Henry’s law constant used
89
(mole fraction scale) is 853.1 atm
–1
. Because nitric
acid is allowed to deplete from the gas as it is absorbed by the droplets, its effect depends on the aerosol
number concentration, which in this case was assumed to be 100 cm
–3
; the aerosol size distribution was taken
to be monodisperse (note that a qualitatively similar curve would result if the aerosol population was 1000
cm
–3
and the initial HNO
3
concentration 3 ppbv.) The smooth minimum in the curve is caused by the depletion
of the acid from the gas.
L829/frame/ch02 Page 39 Monday, January 31, 2000 2:03 PM
© 2000 by CRC Press LLC
40 Aerosol Chemical Processes in the Environment
activation and growth of cloud droplets using an air parcel model that describes the formation of
a convective cloud. Simultaneous condensation of water and nitric acid vapors were allowed for.
The study showed that enhanced nitric acid concentrations increased the number of pre-existing
aerosol particles that were able to activate. Consequently, the cloud droplet concentration was
increased and average droplet size decreased.
CONDENSATION
Condensation follows the first step of the phase transition, be it nucleation or activation. Conden-
sation causes an increasing amount of the new phase to accumulate on liquid or solid particles
suspended in the gas. Unlike with nucleation, the theory of condensation is well-established, and
agreement with experimental results is rather good (see, for example, Reference 68). The main
difficulty in the determination of mass and heat fluxes is the lack of accurate, experimentally verified
liquid phase activities. Finding data is not an easy task, especially in the case of multicomponent
mixtures, and quite approximate semi-empirical expressions are often used. This section considers
first the determination of liquid activities and vapor pressures at the droplet surface; and then
provides two useful expressions for mass fluxes in the transition and continuum regime. By means
of these expressions, the rates of the droplet composition and mass, the quantities that fully describe
the droplet evolution, can be formulated. In evaluation of the growth of droplet population, these
rate equations are coupled with expressions for variables of surrounding atmosphere (temperature,
pressure, partial pressures, etc.). For details, see References 68 to 70.
VAPOR PRESSURES AND LIQUID PHASE ACTIVITIES
To determine the partial vapor pressures just above the droplet surface, one must know the corre-
sponding equilibrium vapor pressures (these two are the same only if the droplet is large enough
for the mass transport to be wholly diffusion controlled). To calculate the equilibrium vapor
pressures of species in a liquid mixture, one needs their saturation vapor pressures and activities.
The vapor pressure of species i for a flat surface is given by (see Reference 71):
(2.62)
where p
is,f
is the saturation vapor pressure of pure species i for a flat surface, and A
i
is the activity
of species i in the liquid mixture. The saturation vapor pressure varies exponentially with the
temperature. The activity of species i at some temperature, pressure, and composition is defined
as the ratio of the fugacity of species i at these conditions to the fugacity of species i in some
standard state (see, for example, Reference 72).
For nondissociating species (and approximately for weak acids and alkalis, including water),
a convenient way of expressing the activity is to introduce the activity coefficient Γ
i
of species i
by the definition
(2.63)
where X
il,a
is the mole fraction of species i in the liquid. The activity coefficient depends on
temperature, composition, and pressure. However, far from critical conditions, and unless the
pressure is large, the effect of pressure on the activity coefficient is usually small.
73
The activity is
commonly defined so that the activity of the exceeding component approaches its mole fraction as
its X → 1. Then, according to this definition and Equation 2.63, Γ
i
→ 1 as X
il,a
→ 1. Consequently,
the expression for the equilibrium vapor pressure of species i above a flat surface is given by:
pAp
ia f
i
is f,,
=
Γ
i
i
il a
A
X
≡
,
L829/frame/ch02 Page 40 Monday, January 31, 2000 2:03 PM
© 2000 by CRC Press LLC
Physical Chemistry of Aerosol Formation 41
(2.64)
This is now the general formula for nondissociating species and it reduces to two useful
expressions for trace species. At the limit X
il,a
→ 0, the activity coefficient approaches a finite,
temperature-dependent value, and the product Γ
i
p
is,f
is called Henry’s law coefficient (or absorption
equilibrium constant). In this definition, Henry’s law coefficient has a dimension of pressure, but
there are also other, physically equivalent definitions for which one can refer to Reference 72. At
the limit X
il,a
→ 1, by definition Γ
i
→ 1, and consequently, p
ia,f
= X
il,a
p
is,f
. This is called Raoult’s law.
For completely dissociating species (salts, strong acids, and alkalis), a convenient way of
expressing the equilibrium vapor pressure over a flat surface is:
(2.65)
where X
+
il,a
and X
–
il,a
indicate mole fractions of positive and negative ions, respectively, forming
the species concerned. They are calculated on the basis of the total number of components present
in the solution. f
±
*
2
is the mean rational activity coefficient (i.e., infinite dilution is taken to be the
standard state), and K
Hx
is the Henry’s law constant (now in units of Pa
–1
). For further information
on dissociating species, refer to works of Clegg and Brimblecombe
74
and Clegg et al.
75
Finally, one must account for the effect of surface curvature. The curvature modifies slightly
the attractive forces between surface molecules, with the net result that the vapor pressure is higher
than that for a flat surface. Now, the expression for the vapor pressure of species i at the droplet
surface is given by (see References 76 and 77):
(2.66)
or, for dissociating species, by:
(2.67)
where σ is the surface tension, v is the molecular volume of the liquid mixture, and r is the droplet
radius. The effect of the curvature is called the Kelvin effect, and it becomes significant for particles
smaller than about 1 µm.
For the final goal of determining the mass fluxes, one must know the partial vapor pressures
just above the droplet surface. In the continuum, regime, the droplet surface can be assumed to be
saturated and the equilibrium achieved; that is, the vapor pressure of species i just above the droplet
surface is the same as at the droplet surface. Thus, in the continuum regime, the mole fraction X
ia
of species i just above the droplet surface is found by the ideal gas assumption as:
(2.68)
where p is the total gas pressure.
In the transition regime, the saturation equilibrium is disturbed, and the vapor pressures just
above the droplet surface are lower than the equilibrium vapor pressure. In calculating the mass
fluxes, the disturbance of the saturation equilibrium can be formally taken into account by a
correction factor (see Equation 2.72).
pXp
ia f
i
il a is f,,,
=Γ
pXXfK
ia f
dis
il a il a
Hx
,,,
*
=
+−
±
2
pp
v
kTr
ia
ia f
=
,
exp
2σ
pp
v
kTr
ia
ia f
dis
=
,
exp
2σ
X
p
p
ia
ia
=
L829/frame/ch02 Page 41 Monday, January 31, 2000 2:03 PM
© 2000 by CRC Press LLC
42 Aerosol Chemical Processes in the Environment
MASS FLUX EXPRESSIONS
Several mass flux expressions and growth equations can be found in the literature. The well-known
Mason equation is based on inaccurate approximations (see Reference 78). Presented here are two
useful, physically sound expressions (see References 68, 79, and 80).
Presented first are the mass flux expressions that explicitly include the droplet temperature. In
the second approach, the effect of the droplet temperature is taken into account implicitly. In
practice, the uncoupled approach can be applied in all atmospheric aerosol problems and the semi-
analytical approach is valid when the sum of the saturation ratio is near 1.
Uncoupled Solution
Consider first the so-called uncoupled approach because it is frequently applied and typically gives
accurate enough results when compared with experiments (see References 81 and 82). It is some-
what simplified compared to the exact expression for binary condensation,
79
as the Stefan flow
contribution for the flux I
i
is assumed to be caused by diffusion of species i alone, rather than by
diffusion of both species. However, contrary to the exact solution, the uncoupled solution allows
for the exact temperature dependencies of molar density and diffusion coefficients.
The most rigorous uncoupled expressions have been derived by Kulmala and Vesala
80
and are
given by:
(2.69)
or
(2.70)
where M
i
is the molecular weight (g mole
–1
) of vapor i, R is the universal gas constant, T
∞
is the
(ambient) temperature far from the droplet, and X
ia
are estimated using Equation 2.68. The binary
diffusion coefficients (D
iI
) between the vapor i and the carrier gas are calculated at the temperature
far from the droplet. The correction factors C
i
are needed because of the temperature profile around
the droplet. The following form of C
i
takes into account the temperature dependence of the diffusion
coefficients more rigorously than the commonly used geometric mean:
(2.71)
Here, T
a
is the droplet temperature and µ
i
is the exponent for the temperature dependencies of the
binary diffusion coefficients (D
i
∝ T
µ
i
). The exponent varies in most cases from 1.5 to 2.0,
73
and
at the limit µ → 2.0, the value for the correction factor is obtained in a straightforward manner.
Note that at the limits X
i
→ 0 the logarithmic terms are reduced to (X
ia
–
X
i∞
). This form does
not take into account the effect of the convective-like Stefan flow, which is toward the droplet
surface in the case of condensation. Physically, the carrier gas (air) and the vapor diffuse in opposite
directions; and because the carrier gas is not released from the droplet, the total molar density
would tend to decrease near the droplet surface were it not for the Stefan flow. In atmospheric
applications, the Stefan flow is typically insignificant because the vapor mole fractions are very
small.
IC
rM D p
RT
X
X
I
a
11
11 1
1
81
1
=
−
−
∞
∞
π
ln
IC
rM D p
RT
X
X
I
a
22
22 2
2
81
1
=
−
−
∞
∞
π
ln
C
TT
TT T
i
a
i
a
iii
=
−
−
−
∞
∞
−
∞
−−µµµ
µ
12 2
2
L829/frame/ch02 Page 42 Monday, January 31, 2000 2:03 PM
© 2000 by CRC Press LLC
Physical Chemistry of Aerosol Formation 43
In the transition regime, the transport of mass and heat is partly under mass diffusion and heat
conduction control, and partly under mass kinetic and heat kinetic control. To take this into account,
the above mass flux expressions are commonly multiplied by a semi-empirical correction factor.
One can adopt the following correction factor from Fuchs and Sutugin
83
:
(2.72)
where a dimensionless group, the Knudsen number, is:
(2.73)
λ
i
is the mean effective free bath of the vapor molecules i in the gas and, thus, the Knudsen number
is the ratio of two length scales — a length scale λ
i
characterizing the gas with respect to the
transport of mass, and a length scale r characterizing the droplet. From simple kinetic theory of
gases, the zero-order approximation for λ
i
can be expressed by means of a measurable macroscopic
property D
iI
and the average absolute velocity of the vapor molecules (e.g., see Reference 84). The
proper value of the mass accommodation coefficient α
M,i
for various substances has recently been
under discussion. The condensational growth of binary and unary droplets has been measured with
high accuracy in an expansion cloud chamber to determine accommodation coefficients.
81,82,85
The
size range where these measurements are valid is from 0.5 to 10 µm. The experimental results
show that the accommodation coefficient is 1 or near 1 for water, n-alcohols, and n-nonane
molecules impinging on a respective liquid interface, and also for some mixtures like water/n-
propanol and water/nitric acid. If there is no experimentally verified information available, it is
suggested that unity be used for the accommodation coefficient — this is consistent with recent
theoretical work.
86
In order to apply the expressions for the mass fluxes, the droplet temperature should be known.
In the case of a flat internal temperature profile and insignificant droplet thermal capacity, the
algebraic, but implicit expression for the droplet temperature can be derived using the droplet
energy balance. In practice, the most useful expression is (see, for example, Reference 85):
(2.74)
where L
i
is the latent heat of vaporization and k
a
and k
∞
are the gaseous thermal conductivities at
the droplet and ambient temperatures, respectively. β
T
is the transitional correction factor for the
heat transfer, and it can be estimated by means of Equation 2.72, where the mass accommodation
coefficient is replaced by the thermal accommodation coefficient (commonly set to unity), and the
mean free path used for the Knudsen number is expressed by a gaseous heat conductivity and the
average absolute velocity of vapor molecules (see Reference 84). If the thermal capacity is included,
the droplet temperature can be estimated using a first-order differential equation. For various ways
to analyze the droplet temperature, refer to Reference 80.
Semi-Analytical Solution
For several applications, an analytical form of mass flux expressions without the dependence on
the droplet temperature is desirable. Expressions in this form can be derived by replacing the
β
αα
Mi
i
Mi
i
Mi
i
Kn
Kn Kn
,
,,
.
=
+
++
+
1
1
4
3
0 337
4
3
2
Kn
r
i
i
=
λ
TT
LI LI
akk
a
Ta
=−
+
+
()
∞
∞
11 2 2
2πβ
L829/frame/ch02 Page 43 Monday, January 31, 2000 2:03 PM
© 2000 by CRC Press LLC
44 Aerosol Chemical Processes in the Environment
explicit droplet temperature dependence by the dependence on the products of latent heats and
mass fluxes. Following this approach, linearizing with respect to mass fluxes and neglecting the
effects of the Stefan flows and the radiative heat transport, mass fluxes can be found as solutions
for the equations
63
:
(2.75)
where A
ig
is the gas phase activity.
The solution for the preceding set of equations is
63
(2.76)
where
(2.77)
Note that although the mass fluxes now depend on saturation deficits of both species, these
expressions do not take into account the diffusive coupling arising from the Stefan flows, but here
the coupling arises from the elimination of the explicit dependence on the droplet temperature. The
fact that the droplet temperature is not equal to the gas temperature is described approximately in
the above equations, by means of terms containing latent heats of vaporization. This gives rise to
the coupling of mass fluxes. In the uncoupled approach, the temperature coupling is taken into
account by the explicit temperature dependence.
ACKNOWLEDGMENTS
The authors would like to acknowledge financial support from the Academy of Finland (project
44278) and from the Petroleum Research fund of the American Chemical Society.
Ir
MDpT
RT
AA
LM LI LI
rkRT
Ir
MDpT
RT
AA
LM LI L
Msf
g
T
Msf
g
1
1111
11
1111 22
2
2
2222
22
2211 2
41
4
41
=−
()
−−
+
()
=−
()
−−
+
∞
∞
∞
∞
∞
π
β
πβ
π
β
,
,
II
rkRT
T
2
2
4
()
∞
πβ
I
BbA A BbA A
BBBBBB
gg
1
22 1 1 1 12 2 2 2
22 11 11 22 12 21
1
1
=
−
()
−
()
+−
()
−−+ −
I
BbA A BbA A
BBBBBB
gg
2
11 2 2 2 21 1 1 1
22 11 11 22 12 21
1
1
=
−
()
−
()
+−
()
−−+ −
b
rM D p
RT
B
ALL M
rkRT
b
i
iMi i
is f
ij
ii j i
T
i
=
−
=
∞
∞∞
4
4
2
πβ
πβ
,
,
L829/frame/ch02 Page 44 Monday, January 31, 2000 2:03 PM
© 2000 by CRC Press LLC
Physical Chemistry of Aerosol Formation 45
REFERENCES
1. Laaksonen, A., Talanquer, V., and Oxtoby, D.W., Annu. Rev. Phys. Chem., 46, 489, 1995.
2. Volmer, M. and Weber, A., Z. Phys. Chem., 119, 277, 1926.
3. Farkas, L., Z. Phys. Chem., 125, 236, 1927.
4. Volmer, M., Z. Elektrochem., 35, 555, 1929.
5. Volmer, M., Kinetik der Phasenbildung, Verlag Von Theodor Steinkopff, Dresden und Leipzig, 1939.
6. Becker, R. and Döring, W., Ann. Phys. (Leipzig), 26, 719, 1935.
7. Zeldovich, J., Soviet Phys. JETP, 12, 525, 1942.
8. Zettlemoyer, A.C., Nucleation, Marcel Dekker, New York, 1969.
9. Courtney, W.G., J. Chem. Phys., 35, 2249, 1961.
10. Blander, M. and Katz, J., J. Stat. Phys., 4, 55, 1972.
11. Reiss, H., Kegel, W.K., and Katz, J.L., Phys. Rev. Lett., 78, 4506, 1997.
12. Wilemski, G., J. Chem. Phys., 103, 1119, 1995.
13. Girshick, S. and Chiu, C P., J. Chem. Phys., 93, 1273, 1990.
14. Girshick S., J. Chem. Phys., 94, 826, 1991.
15. Viisanen, Y. and Strey, R., J. Chem. Phys., 101, 7835, 1994.
16. Oxtoby, D.W. and Kaschiev, D., J. Chem. Phys., 100, 7665, 1994.
17. Kashchiev, D., J. Chem. Phys., 76, 5098, 1982.
18. Viisanen, Y., Strey, R., and Reiss, H., J. Chem. Phys., 99, 4680, 1993.
19. Strey, R. and Viisanen, Y., J. Chem. Phys., 99, 4693, 1993.
20. Viisanen, Y., Strey, R., Laaksonen, A., and Kulmala, M., J. Chem. Phys., 100, 6062, 1994.
21. Viisanen, Y., Wagner, P.E., and Strey, R., J. Chem. Phys., 108, 4257, 1998.
22. Strey, R., Wagner, P.E., and Viisanen, Y., J. Phys. Chem., 98, 7748, 1994.
23. Strey, R., Viisanen, Y., and Wagner, P.E., J. Chem. Phys., 103, 4333, 1995.
24. Hruby, J., Viisanen, Y., and Strey, R., J. Chem. Phys., 104, 5181, 1996.
25. McGraw, R. and Laaksonen, A., Phys. Rev. Lett., 76, 2754, 1996.
26. Zeng, X.C. and Oxtoby, D.W., J. Chem. Phys., 94, 4472, 1990.
27. Talanquer, V., J. Chem. Phys., 106, 9957, 1997.
28. Debenedetti, P.G., Metastable Liquids, Princeton University Press, 1996.
29. Flood, H., Z. Phys. Chemie A, 170, 280, 1934.
30. Neumann, K. and Köring, W., Z. Phys. Chem. A., 186, 203, 1940.
31. Reiss, H., J. Chem. Phys., 18, 840, 1950.
32. Doyle, G.J., J. Chem. Phys., 35, 795, 1961.
33. Renninger, R.G., Hiller, F.C., and Bone, J., J. Chem. Phys., 75, 1584, 1981.
34. Wilemski, G., J. Chem. Phys., 80, 1370, 1984.
35. Mirabel, P. and Reiss, H., Langmuir, 3, 228, 1987.
36. Nishioka, K. and Kusaka, I., J. Chem. Phys., 96, 5370, 1992.
37. Wilemski, G., J. Phys. Chem., 91, 2492, 1987.
38. Laaksonen, A., Kulmala, M., and Wagner, P.E., J. Chem. Phys., 99, 6832, 1993.
39. Flagelleot-Daniel, C., Cao Dinh, and Mirabel, Ph., J. Chem. Phys., 72, 544, 1980.
40. Laaksonen, A. and Kulmala, M., J. Chem. Phys., 95, 6745, 1991.
41. Laaksonen, A., J. Chem. Phys., 97, 1983, 1992.
42. Jaecker-Voirol, A., Mirabel, P., and Reiss, H., J. Chem. Phys., 87, 4849, 1987.
43. Kulmala, M., Lazaridis, M., Laaksonen, A., and Vesala, T., J. Chem. Phys., 94, 7411, 1991.
44. Stauffer, D., J. Aerosol Sci., 7, 319, 1976.
45. Kulmala, M. and Viisanen, Y., J. Aerosol Sci., 22, S51, 1991.
46. Kulmala, M. and Laaksonen, A., J. Chem. Phys., 93, 696, 1990.
47. Vehkamäki, H., Paatero, P., Kulmala, M., and Laaksonen, A., J. Chem. Phys., 101, 9997, 1994.
48. Zapadinsky, E.I., Report Series in Aerosol Science, 27, 1994.
49. Fletcher, N., J. Chem. Phys., 29, 572, 1958.
50. Hamill, P., Kiang, C.S., and Cadle, R., J. Atmos. Sci., 34, 151, 1977.
51. Hamill, P., Turco, R.P., Kiang, C.S., Toon, O.B., and Whitten, R.C., J. Aerosol Sci., 13, 561, 1982.
52. Lazaridis, M., Kulmala, M., and Laaksonen, A., J. Aerosol Sci., 22, 823, 1991.
53. Adamson, A., Physical Chemistry of Surfaces, John Wiley & Sons, New York, 1982.
L829/frame/ch02 Page 45 Monday, January 31, 2000 2:03 PM
© 2000 by CRC Press LLC
46 Aerosol Chemical Processes in the Environment
54. Lazaridis, M., Kulmala, M., and Gorbunov, B.Z., J. Aerosol Sci., 23, 457, 1992.
55. Gorbunov, B. and Kakutkina, N., J. Aerosol Sci., 13, 21, 1982.
56. Pound, G.M., Simnad, M.T., and Yang, L., J. Chem. Phys., 22, 1215, 1954.
57. Frenkel, J., Kinetic Theory of Liquids, Clarendon Press, Oxford, 1946.
58. Lazaridis, M., J. Colloid Int. Sci., 155, 386, 1993.
59. Mahata, P. and Alofs, D., J. Atmos. Sci., 32, 116, 1975.
60. Scheludko, A., Chakarov, V., and Toshev, B., J. Colloid Interface Sci., 82, 83, 1981.
61. Svenningsson, I.B., Hansson, H C., Wiedensohler, A., Ogren, J.A., Noone, K.J., and Hallberg, A.,
Tellus, 44B, 556, 1992.
62. Pruppacher, H.R. and Klett, J.D., Microphysics of Clouds and Precipitation, D. Reidel, 1978.
63. Kulmala, M., Laaksonen, A., Korhonen, P., Vesala, T., Ahonen, T., and Barrett, J.C., J. Geophys. Res.,
98, 22949, 1993a.
64. Laaksonen, A., Korhonen, P., Kulmala, M., and Charlson, R.J., J. Atmos. Sci., 55, 853, 1998.
65. Shulman, M.L., Jacobson, M.C., Charlson, R.J., Synovec, R.E., and Young, T.E., Geophys. Res. Lett.,
23, 277, 1996.
66. Kulmala, M., Laaksonen, A., Charlson, R.J., and Korhonen, P., Nature, 338, 336, 1997.
67. Kulmala, M., Korhonen, P., Vesala, T., Hansson, H C., Noone, K., and Svenningsson, B., Tellus, 48B,
347, 1996.
68. Vesala, T., Kulmala, M., Rudolf, R., Vrtala, A., and Wagner, P.E., J. Aerosol Sci., 28, 565, 1997.
69. Nikmo, J., Kukkonen, J., Vesala, T., and Kulmala, M., J. Hazardous Mat., 38, 293, 1994.
70. Kulmala, M., Vesala T., and Wagner, P.E., Proc. R. Soc. London, A 441, 589, 1993b.
71. Atkins, P.W., Physical Chemistry, 3rd ed., Oxford University Press, 1986.
72. Prausnitz, J.M., Lichtenthaler, R.N., and de Azevedo, E.G., Molecular Thermodynamics of Fluid-
Phase Equilibria, Prentice-Hall, Englewood Cliffs, NJ, 1986.
73. Reid, R.C., Prausnitz, J.M., and Poling, B.E., The Properties of Gases and Liquids, 4th ed., McGraw-
Hill, New York, 1987.
74. Clegg, S.L. and Brimblecombe, P., J. Phys. Chem., 94, 5369, 1990.
75. Clegg, S.L., Pitzer, K.S., and Brimblecombe, P., J. Phys. Chem., 96, 9470, 1992.
76. Seinfeld, J.H., Atmospheric Chemistry and Physics of Air Pollution, John Wiley & Sons, 1986.
77. Seinfeld, J.H. and Pandis, S.N., Atmospheric Chemistry and Physics. From Air Pollution to Climate
Change, John Wiley & Sons, 1998.
78. Kulmala, M., Majerowicz, A., and Wagner, P.E., J. Aerosol Sci., 20, 1023, 1989.
79. Vesala, T. and Kulmala, M., Physica A, 192, 107, 1993.
80. Kulmala, M. and Vesala, T., J. Aerosol Sci., 22, 337, 1991.
81. Rudolf, R., Majerowicz, A., Kulmala, M., Vesala, T., Viisanen, Y., and Wagner, P.E., J. Aerosol Sci.,
22, S51, 1991.
82. Rudolf, R., Ph.D. thesis, University of Vienna, Department of Experimental Physics, 1994.
83. Fuchs, N.A. and Sutugin, A.G., Highly Dispersed Aerosols, Ann Arbor Science, Ann Arbor, MI, 1970.
84. Hirschfelder, J.O., Curtiss, C.F., and Bird, R.B., Molecular Theory of Gases and Liquids, John Wiley
& Sons, New York, 1954.
85. Wagner, P.E., Aerosol Microphysics, W.H. Marlow, Ed., Vol. II, Springer Verlag, Berlin, 1982, 129.
86. Clement, C.F., Kulmala, M., and Vesala, T., J. Aerosol Sci., 27, 869, 1996.
86. Hänel, G., Adv. Geophys., 19, 73, 1976.
87. CRC Handbook of Chemistry and Physics, 74th ed., (Eds. Lide, D.R. and Frederikse, H.P.R.), CRC
Press LLC, Boca Raton, FL, 1993.
88. Del Monte, M. and Rossi, P., Atmos. Environ., 31, 1637, 1997.
89. Brimblecombe, P. and Clegg, S.L., Atmos. Environ., 24A, 1945, 1990.
L829/frame/ch02 Page 46 Monday, January 31, 2000 2:03 PM
© 2000 by CRC Press LLC