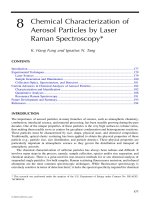
AEROSOL CHEMICAL PROCESSES IN THE ENVIRONMENT - CHAPTER 9 pdf
Bạn đang xem bản rút gọn của tài liệu. Xem và tải ngay bản đầy đủ của tài liệu tại đây (564.59 KB, 15 trang )
197
9
Novel Applications of the
Electrodynamic Levitater
for the Study of Aerosol
Chemical Processes
Glenn O. Rubel
CONTENTS
Introduction 197
SPEL Design and Operation 198
Particle Detection and Measurement 199
Particle Generation 200
Environmental Control 201
SPEL Application Studies 201
Multicomponent Oil Droplet Studies 201
Hygroscopic Growth 202
Droplet Kinetics with Monolayers 204
Heterogeneous Reactions 205
Droplet Microencapsulation 206
Gas Adsorption onto Solid Particles 209
Conclusions 211
References 211
INTRODUCTION
By virtue of their name, aerosols are involved in a wide variety of chemical and physical processes
that are operative at the gas/liquid–solid interface. A complete list of these processes would probably
fill this page and it is not the intent of this chapter to be a comprehensive review of aerosol physics
and chemistry. Indeed, this chapter focuses on the implementation of a specific experimental method
— single-particle electrodynamic levitation (SPEL) — to study a narrow class of aerosol rate
processes, including water condensation-evaporation, heterogeneous reactions, monolayer resis-
tance to evaporation and reaction, droplet microencapsulation, and gas adsorption onto solid par-
ticulates. For a more complete discussion of the development and application of SPEL, see the
review by Davis.
1
The selection of scientific problems discussed in this chapter was governed by
three primary factors: areas where data gaps exist; areas of scientific controversy; and areas where
single-particle analysis could substitute for bulk analysis methods. As an example of the use of
SPEL to fill an existing data gap, we cite the study on the evaporation of multicomponent oil
solutions.
2,3
Questions on the ideality and the validity of correlative relationships between molecular
weight and hydrocarbon vapor pressure were addressed using single-particle levitation.
L829/frame/ch09 Page 197 Monday, January 31, 2000 3:09 PM
© 2000 by CRC Press LLC
198
Aerosol Chemical Processes in the Environment
Perhaps more intriguing are the opportunities to resolve scientific controversies that arise from
studies employing bulk and/or aerosol measurement methods. One such controversy concerned the
heterogeneous reaction between acid aerosols and base gases. Robbins and Cadle
4
and Huntzicker
et al.
5
both measured the reaction rate between sulfuric acid aerosol and ammonia gas. However,
because the researchers were employing discrete time analysis methodologies, they were unable
to detect the transition from a surface-phase reaction to a gas-phase diffusion-controlled reaction.
In contrast, SPEL levitates single droplets, which permits a continuous measurement of the droplet-
gas reaction. As a result, the transition from surface-phase to gas-phase diffusion-controlled reaction
could be detected using SPEL.
In addition to the advantages of continuous measurement, another powerful feature of SPEL
is its capability to measure rate processes for single micrometer-sized particles. Because measure-
ment time increases with increasing particle size for surface area-dependent processes, the SPEL
measurement time is significantly smaller than most bulk method measurement times. This trans-
lates into a cost-saving feature that makes SPEL an attractive concept for future development as a
standard test measurement method. This is exemplified by the case where water vapor isotherms
for carbon were measured using SPEL in one-tenth the time required by standard bulk measurement
methods.
6
This chapter begins with a brief discussion on the operation of single-particle electro-
dynamic levitation (SPEL).
SPEL DESIGN AND OPERATION
Millikan
7
was the first to use electrical levitation to study the properties of single particles. Using
two parallel plates with opposite applied potentials to establish an electric field, he suspended
individual, charged oil droplets by counterbalancing the droplet's weight against the static electric
field. By measuring the droplet fall rate with and without the electric field, Millikan was able to
determine the elementary charge of an electron for which he was subsequently awarded a Nobel
Prize in physics. While the Millikan cell was used successfully by many researchers, the cell was
disadvantaged by the fact that the droplet was stabilized in one direction only. Because horizontal
stabilization did not exist, the droplet tended to drift laterally, causing significant measurement
problems.
To circumvent this deficiency in the Millikan cell, Straubel
8,9
and Wuerker et al.
10
demonstrated
that an electrically charged droplet can be localized in three dimensions by applying an oscillating
potential across an electrode configuration with a specific geometry. The electrode configuration
must be such that the electric field intensity increases linearly with distance from the field origin.
Because of particle drag, the particle oscillation will lag the electric field oscillation and the droplet
will experience a net time-averaged central force that drives the particle to the field origin. This is
the principle for particle stablization in SPEL.
Figure 9.1 shows a schematic of the SPEL apparatus. The chamber shown is referred to as the
bihyperboloidal balance because the cross-section of the electrode is described by two hyperbolae.
Other electrode geometries exist
1
that produce fields that result in particle levitation, but we consider
only the bihyperboloidal chamber in this chapter. The electrode surfaces are described by
(9.1)
where
z
and
r
are axial and radial coordinates, respectively, and
C
±
are constants, a positive constant
for the two-sheet hyperboloid forming the top and bottom of the chamber, and a negative constant
for the one-sheet hyperboloid forming the sides of the chamber. These electrodes produce an electric
field strength that is zero at the origin and has the described linearity. The top and bottom
hyperboloidal sheets were separated from the central, single-sheet hyperboloid by two horizontal
Teflon rings. The alternating voltage was applied to the one-sheet bihyperboloidal electrode. The
2
22
zrC−=
±
,
L829/frame/ch09 Page 198 Monday, January 31, 2000 3:09 PM
© 2000 by CRC Press LLC
Novel Applications of the Electrodynamic Levitater for the Study of Aerosol Chemical Processes
199
direct current voltage was applied symmetrically across the top and bottom electrodes using halving
resistors, which were connected to the common ground of the alternating voltage. The symmetry
of the dc field resulted in an analytic solution for the particle motion in the electrodynamic field.
The dc voltage was varied between 0 and 200 volts, and the ac voltage was varied between 0 and
1000 volts.
The stability of particle motion was shown to depend on two parameters: a particle drag
coefficient
K
D
and an electric field intensity coefficient
E.
Analyzing the stability of the solution
for the equation of motion of a charged particle in the bihyperboloidal field, Frickel et al.
11
showed
that the particle motion could be described by stability zones mapped out in
K
D
-E
space. Figure
9.2 shows such a stability map where the particle drag is defined as
K
D
= 18
η
/
ρω
d
2
, where
η
is air
viscosity,
ρ
is the air density,
ω
is the field frequency, and d is the particle diameter; the electric
field strength parameter
E
is defined as
E
=
CqV
/
ω
2
m
, where
C
is a geometric constant,
q
is the
particle charge,
V
is the oscillating field potential, and
m
is the particle mass. Thus, at constant
field frequency and air properties, the complete stability map can be traversed by independently
varying the particle charge-to-mass ratio and the field potential. An interesting feature of Figure 9.2
is the condition that for a given drag coefficient, one can pass from a stable zone to an unstable
zone and back to a stable zone by increasing the field potential. In principle, particle "sorting" can
be accomplished by setting the field potential so that only a specific particle charge-to-mass ratio
leads to a stable configuration.
P
ARTICLE
D
ETECTION
AND
M
EASUREMENT
Two principal particle measurement methods are used with SPEL: optical and gravimetric. A 1-
mW He-Ne laser is used to illuminate the particle and scattered radiation is detected at 90° and
35° from the forward direction. Radiation at 35° is detected with a split photodiode that is used to
monitor the vertical position of the particle. If the particle is not centered in the chamber, the diode
generates an error signal that is converted to a correction voltage by the use of a proportional-
integral-derivative controller. The proportional derivative section gives a quick response for the
particle position adjustment and it also damps particle oscillation, whereas the integral section
offsets changes in mass, charge, or external forces. This electro-optical feedback system allows for
automatic monitoring of the particle weight-balancing potential and is best-suited for spherical
FIGURE 9.1
Schematic of SPEL apparatus with electric field lines shown.
L829/frame/ch09 Page 199 Monday, January 31, 2000 3:09 PM
© 2000 by CRC Press LLC
200
Aerosol Chemical Processes in the Environment
particles such as liquid droplets. Radiation at 90° is detected with a photomultiplier (Products for
Research) and is recorded on a y-t recorder. At 90°, light scattering resonances are detectable and
particle size changes can be inferred from resonance spacing. The particle is also back-illuminated
with a white light source, which permits manual control of the position of the particle in the chamber.
The static field potential is adjusted until the particle oscillation ceases. At this point, the particle
is at rest at the center of the chamber. When the particle is centered, the particle weight is exactly
balanced by the static electric field and the following condition applies:
(9.2)
When this condition is valid, relative particle masses are determined from the relative static voltages.
It is this relation that is used extensively in the aerosol studies discussed in this chapter. The particle
was observed through a telemicroscope equipped with a 35-mm objective by back-illuminating the
droplet with white light. The telemicroscope was attached to a Sony camera, which permitted
viewing of the particle on a 13-in monitor for ease of positioning. The telemicroscope was also
equipped with a scanning graticule that permitted
in situ
particle size measurement within ±1
micrometer.
P
ARTICLE
G
ENERATION
Charged particles were generated using two methods of dissemination: electrospray and contact
charging. Electrospray was used to disseminate liquid droplets and colloidal particles that formed
solid particles by flash distillation. Conductive solid particles were generated using a dry process
referred to as contact charging. Contact charging involved bringing a potential field in the vicinity
of the conductive powder that was placed in contact with ground. The conductive powder attained
a net charge opposite to the field polarity. Aspiration of the powder resulted in a dry charged solid
FIGURE 9.2
Stability phase space for a charged particle in SPEL.
mg qC V
DC DC
= .
L829/frame/ch09 Page 200 Monday, January 31, 2000 3:09 PM
© 2000 by CRC Press LLC
Novel Applications of the Electrodynamic Levitater for the Study of Aerosol Chemical Processes
201
aerosol. Contact charging proved important when it was necessary to generate an uncontaminated
particle for vapor sorption studies, such as for single-particle isotherm studies.
For the electrospray dissemination method, the liquid was placed in a capillary tube connected
to a dc high-voltage power supply. By raising the voltage to a value between 4000 and 7000 volts,
a spray of charged droplets was generated. The spray was directed toward the levitation cell for
particle trapping.
E
NVIRONMENTAL
C
ONTROL
The composition of the gas entering the levitation cell is controlled by a series of compressed gas
sources regulated by flowmeter controls. The water humidity is established by passing compressed
air through water bubblers and dessicants and by controlling the relative flow rate through the two
chambers. Dew points are measured with an EG&G hygrometer. Other condensible/reactive gases
are introduced by a bleed-in line. Vapor concentrations are measured with a Varian 3000 FID gas
chromatograph.
SPEL APPLICATION STUDIES
M
ULTICOMPONENT
O
IL
D
ROPLET
S
TUDIES
The study of the evaporation of multicomponent oils is important for several reasons: predicting
lubricant oil lifetimes, modeling the obscuration performance of oil smokes, and understanding the
combustion of oil droplets, to name a few. Davis and Ray
12
showed that the evaporation of single
droplets could be measured using electrical levitation. Studying the evaporation of single-compo-
nent droplets, they were able to determine the gas-phase diffusion coefficients of the condensible
species from the droplet evaporation rate.
The isothermal, diffusion-controlled evaporation of a multicomponent liquid droplet can be
represented by the flux rate
(9.3)
where
n
(
m,t
) is the molecular number of mass
m, d
is the droplet diameter,
D
(
m
) is the diffusion
coefficient of mass
m, K
is Boltzmann constant, and
P
(
χ
(
m,t
),
d
) is the droplet vapor pressure of
component
m
characterized by mole fraction
χ
. It is assumed that the gas-phase partial pressure
of component
m
is zero. The droplet vapor pressure of component
m
is alternately described by
the relation
(9.4)
where
γ
(
m
) is the activity coefficient of species
m,
and
P
°(
m
) is the saturation vapor pressure of
species
m.
Subsituting Equation 9.4 into Equation 9.3 and taking the first mass moment, the flux
rate becomes
(9.5)
It was shown
2
earlier that for realistic mass ranges, the product
mD
(
m
) is a slowly varying function
and can be approximated by a constant value. In addition, if we further consider cases where the
˙
(,)
() (,),
,nmt
dD m P m t d
KT
=
−
()
2πχ
Pmt m mtP m(,) ()(,) (),=°γχ
d
dt
mn m t dm d mD m m m t P m dm
m
m
m
m
1
2
1
2
2
∫∫
=− °(,) ()()(,) () .πγχ
L829/frame/ch09 Page 201 Monday, January 31, 2000 3:09 PM
© 2000 by CRC Press LLC
202
Aerosol Chemical Processes in the Environment
droplet diameter does not change appreciably, then the r.h.s of Equation 9.5 is proportional to the
total droplet vapor pressure and can be written as
(9.6)
where
mD
(
m
) is a predetermined constant.
Figures 9.3A and B show the evaporation data and droplet vapor pressure, respectively, for the
following multicomponent hydrocarbons: distilled 100 pale oil at 40°C (
᭝
), undistilled 100 pale
oil at 40°C (
᭺
), No.2 diesel fuel at 25°C (
᭞
), and No.2 diesel fuel at 40°C (
ᮀ
). The droplet mass
is measured from the levitation voltage and the optically determined droplet size. The droplet
density is assumed constant during evaporation. The slope of the evaporation curve is determined
graphically using a chord-area method. Substitution of the mass decay rate and the instantaneous
droplet diameter into Equation 9.6 gives the total droplet vapor pressure as a function of percent
mass evaporated
M
E
. Figure 9.3B shows the dependence of natural log of the total pressure on the
percent mass evaporated and reveals that these hydrocarbons can be characterized by the same
functional relationship. Subsequently, Rubel
3
measured the evaporation rate of binary oil droplets
composed of dioctyl and dibutyl phthalate. Assuming ideal solution theory in the evaporation model,
comparison of experiment and theory was excellent.
H
YGROSCOPIC
G
ROWTH
S
TUDIES
The equilibrium growth of hygroscopic particles has generated considerable interest in the atmo-
spheric sciences community due to the effect of humidity on air visibility. Previous attempts to
measure the uptake of water vapor by hygroscopic particles have focused on multi-particle analysis
such as electrical mobility analysis. Orr et al.
13
measured the water gain/loss of hygroscopic salt
particles using humidity-dependent electrical mobility measurements. The growth of particles of
NaCl, (NH
4
)H
2
SO
4
, CaCl
2
, AgI, PbI
2
, and KCl was measured and the deliquescence humidity was
determined for each of the salts. Analogous single-particle measurements were conducted by
Twomey,
14
who measured the thermodynamic growth of atmospheric salt particles by suspending
the particles on spider webs. While this method was successful for most of the salts studied, sodium
carbonate measurements deviated from predicted values. The influence of the spider web on particle
growth is uncertain and for this reason a nonintrusive method like electrical levitation would be
advantageous.
To study the thermodynamic growth of hygroscopic particles, the electrodynamic balance is
equipped with a humidity-controlled gas flow that is monitored continuously with a dew point
hygrometer. The humidity is precisely controlled by mixing two flow sources: a water-dessicated
flow and a water-saturated flow. By controlling the relative flow rates of the two flows, it was
possible to vary the ambient dew point from –30°C to 22°C. As with the oil studies, relative mass
changes are determined from relative voltage changes. Droplet diameters are measured using a
scanning graticule in combination with a telemicroscope.
Figure 9.4 shows a comparison between the volume increase of a phosphoric acid solution
droplet with increasing relative humidity as measured with SPEL and as predicted from a regression
equation developed from the water activity data of Mellor.
15
Deviations are generally less than 5%.
Demonstration of the water activity measurement capabilities of the SPEL was crucial in conducting
kinetic studies where data analysis required knowledge of the thermodynamic "tracking" charac-
teristics of hygroscopic particles. Thus, as the relative humidity of the levitater is changed, the
chemical composition of the solution droplet can be accurately predicted.
The capability to measure the hygroscopic growth of particles was applied to several develop-
mental problems in the U.S. Army, including the use of phosphorus smoke as a visible and infrared
P
KT
dmD m
Mt
T
=
−
2π ()
˙
(),
L829/frame/ch09 Page 202 Monday, January 31, 2000 3:09 PM
© 2000 by CRC Press LLC
Novel Applications of the Electrodynamic Levitater for the Study of Aerosol Chemical Processes
203
obscuring smoke. While infrared transmission measurements revealed that the infrared spectra of
phosphorus smoke is different from that of an orthophosphoric acid aerosol, the SPEL showed that
the hygroscopic characteristics of the two aerosols were equivalent.
16
This finding significantly
simplified smoke modeling efforts by permitting the use of orthosphosphoric acid/water activity
data to predict phosphorus smoke hygroscopic growth.
A
B
FIGURE 9.3 A: Evaporation rate and B: vapor pressure as a function of mass evaporated of different
multicomponent hydrocarbons.
L829/frame/ch09 Page 203 Monday, January 31, 2000 3:09 PM
© 2000 by CRC Press LLC
204 Aerosol Chemical Processes in the Environment
DROPLET KINETICS WITH MONOLAYERS
The evaporation of water through insoluble monolayers has been studied extensively.
17-19
It was
shown that evaporation resistance increased with surface pressure π, or inversely the area per
molecule σ, and with the monolayer chain length. Using water troughs with controllable surface
areas, these researchers performed a detailed analysis of the π-σ isotherms and discovered charac-
teristic "kinks" in the isotherms. They attributed the "kinks" to impurities that were introduced
through the administration of monolayer-solvent solutions necessary for the uniform spreading of
the monolayer over the water surface. It was our intent to: (1) determine if the "kinks" are present
in the single droplet evaporation data, and (2) determine the value of the water accommodation
coefficient for various monolayer surface coverages.
Surfactant vapor is introduced to the levitater using a carrier flow that is passed over a heated
quantity of hexadecanol. A phosphoric acid droplet is stabilized in the levitater and hexadecanol
is adsorbed onto the droplet surface. Humidification and dehumidification of the levitater causes
the droplet to alternately evaporate and condense with a concomitant compression and expansion
of the monolayer. Employing mass transfer theory for the water and hexadecanol, the monolayer
surface coverage is predicted, as well as the water accommodation coefficient, the fraction of water
molecules that intercept the droplet surface that are retained.
20
Figures 9.5A and B show the mass of an evaporating and condensing phosphoric acid solution
droplet, respectively, in the presence of hexadecanol vapor. In the case of evaporation (Figure 9.5A),
the droplet is initially covered with a partial monolayer of hexadecanol, and evaporation is initially
rapid with water accommodation coefficients on the order of 10
–3
. After approximately 6 s, the
droplet evaporation slows dramatically and the water accommodation coefficient decreases by
almost an order of magnitude to 10
–4
. The dramatic decrease in the droplet evaporation rate is
associated with the formation of a critical coverage of hexadecanol monolayer, which represents
the transition between the liquid condensed and solid monolayer.
The growth cycle (Figure 9.5B) reveals a similar "kink" in the condensation kinetics with now
a dramatic increase in the accommodation coefficient as the hexadecanol monolayer transitions
between the solid and liquid condensed monolayer. The reversibilty of the "kink" kinetics contradicts
the argument of Archer and La Mer,
18
who hypothesized from surface pressure-area measurements
that the sharp change in the evaporation rate was due to surface impurities being "squeezed out"
of the monolayer during monolayer compression. However, the "kink" in the growth kinetics could
not be explained by such a impurity hypothesis.
FIGURE 9.4 Comparison of volume increase of H
3
PO
4
droplet measured by SPEL (᭝) and predicted by
Mellor.
15
L829/frame/ch09 Page 204 Monday, January 31, 2000 3:09 PM
© 2000 by CRC Press LLC
Novel Applications of the Electrodynamic Levitater for the Study of Aerosol Chemical Processes 205
HETEROGENEOUS REACTIONS
One of the earlier investigations of the heterogeneous reaction between droplets and reactive gases
was conducted by Robbins and Cadle,
4
who measured the reaction between sulfuric acid droplets
and ammonia gas. They observed that surface-phase reaction models with constant reaction coef-
ficients did not correctly predict the reaction rate, and that the experimental rate was significantly
smaller than the "best-fit" reaction model. Furthermore, the droplet reaction rate was unchanged
when the nitrogen carrier gas was mixed with helium gas, leaving the researchers to conclude that
gas-phase diffusion-controlled processes were not rate-limiting. To shed light on the mechanisms
that control the heterogeneous reaction between the acid droplet and a reactive gas, single-particle
levitation was used to continuously monitor the droplet reaction dynamics. Continuous monitoring
of an isolated droplet permits the identification of discontinuous changes in the reaction rate, which
are difficult to identify with discrete time analyses such as that of Robbins and Cadle.
In this study, single phosphoric acid droplets, varying in diameter from 42 to 72 µm, were
levitated in the cell at varying ammonia gas partial pressures (from 115 to 1000 dyne cm
–2
). Because
A
B
FIGURE 9.5 A: Evaporation and B: growth of a monolayer-coated H
3
PO
4
droplet.
L829/frame/ch09 Page 205 Monday, January 31, 2000 3:09 PM
© 2000 by CRC Press LLC
206 Aerosol Chemical Processes in the Environment
the droplet weight is balanced by the force of the electric field, the ratio of the levitating voltages
is equal to the ratio of droplet masses. Weight changes are solely due to the addition of ammonia
molecules by heterogeneous reaction because the acid is nonvolatile. The extent of reaction ξ, the
ratio of accreted ammonia molecules to the initial number of acid molecules, can be expressed in
terms of the levitation voltages as
(9.7)
where V(t) is the levitation voltage at time t, M
P, A
are the molecular weights of phosphoric acid and
ammonia, respectively, and f is the initial acid weight fraction of the droplet.
Figure 9.6 depicts the reaction dynamics for different-sized phosphoric acid droplets at constant
ammonia gas partial pressure. For all cases, for the first second of reaction, a rapid increase in the
extent of reaction occurs. The maximum extent of reaction achieved during the initial growth phase
is relatively insensitive to particle size. Subsequently, a slower growth rate dominates, the rate of
which increases as the particle size decreases. During this latter growth phase, the maximum extent
of reaction increases with increasing particle size. Remarkably, for the 42-µm diameter droplet,
the second growth phase is completely inhibited. Telemicroscopic examinations indicated that the
droplet was encapsulated by a thin transparent shell of a glass ammonium phosphate.
21
At a later
time, a sharp transition in the reaction dynamics occurred. Microscopic examination showed that
particle crystallization occurred at this transition rate, and it was concluded that gas-phase diffusion
was no longer rate-limiting but that internal particle diffusion became rate-limiting. These conclu-
sions were confirmed by model analysis by Rubel and Gentry,
21
who showed that the heterogeneous
reaction history of the droplet could be modeled as a sequential reaction set given by surface phase,
gas-phase diffusion-controlled, and finally internal particle diffusion. The onset of internal particle
diffusion-controlled reactions was initiated by the surface crystallization of ammonium phosphate.
Rubel and Gentry
22
developed a model for the time-dependent surface concentration of ammonium
phosphate resulting from the heterogeneous reaction of ammonia gas with phosphoric acid. It was
shown that for all acid droplets, independent of particle size, the surface phosphate concentration
was the same value at the time of particle crystallization.
As a corollary to studies involving the effects of monolayers on water condensation and
evaporation from aqueous droplets, a study was conducted to examine the effect of the same
monolayers on ammonia gas accommodation at the droplet surface.
16
In this study, phosphoric acid
droplets initially covered with a hexadecanol monolayer were immersed in ammonia gas. Vis-a-
vis the reaction dynamics studies discussed earlier, extents of reaction were determined as a function
of time for various states of the monolayer. The results of the study showed that for both the solid
and liquid monolayer, the ammonia accommodation coefficient was an order of magnitude smaller
than the water accommmodation coeffcient.
Interestingly, during droplet reaction, the ammonia and water accommodation coefficients
decreased with increasing extent of reaction. One possible explanantion is that the monolayer
contracts, that is, the area per molecule decreases during droplet reaction. Monolayer contraction
results in greater monolayer cohesion and thus a greater free energy barrier for monolayer perme-
ation. Monolayer contraction with decreasing substrate acidity has also been demonstrated by
Langmuir.
23
DROPLET MICROENCAPSULATION
One of the earlier attempts to encapsulate aerosols inside impermeable films involved reacting
droplets of phosphoric acid with 1,3-butadiene gas to form polymer films at the droplet surface.
4
Rubel
22
showed that it was possible to encapsulate phosphoric acid droplets in ammonium phosphate
ξ=
−
()
+−
MVtV
Mf M f
p
Ap
() ( )
()
,
01
1
L829/frame/ch09 Page 206 Monday, January 31, 2000 3:09 PM
© 2000 by CRC Press LLC
Novel Applications of the Electrodynamic Levitater for the Study of Aerosol Chemical Processes 207
by immersing the droplet in ammonia gas. It was shown that the shell porosity is a function of the
ammonia gas pressure, decreasing as the ammonia pressure is increased. A different problem is
posed by the encapsulation of volatile compounds such as low molecular weight hydrocarbons.
For these hydrocarbons, the film formation process will depend on the evaporation rate of the
volatiles. Durand-Keklikian and Partch
24
investigated the microencapsulation of dodecane and diesel
fuel droplets by doping the droplets with metal alkoxides and then reacting the droplets with water
vapor. They investigated the effects of alkoxide concentration, hydrocarbon type, temperature, liquid
aerosol flow rate, and length of reaction tube on the morphology of the film. No attempt was made
to determine the reaction dynamics.
To develop a more complete understanding of the microencapsulation dynamics, single-particle
levitation was used to investigate the microencapsulation of titanium ethoxide-doped dodecane
droplets. The relationship between time of film formation, droplet size, and reactant concentrations
was investigated. By monitoring the droplet evaporation rate, it was possible to infer the qualitative
porosity of the film. The inferred porosities are compared to scanning electron micrographs.
Figure 9.7a shows the time-dependent levitation voltage for a 77-µm evaporating dodecane
droplet doped with titanium ethoxide at a concentration of 5% by weight. Initially, the droplet is
spherical and free from surface films, and the evaporation rate is essentially that of pure dodecane.
After more than 2 minutes, the film is first observed. The film is detected as an irregularity in the
normally spherical droplet surface. Interestingly, droplet evaporation continues unaffected by the
film formation. Electron photomicrographs show that the droplet surface is encrusted with a
nonuniform film with significant defect structure. It is the porosity of the shell that leads to a
permeable characteristic and fails to inhibit dodecane evaporation.
To investigate the effect of water partial pressure on the film formation process, the dew point
temperature was increased. Figure 9.7b shows a similar evaporation event, except the ambient dew
point is increased to 20°C. Now, the onset of film formation occurs at 1.83 minutes, approximately
3/4 the time required at 11°C dew point. To investigate the effect of particle size on the onset of
film formation, the conditions in Figure 9.7a are duplicated, except the droplet size is reduced to
46 µm. Now, the onset of film formation is at 0.83 minutes. Again, the film has no observable
FIGURE 9.6 Reaction rate of a phosphoric acid droplet immersed in ammonia gas as a function of particle
size.
L829/frame/ch09 Page 207 Monday, January 31, 2000 3:09 PM
© 2000 by CRC Press LLC
208 Aerosol Chemical Processes in the Environment
effect on the evaporation rate. Finally, the reactant concentration was increased to 20% by weight:
all other conditions are set to match those in Figure 9.8a. Now, the film forms rapidly at 0.2 minutes.
No observable effect on the droplet evaporation rate was observed. When the ethoxide concentration
was increased to 50% by weight, encapsulation halted droplet evaporation.
Several observations can be made from the results shown in Figures 9.7 and 9.8. First, because
the time for film formation depends on the initial reactant concentration, it is concluded that the
dynamics are not gas-phase diffusion-controlled. In fact, one can derive an expression relating the
time for film formation to the water partial pressure under the assumption that the reaction is gas-
phase diffusion-controlled. Then, for two distinct water partial pressures, the respective times for
film formation (equivalent product concentrations) are related by
(9.8)
where d
o
is the initial diameter and k is the evaporation rate parameter defined as
(9.9)
FIGURE 9.7 Levitation voltage of an evaporating dodecane droplet doped with titanium ethoxide.
FIGURE 9.8 Levitation voltage of an evaporating dodecane droplet doped with titanium ethoxide.
P
P
kt d
kt d
W
W
()
()
,
/
/
1
2
11
11
20
2
32
10
2
32
=
−+
()
−+
()
−
−
k
vDP
RT
ddd
=−
8
.
L829/frame/ch09 Page 208 Monday, January 31, 2000 3:09 PM
© 2000 by CRC Press LLC
Novel Applications of the Electrodynamic Levitater for the Study of Aerosol Chemical Processes 209
Here, v
d
is the molar volume, D
d
is the gas-phase diffusion coefficient, and P
d
is the saturation
vapor pressure of dodecane. Using typical values for these parameters as given by the CRC
Handbook of Chemistry and Physics,
27
the relative partial pressure calculated from Equation 9.8
corresponding to the times of film formation as shown in Figures 9.7 and 9.8 is 0.73. This value
exceeds the experimental value of 0.56, a discrepancy that is beyond the range of experimental
error. While the water partial pressure dependence cannot be explained in terms of gas-phase
diffusion-controlled reaction, there clearly exists a strong dependence on the water partial pressure.
One possibility is that the overall reaction is controlled by a liquid-phase reaction that depends on
the droplet reactant concentration. The concentration of water in the dodecane and titaniun ethoxide
mixture could depend on the water partial pressure.
GAS ADSORPTION ONTO SOLID PARTICLES
Microporous carbons are used extensively by industry and the military in filter systems for air
purification. Because water vapor can affect the adsorption of hazardous vapors onto the carbon
adsorbents, considerable research has been conducted on the water isotherms of porous carbons.
25
A common experimental procedure for isotherm analysis is the gravimetric method where water
vapor adsorption is determined from the weight change of the adsorbent beds. The range of
techniques varies from the large macroscopic studies where adsorption tubes containing grams of
carbon adsorbent are used, to the smaller microscopic studies involving electrobalances where
milligram quantities are required. The measurement time increases dramatically with the quantity
of carbon used in the study, varying from days for the tube studies to hours for the electrobalance.
It is object of this study to describe a new method for isotherm determination that reduces the
measurement time and accurately reflects the adsorption capacity of the adsorbent bed. Single-
particle levitation is used to measure the water isotherms for the well-characterized material silica
gel and adsorbent carbons.
Particle charging was accomplished in the following manner. For the dielectric silica gel, the
silica granules were first crushed to a fine powder and then mixed with methyl alcohol to a slurry
consistency. The colloidal mixture was drawn into a pipette with an orifice diameter of 1 mm. An
8-KV charge was applied to the mixture through an immersed wire, producing a fine spray of
charged particles. More than one particle was levitated in the trap and a glass rod was used to
eliminate all particles except one. For the activated carbons, induction charging was used to charge
solid microparticles of carbon. Because carbon is electrically conductive, the carbon particles attain
a net charge in the presence of an electric field if the carbon powder is grounded. Both BPL and
ASC carbon were used in this study.
Figure 9.9 compares the water loading of silica gel as reported by Davison Chemical
26
and that
measured by the single-particle approach. The water loading, expressed in terms of grams of water
to grams of adsorbent, is expressed in terms of the levitation voltages as
(9.10)
where V
D
is the levitation voltage of the dry particle. The isotherm generated by SPEL represents
five separate runs averaged together. However, the reproducibility is such that the error bars are
comparable to the size of the data points. Although the SPEL data slightly underestimate the values
reported by Davison Chemical, the functional dependence of the water loading on relative humidity
is accurately reflected in the single-particle data. As an aside, it was found that the silica gel isotherm
was independent of the number of times the powder was crushed. This is perhaps not surprising
because most of the water adsorption is taking place in micropores, which are unaffected by the
crushing process.
Water loading =−1
V
V
D
,
L829/frame/ch09 Page 209 Monday, January 31, 2000 3:09 PM
© 2000 by CRC Press LLC
210 Aerosol Chemical Processes in the Environment
Mahle and Friday
28
measured the water adsorption charcateristics of ASC and BPL carbon
using the tube adsorption methodology. Figure 9.10 shows a comparison of the water adsorption
for ASC carbon as measured with SPEL and with tube adsorption. Other than a small overestimation
of the data, the SPEL isotherm follows closely the data of Mahle and Friday. An interesting
difference in the water vapor desorption branch of the ASC carbon for the SPEL and tube meth-
odologies does exist. The two methods give almost identical results from 100 to 50% relative
humidity; however, below 50%, the SPEL desorption branch exceeds the tube data. Mahle and
Friday
28
argued that the non-closure of the water isotherm loop was due to impregnants in the
FIGURE 9.9 Comparison of silica gel water isotherms as measured by SPEL (0) and reported by Davison
Chemical (×).
FIGURE 9.10 Comparison of carbon water isotherms as measured by SPEL (0) and as reported by Mahle
and Friday (×). (From Reference 28. With permission.)
L829/frame/ch09 Page 210 Monday, January 31, 2000 3:09 PM
© 2000 by CRC Press LLC
Novel Applications of the Electrodynamic Levitater for the Study of Aerosol Chemical Processes 211
carbon, such as copper, silver, and chromium salts, that react with water vapor once adsorbed.
Then, the difference in the water isotherms could be due to different amounts of impregnants in
the carbon.
CONCLUSIONS
This chapter reviewed a narrow class of studies conducted by this author to investigate novel
applications of the single-particle levitater. Specifically, the following aerosol chemical and physical
processes were discussed: water condensation onto aqueous droplets, heterogeneous reactions,
monolayer resistance to evaporation and reactions, droplet microencapsulation and gas adsorption
onto solid particles. The results of this study showed that the single-particle levitater is a valuable
tool for the study of microparticle dynamics.
REFERENCES
1. Davis, E.J., Aerosol Sci. and Tech., 2, 121, 1983.
2. Rubel, G.O., J. Colloid Int. Sci., 81, 188, 1981.
3. Rubel, G.O., J. Colloid Int. Sci., 85, 549, 1982.
4. Robbins, R.C., Thomas, J., and Cadle, R., J. Colloid Int. Sci., 18, 483, 1963.
5. Huntzicker, J.J., Cary, R.A., and Ling, C., Environ. Sci. Tech., 14, 819, 1980.
6. Rubel, G.O., Carbon, 30, 1007, 1992.
7. Millikan, R.A., Phys. Rev., 15, 545, 1920.
8. Straubel, H., Z. Elektrochem., 60, 1033, 1956.
9. Straubel, H., Dechema. Monogr., 32, 153, 1959.
10. Wuerker, R.F., Shelton, H., and Langmuir, I., Appl. Phys., 30, 342, 1959.
11. Frickel, R.H., Shaffer, R.E., and Stamatoff, J.B., Rpt. No. ARCSL-TR-77041, Chemical Systems
Laboratory, APG, MD., 1978.
12. Davis, E.J. and Ray, A.K., Chem. Phys., 67, 414, 1977.
13. Orr, C., Hurd, F.K., and Corbett, W.J., J. Colloid Int. Sci., 13, 472, 1958.
14. Twomey, S., J. Meteor., 335, 1954.
15. Mellor, A.J., Mellor's Comprehensive Treatise on Inorganic and Theoretical Chemistry, Vol. VIII,
Suppl. III, Phosphorus, Wiley Interscience, NY, 1971, 1900.
16. Rubel, G.O. and Gentry, J.W., J. Aerosol Sci., 16, 571, 1985.
17. Langmuir, I. and Schaffer, V.J., J. Franklin Inst., 235, 119, 1943.
18. Archer, B.J. and La Mer, V.K., J. Phys. Chem., 59, 200, 1954.
19. La Mer, V.K., Healy, T.W., and Alymore, L.A.G., J. Colloid Int. Sci., 19, 673, 1964.
20. Rubel, G.O. and Gentry, J.W., J. Phys. Chem., 88, 3142, 1984.
21. Rubel, G.O. and Gentry, J.W., J. Aerosol Sci., 15, 661, 1984.
22. Rubel, G.O. and Gentry, J.W., J. Aerosol Sci., 18, 23, 1987.
23. Langmuir, I., Proc. Roy. Soc., 39, 1848, 1917.
24. Durand-Keklikian, L. and Partch, R.E., J. Aerosol Sci., 19, 511, 1988.
25. Dubinin, M.M. and Serpinski, V.V., Dokl. Akad. Nauk. SSR., 99, 1035, 1954.
26. Davison Chemical, IC-16-782, Ind. Chem. Dept., Baltimore, MD, 1985.
27. Weast, R.C., Ed., CRC Handbook of Chemistry and Physics, 62nd ed., CRC Press LLC, Boca Raton,
FL, 1981.
28. Mahle, J.J and Friday, D.K., CRDEC-TR-018, U.S. Army Chemical Research, Development and
Engineering Center, A.P.G., MD, 1988.
L829/frame/ch09 Page 211 Monday, January 31, 2000 3:09 PM
© 2000 by CRC Press LLC