Heavy Metals in the Environment: Using Wetlands for Their Removal - Chapter 8 ppt
Bạn đang xem bản rút gọn của tài liệu. Xem và tải ngay bản đầy đủ của tài liệu tại đây (265.04 KB, 4 trang )
91
CHAPTER
8
Simulation Model of a Lead-Containing
Swamp Ecosystem
Shanshin Ton and Howard T. Odum
CONTENTS
Calibration 93
Typical Simulation 94
After receiving the acid waters from years of washing lead batteries, the cypress-gum swamps
had been killed, and the swamps were full of dead wood and detritus. Chemical studies (Chapter
6) showed lead present in tiny amounts in the waters, but larger amounts were chemically bound
in the organic sediments. This chapter describes a simulation model of lead and its simplified
representation of the storages and flows within the swamp ecosystems. First we describe our concept
of how the swamp operates in processing lead by discussing parts and processes in a simplified
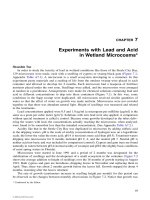
model. The systems diagram of that model (Figure 8.1) helps you visualize how this model is
structured. Causal relationships are listed in Table 8.1. Some of the details are in Appendix 8.
Figure 8.1 shows the main features of the model using standard symbols for representing systems
(Chapter 1). The boundary of the swamp is represented by the rectangular frame with rounded
corners. Lines represent flows of material and energy. Crossing the boundary into the swamp
systems are the flows of sunlight, the wind, and the inflows of water carrying lead. The water inflow
includes stream and the rain. Outflows shown crossing the boundary are the reflected sunlight, the
winds carrying water vapor, the stream outflow carrying organic matter and a little lead, and the
heat energy by-product (in delicate lines passing out the bottom of the frame [the heat sink]).
Shown within the swamp (Figure 8.1) are the plants, the organic sediments, and consumers
(microbes and small animals). The plants produce the organic matter of their own biomass, some
of which goes into the sediments (sometimes called organic detritus). These plants take up some
of the lead from the water, including it in the biomass. The organic detritus (which includes
microorganisms) also takes up lead from the water. Some of that organic matter is consumed by
the combined action of small animals and microorganisms. When that organic matter is consumed
some inorganic minerals that remain, such as lead, may return to the water (see pathway labeled
“recycle”). Two important places where flows intersect and branch are shown, one for the water
L1401-frame-C8 Page 91 Monday, April 10, 2000 9:49 AM
© 2000 by CRC Press LLC
downstream from the Sapp operations filtered and stored much of the lead (Chapter 6). Many trees
92 HEAVY METALS IN THE ENVIRONMENT: USING WETLANDS FOR THEIR REMOVAL
Figure 8.1
Simplified overview diagram of the simulation model of the lead-absorbing wetland ecosystem,
Steele City Bay, Jackson County, Florida. Appendix Figure 8A.1 shows all of the relationships
programmed into the model.
Table 8.1 Description of Relationships in Simulation Equations for the Lead Swamp
Model (Figure 8.1 and Appendix Figure A8.1)
Available light is the inflowing light minus that in use.
Water flowing out is the inflowing water minus evaporation minus plant transpiration.
Lead flowing out is the lead flowing in plus the recycle minus that taken up by plants and by
sediments.
Addition to organic sediments is the sum of the contribution from plants minus that used by
consumers minus that in outflowing stream water.
Gross production of plants is proportional to the available light and the plant biomass, but
diminished by lead in the plants.
Addition to plant biomass is the sum of the gross production minus plant respiration minus
organics that fall into the sediments.
Addition to lead stored in the plants is proportional to the lead in the water and in the plant
biomass and decreased by the lead in the organics that go to sediments.
Addition to lead stored in surface sediments is proportional to flow from plants (proportional to
the biomass of plants and to the lead concentration in the plants) plus uptake from water
(proportional to lead concentration in the water and to the quantity of organic sediments)
minus the lead in the organic matter consumed minus the lead in organic matter in water
flowing out minus that going into buried sediments.
Consumption is proportional to the quantity of organic sediments diminished by toxic action of
lead in the sediments. Recycle of lead to the water is proportional to the consumption.
A small flow of organic sediment and lead goes into buried sediments.
Note:
When something is proportional to each of two properties (A and B), it means that it
is proportional to their product (A * B).
Water
& Lead
Inflow
Wind &
Sun
Plant
Production
Water
Vapor
Evaporation
Trans-
piration
Outflows
Water
Lead
Biomass
& Lead
Con-
sumers
Lead
Recycle
Lead Swamp Model
Lead &
Buried
Sed.
Lead &
Surface
Sed.
L1401-frame-C8 Page 92 Monday, April 10, 2000 9:49 AM
© 2000 by CRC Press LLC
SIMULATION MODEL OF A LEAD-CONTAINING SWAMP ECOSYSTEM 93
and one for the lead in the water. Part of the water that enters the swamp is evaporated and transpired
by the plants and goes out as vapor in the wind. The lead flowing into the swamp receives some
lead from recycle, has the two uptake pathways already mentioned, and what is not taken up flows
out of the swamp with the water. The outflow stream also carries organic matter that contains some
lead. The main storages which are important to lead and its processing are represented with the
“tank” symbol. They are plant biomass, sediments, lead in plants, and lead in sediments.
To make the model generate patterns with time on the computer, equations are written that have
causal relationships. For example, if we believe that the flow of organic matter from the plant
storage (P) to the organic sediment storage (D) is in proportion to the amount of plants, the
mathematical term for the flow is K
7
*P (where P is the plant storage, * means to multiply, and K
7
is a coefficient that is evaluated from the numbers in Figure 8.2). The term says that some fraction
of P flows per unit time along that pathway (Figure 8.1).
Because the details of the equations may be tedious for the general reader, they are placed in
Appendix A8, including a more detailed version of the model’s systems diagram (Figure A8.1) that
has all of the relationships that are in the equations of the computer program. However, here we
provide Table 8.1 to state in words most of the relationships that are contained in the equations.
CALIBRATION
Putting numerical values for storages and flows is calibration, an important step in simulation.
Some values are estimated from the chemical analyses and others are estimated as what is necessary
to make the whole set of flows consistent. For this model the quantities present in these storages
Figure 8.2
Values of storages and flows used for calibration of the lead swamp simulation model diagrammed
in Figure 8.1 and Appendix A8.1.
Lead
in Plants
L
p
10
g/m
2
Sed.
0.1
0.1
Lead in water
Inflow
Outflow
Uptake
Evap.
W
0.5
1.0
2.0
0.5
Water Flows
g/m
2
/day
L
Lead Flows in Water
g/m
2
/day
Inflow
Outflow
1.0
0.1
Recycle
0.1
0.9
Sed.
Plants
0.1
Lead in
Sediments
Outflow
Inflow
Cons.
Plants
0.9 0.01
0.1
0.1
(not steady state)
L
d
g/m
2
Plant
Biomass
Prod.
Sed.
P
10,000
g/m
2
500
100
Resp.
400
10
Organic
Sediments
D
50,000
g/m
2
Outflow
Plants
Cons.
400.
390.
8
(b)
(c)
(d)
(e) (f)
Surface
S
Buried
2
L
s
Buried
Surface
.002
g/m
2
g/m
2
(a)
L1401-frame-C8 Page 93 Monday, April 10, 2000 9:49 AM
© 2000 by CRC Press LLC
94 HEAVY METALS IN THE ENVIRONMENT: USING WETLANDS FOR THEIR REMOVAL
and the flows in and out on the average are labeled for each tank and pathway junction in Figure
8.2. Appendix A8 has the spreadsheet Table A8.2 that was used for calculating the coefficients for
the computer program listed in Table A8.3.
TYPICAL SIMULATION
Figure 8.3 is a typical result of simulating the calibrated model. The graph shows a run of 60
years. The first 5 years are the results before the lead inflow starts. Because the sunlight has a
seasonal variation, the plant biomass goes up and down each year. As might be expected, the
sediments also show an annual pulse, since they are supported by the surge of annual plant growth.
After 5 years, the program starts the inflow of toxic lead in the stream. The plant growth is
impacted and is reduced to a lower level, and the organic sediments are diminished. Quantities of
lead rise in water, then in plants, and finally in sediments. Surface sediments respond to changes
in several years. In this model there is a slow growth of buried sediment and lead which is no
longer exchanging with the surface.
Then, after 20 years, the program reduces the lead inflow (Figure 8.3). The lead in the water drops
to a low concentration, followed more slowly by decreases of lead in plants and surface sediments.
As the lead concentrations decrease, some plants recover and again go into their annual oscillation.
The scenario observed in this simulation is consistent with the events observed over time thus far.
Other “what if” experimental runs were made of the model and its variations by Ton (1990).
Usually the larger sense of understanding from a systems view results if combining known
mechanisms and calibrating a model with measurements from detailed studies generate a reasonable
simulation of the main events. At present, plant growth is returning, including surviving trees and
floating vegetation.
Figure 8.3
on calibration and equations.
60
Years0
11,111
g/m
2
Battery Washing
Starts
Stops
60
Years0
11,111
g/m
2
Battery Washing
Starts
Stops
8888
Surface Sediments
Plant Biomass
Lead in Water
Buried Sediments
Lead in Plants
Lead in Surface
Sediments
Lead in Buried Sediments
175
0.002
83,333
8888
Surface Sediments
Plant Biomass
Lead in Water
Buried Sediments
Lead in Plants
Lead in Surface
Sediments
Lead in Buried Sediments
175
0.002
83,333
L1401-frame-C8 Page 94 Monday, April 10, 2000 9:49 AM
© 2000 by CRC Press LLC
Typical graphs obtained from simulating the lead swamp model. See Appendix A8 for more details