Heavy Metals in the Environment: Using Wetlands for Their Removal - Chapter 9 ppt
Bạn đang xem bản rút gọn của tài liệu. Xem và tải ngay bản đầy đủ của tài liệu tại đây (764.67 KB, 18 trang )
P
ART
III
Lead and Wetlands in Poland
Part III contains studies by the research team at Krakow, Poland on the Biala River marshes
that have received lead and zinc wastewaters for 200 years. Chapter 9 contains the ecological and
chemical studies by Wlodzimierz Wójcik and Malgorzata Wójcik. By quantitatively summarizing
the sources, mining, manufacturing, and environmental dispersal of lead and zinc in Poland, Chapter
10 shows the need and potential for a national policy on wetlands filtration.
L1401-frame-P3 Page 95 Monday, April 10, 2000 9:52 AM
© 2000 by CRC Press LLC
97
CHAPTER
9
Lead and Zinc Retention in the Biala
River Wetland of Poland
Wlodzimierz Wójcik and Malgorzata Wójcik
CONTENTS
Introduction 97
Site Description and History 98
Methods 98
Results 100
Soils and Sediments 100
Plant Communities and Biomass 105
Missing Species 105
Diversity 105
Concentration of Heavy Metals in Plant Tissues 107
Physical and Chemical Analysis of Waters 107
Upstream–Downstream Measurements 107
Field Experiment 109
Proposal to Restore Water Flow over the Wetland 109
INTRODUCTION
The Biala River Wetland in southern Poland has received mine water discharges containing
high concentrations of zinc and lead for about 400 years, providing a rare opportunity to study
long-term filtration of heavy metals by a wetland. Application of the wetlands for treatment of
industrial wastewater and as a sink for pollutants is questioned by some professionals. Among their
concerns is a problem of long-term tolerance of wetland plants to high concentrations of heavy
metals in their tissues as well as in soil. This chapter presents the results of investigations of these
heavy metals in the wetland and the rates of filtration.
L1401-frame-C9 Page 97 Monday, April 10, 2000 9:56 AM
© 2000 by CRC Press LLC
98 HEAVY METALS IN THE ENVIRONMENT: USING WETLANDS FOR THEIR REMOVAL
SITE DESCRIPTION AND HISTORY
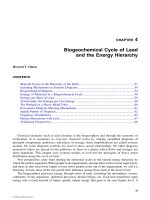
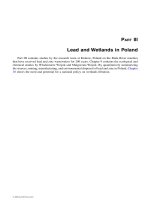
The Biala River is located 60 km west of Krakow City, Poland. The distance between the river
source and its outlet is about 11 km. The wetland study site is located at the confluence of the
Biala River and two discharge channels in the vicinity of Laski village (Figure 9.1). The wetland
extends 3.5 km along the river course with a longitudinal slope of 0.01 to 0.6%. Between 70 and
300 m wide (most often between 100 and 150 m), the wetland–stream complex covers some 70
ha. In the upper part the Biala River meanders throughout its course and within the wetland area
forms curves with radii from 10 to 200 m, branching into two or more arms which return downstream
to the main channel. Starting from its central part there occur local impoundments, and gradually
the water covers the entire valley in its lower part.
The Biala River had its source in an area rich in springs with a catchment basin of 53 km
2
. As
a result of the activity of the Mining and Metallurgical Works “Boleslaw,” the groundwater table
has been lowered to more than 100 m below ground surface. Consequently, a complete disappear-
ance of the natural flow in the Biala River occurred in 1975. Currently, natural runoff is only
possible in the case of large rainfall events or during periods of extensive thaws. Figures 9.2 and
9.3 show the recent flow of the Biala River including the wastewaters from the mines.
The story of human activity in this area is a long one. The Ponikowska Adit discharge channel
was built in the 16th century to remove mine waters from ore deposits and into the Biala River.
Increased flow has been as much as four times greater than the natural flow of the river. Maximum
discharge was reached about 1910. This increased flow was greater than the river bed could hold
and as a result the valley flooded. In the next decades discharge of the water was reduced, with
periodic increases during 1961 to 1966 and 1974 to 1979. Currently flow is about 120 cm/min.
The main discharge carrier to the Biala River is the Dabrawka Channel. Of the discharge 90% is
mine water, 7% is effluent from a municipal wastewater treatment plant, and 3% comes from
industrial wastewater treatment.
To help make proper decisions about changes likely to occur to the wetland and environment
quality in the future, an extensive sampling program was required.
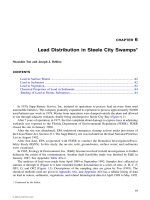
METHODS
Extensive vegetative sampling and physical and chemical analyses of soil and sediments were
undertaken. Soil samples from various depths were collected at 49 locations within the study site
(Figure 9.4a). For tissue analysis of heavy metals in wetland plant species, 85 samples were taken
from 17 sites along the study area (Figure 9.4b).
Vegetation sampling was undertaken to characterize plant communities and identify plant species
for tissue analysis. Cover maps were made and spatial extent was calculated for the most common
plant communities. For evaluation of annual biomass growth (net production), nine randomly selected
1-m
2
plots were cleared of vegetation in early spring and then harvested in late autumn. This method
was used to estimate annual deposition of dead organic matter on the surface of the wetland.
Water quality of mine waters flowing into the wetland was monitored from 1977 to 1990, and
the results were compared with the historical records.
The ability of wetland plants to remove heavy metals from flowing water was evaluated with
upstream–downstream analyses of substances in water as it passed from one end of the wetland to
the other. Concentrations were monitored at ten sampling stations (Figure 9.4c), with the time of
water flow taken into account in order to capture the same wave of water with each sample.
Field experiments were conducted in June 1990 studying the passage of water marked with
dye passing through wetland vegetation with the control arrangements shown in Figure 9.5. Data
were used to evaluate coefficients of the Manning equation. The experimental plot was 96 m long
and 4 to 8.5 m wide with an average depth between 0.069 and 0.294 m.
L1401-frame-C9 Page 98 Monday, April 10, 2000 9:56 AM
© 2000 by CRC Press LLC
LEAD AND ZINC RETENTION IN THE BIALA RIVER WETLAND OF POLAND 99
Figure 9.1
Location of Biala River wetland study site in southern Poland.
Biala Przemsza
0
1
Biala
Przemsa
River
Slawkow
0
11
10
9
8
7
6
5
1
2
4
Biala River
Main Stream
Bledowska Desert
Dabrowka Channel
Ponilkowska Adit
Roznos Channel
Boleslaw
Flotation
Ponds
Laski
Wetland
Kilometer
3
L1401-frame-C9 Page 99 Monday, April 10, 2000 9:56 AM
© 2000 by CRC Press LLC
100 HEAVY METALS IN THE ENVIRONMENT: USING WETLANDS FOR THEIR REMOVAL
RESULTS
Soils and Sediments
The results of the analyses of physical and chemical properties of soil samples collected from
various depths are listed in Appendix Tables A9.9 to A9.11. The shallower layers of soil are
characterized by high density (up to 3.09 g/cm
3
) for samples containing small concentrations of
Figure 9.2
Flow of the Biala River including mine water, 1880 to 1993.
Figure 9.3
Water flows contributing to the Biala River since 1955.
200
150
100
50
0
1880
1910
1950
1960
1970
1980
1990
Year
Flow, cubic meters per minute
Flow, cubic meters per minute
3.0
2.5
2.0
1.5
1.0
0.5
0.0
Year
1955
1990199519801975197019651960
Total
Mine Water
X
XX
X
XX X
X
XX
X
X
X
X
X
X
X
X
X
X
X
X
X
X
X
X
X
X
X
X
X
X
X
X
X
X
X
X
Municipal
Wastewater
Tailing Water
Ponikowska
Adit
L1401-frame-C9 Page 100 Monday, April 10, 2000 9:56 AM
© 2000 by CRC Press LLC
LEAD AND ZINC RETENTION IN THE BIALA RIVER WETLAND OF POLAND 101
organic matter. The size of particles was similar in all soil samples. Sediments are characterized
as silty sand to silt. Dolomite and calcite keep the soil alkaline, generally above 7 for most samples,
with up to 30% calcium. Currently pH of soil deposits ranges between 5 and 7.8.
The concentration of zinc (Zn), lead (Pb), and cadmium (Cd) in sediments was high down to
a depth of 1.5 m. Maximum concentration of zinc was 4.46% and lead was 1.34%. These high
values were most often observed in upstream reaches of the wetland, from the outlet of Dabrowka
Channel to about 1.5 to 2.0 km downstream (Figure 9.6a). There was little deposit of heavy metals
in sediments below the wetland, and in sites close to the valley sides. Figure 9.6b shows data near
the end of the wetland.
Figure 9.4
Location of sampling stations for soil, vegetation, and water analyses in the Biala River wetland.
(a) Soil; (b) vegetation; (c) water.
13
12
16
15
11
17
10
9
8
7
6
5
4
3
2
1
(b)
49
48
47
58
82
80
67
45
46
66
65
81
79
43
78
77
59
64
44
60
83
63
42
41
40
62
75
76
39
38
61
37
36
35
74
52
51
50
34
33
32
73
72
71
69
68
70
54
53
55
31
56
57
30
(a)
(c)
14
1
2
4
5
6
7
8
9
10
3
Main Stream
L1401-frame-C9 Page 101 Monday, April 10, 2000 9:56 AM
© 2000 by CRC Press LLC
102 HEAVY METALS IN THE ENVIRONMENT: USING WETLANDS FOR THEIR REMOVAL
Figure 9.5
Experimental plot used for field experiments (June 6, 1990) showing the locations of cross-section
calculations. W-1, W-2 are water level gauges.
Figure 9.6a
Percent concentrations of lead (Pb) and Zinc (Zn) with depth in soil in the Biala River wetland.
Stations near the wastewater inflow (Stations 32, 33, 34, and 35 in Figure 9.4).
N
E
S
W
Dike
1
2
3
4
5
0
10
20 30 m
6
7
8
9
10
End
W-2
W-1
Beginning
0-25 25-75 75-150
1.2
1.0
0.8
0.6
0.4
0.2
0.0
Lead
(a)
0-10
10-20
20-60
60-100
Depth, centimeters
Depth, centimeters
Depth, centimeters
Station 34
Station 35
Percent
Percent
0-30 30-50 50-80
Station 32
Station 33
1.2
1.0
0.8
0.6
0.4
0.2
0.0
Percent
Depth, centimeters
0-30 30-50 50-80
0.08
0.05
0.00
Percent
0.07
0.06
0.04
0.03
0.02
0.01
1.4
1.2
1.0
0.8
0.6
0.4
0.2
0.0
Zinc
L1401-frame-C9 Page 102 Monday, April 10, 2000 9:56 AM
© 2000 by CRC Press LLC
LEAD AND ZINC RETENTION IN THE BIALA RIVER WETLAND OF POLAND 103
Zinc and lead in wetland soils were compared with soils of the adjacent region (Figure 9.7).
Concentrations of metals in the vicinity of the wetland are about 200 parts per million (ppm)
for zinc and 50 ppm for lead. These concentrations exceed average concentrations of zinc and
lead in unpolluted Polish soils by five and three times, respectively. An estimate of total zinc
accumulated in the wetland measured 3927 tons; the amount of lead was estimated at 1887 tons
(see Appendix A9).
At several sampling stations, the concentrations of metals in sediments were lower at a
depth up to about 10 to 15 cm. This is likely a reflection of the historic overloading of the
wetland system with mine water. Prior to 1980, mine effluent contained large amounts of
suspended solids after ore flotation. This resulted in sediment accumulation and simultaneous
erosion of the river bottom in the main stream of the wetland. The consequence was a successive
disappearance of the wetland progressing downstream from the outlet of Dabrowka Channel.
As the wetland reestablished itself following reductions in mine water discharges, the soil-
forming processes increased as a function of community production. This may explain why the
top soil layer in many stations contains more organic matter and less heavy metals than deeper
and older sediments.
Figure 9.6b
Stations near the outflow end of the wetland (Stations 47, 48, 66, and 67 in Figure 9.4).
1.60
1.40
1.20
1.00
0.80
0.60
0.40
0.20
0
Station 47
Depth, centimeters
0-25 25-50
50-80
0.16
0.14
0.12
0.10
0.08
0.06
0.04
0.02
0
Station 48
Depth, centimeters
0-15 10-60 60-80
Station 66
Depth, centimeters
50-100
100-150
150-200
0.06
0.04
0.02
0
Station 67
Depth, centimeters
0.18
0.16
0.14
0.12
0.10
0.08
0.06
0.04
0.00
0.02
50-100
100-150
150-200
(b)
Zinc Lead
Percent
Percent
Percent
Percent
L1401-frame-C9 Page 103 Monday, April 10, 2000 9:56 AM
© 2000 by CRC Press LLC
104 HEAVY METALS IN THE ENVIRONMENT: USING WETLANDS FOR THEIR REMOVAL
Figure 9.7
Lead content in parts per million in soils of uplands surrounding the Biala Riv
er wetland.
Wetland
200
200
200
200
200
200
L1401-frame-C9 Page 104 Monday, April 10, 2000 9:56 AM
© 2000 by CRC Press LLC
LEAD AND ZINC RETENTION IN THE BIALA RIVER WETLAND OF POLAND 105
Plant Communities and Biomass
Seventeen wetland plant communities were documented. Most plant communities cover small
areas, some of them being remnants of earlier forms of land use. The most common plant com-
munities are listed below, in order of the frequency of occurrence (Figure 9.8):
1. Sedge marsh (
Caricetum gracilis
)
2. Reed marsh (
Scirpo-Phragmitetum
with
Phragmites communis
)
3. Community with Deschampsia (
Deschampsia caespitosa
)
4. Alder swamp (
Carici elongatae Alnetum
)
5. Typical marsh (
Scirpo-Phragmitetum
with
Typha latifolia
)
6. Wet meadow (group of various communities)
7. Sedge marsh with Alder (
Caricetum gracilis
and
Carici elongatae Alnetum
)
8. Horsetail marsh (
Equisetum limosum
)
9. Fresh meadows (order Arrenatheretalia)
Missing Species
The flora of the receiving wetland shows some peculiar features. One of them is the absence
of certain species, which are common on other wetlands. Examples are willow (
Salix
sp.), poplar
(
Populus alba
and
P. nigra
), and some species typical for meadows, such as
Bellis perennis
.
Diversity
There was a dominance of a few species occurring in great abundance (Appendix Tables A9.12a
to A9.12h). Starting with the most common, these include: reed (
Phragmites communis
), deschamp-
sia (
Deschampsia caespitosa
), sedge (
Carex gracilis
), great stooled sedge (
C. paniculata
), water
mint (
Mentha aquatica
), cattail (
Typha latifolia
), sedge (
C. rostrata
), and black alder (
Alnus
glutinosa
). Species richness ranges from 4 to 33, averaging 13.3 for all samples.
Figure 9.8
Area cover of the most common plant communities in the Biala River wetland arranged in rank
order. (1) Sedge marsh (
Caricetum gracilis
); (2) reed marsh (
Scirpo-Phragmitetum
with
Phragmites
communis
); (3) community with deschampsia (
Deschampsia caespitosa
); (4) alder swamp (
Carici
elongatae-Alnetum
); (5) typical marsh (
Scirpo-Phragmitetum
with
Typha latifolia
); (6) wet meadow
(group of various communities); (7) sedge marsh with alder (
Caricetum gracilis
and
Carici elongatae-
Alnetum
); (8) horsetail marsh (
Equisetum limosum
); (9) fresh meadows (order Arrenatheretalia).
Rank Order
1
2
3
4
5
6
7
8
9
16
14
12
10
8
6
4
2
Area, hectares
L1401-frame-C9 Page 105 Monday, April 10, 2000 9:56 AM
© 2000 by CRC Press LLC
106 HEAVY METALS IN THE ENVIRONMENT: USING WETLANDS FOR THEIR REMOVAL
Figure 9.9
Maximum lead (Pb) concentration in plant tissues of species within the Biala River wetland.
Figure 9.10
Maximum zinc (Zn) concentration in plant tissues of species within the Biala River wetland.
0
0.2
0.4
0.6
0.8
1.0
1.2
Concentration, grams per kilogram
dry mass
Sedge
Deschampsia
Bulrush
Mint
Reed
Sparganium
Bog-bean
Cattail
Leaves or stem
Root or rhizome
1
2
3
4
5
6
7
Concentration, grams per kilogram
dry mass
Sedge
Deschampsia
Bulrush
Mint
Reed
Sparganium
Bog-bean
Cattail
Leaves or Stem
Root or Rhizome
0
L1401-frame-C9 Page 106 Monday, April 10, 2000 9:56 AM
© 2000 by CRC Press LLC
LEAD AND ZINC RETENTION IN THE BIALA RIVER WETLAND OF POLAND 107
Average biomass regrowth on the cut plots was 846 g/m
2
dry matter (dm) ranging from a
minimum of 522 g-dm/m
2
to a maximum of 1798 g-dm/m
2
. Dominant plants in each plot are given
in Appendix Table A9.16.
Concentration of Heavy Metals in Plant Tissues
The concentrations of metals found in plants ranged from 25 to 6500 ppm dry matter for zinc,
5 to 1050 ppm for lead, and 0.5 to 48 ppm for cadmium (Figures 9.4 and 9.5 with details of
measurements given in Appendix Table A9.14). Average concentration of zinc in plant leaves ranged
from 29.3 ppm in
Typha latifolia
up to 270 ppm in
Deschampsia caespitosa
. For lead, mean
concentration ranged from 16.3 ppm in
T. latifolia
up to 91.6 ppm in
Mentha aquatica
. Average
cadmium concentrations ranged from 1.3 ppm in
Phragmites communis
and
T. latifolia
up to 3
ppm in
Scirpus lacustris
.
In plant stems, average concentrations of zinc ranged from 106 ppm in
M. aquatica
to 126 ppm
in
P. communis
. Lead in plant stems varied between 20.4 ppm in
P. communis
and 33.8 ppm in
M.
aquatica
. Concentrations of cadmium in plant stems averaged 1.6 to 1.8 ppm in
P. communis
and
M. aquatica
.
Concentrations of metals in plants belowground were 2 to 20 times higher than in leaves and
stems aboveground. Average concentrations of both zinc and cadmium in rhizomes of
P. com-
munis
were 2 to 3 times greater than in leaves and stems and 3 to 7 times greater for lead. In
T.
latifolia
, the mean zinc and lead concentrations in rhizomes were 5 to 8 times greater than in
aboveground tissues; concentrations of cadmium in plants were similar in above- and below-
ground tissues. The largest differences in metal concentration between below- and aboveground
parts were in
Carex
sp., 10 to 20 times greater for lead, zinc, and cadmium. The highest
belowground concentrations, 6500 ppm for zinc and 1050 ppm for lead, were found in sedge
(
Carex
sp.). The highest cadmium concentration, 48 ppm, was found in whole plants of
Pota-
mogeton natans
.
Concentrations of heavy metals in the five most common plant species measured in this study
were significantly higher than values published in the literature (Appendix Tables A9.14 and A9.15
and Figures 9.9 and 9.10). For example, in
Phragmites
sp., concentration of zinc was 2 times higher,
lead measured 8 times higher, and cadmium was as much as 29 times higher. Lead concentrations
in
Sparganium
sp. averaged 5 times higher, zinc in
Carex
sp. as much as 100 times higher, and
Mentha aquatica
7 times greater. Figure 9.11 shows a wide range of concentrations in different
parts of plants. Figure 9.12 is typical of the analyses, showing higher concentrations of zinc and
lead in the sediments than in the plants growing on them.
Based on the many plant associations found, their cover, and diversity indices, long-term
exposure to high concentrations of heavy metals in soils and plants do not appear to inhibit plant
community growth. The vegetation has existed on the wetland many years, even under long-term
exposure to heavy metals.
Physical and Chemical Analysis of Waters
Heavy metal concentrations in wastewater discharged to the wetland at different times are given
in Figure 9.13. There is a correlation between concentrations of total suspended solids (TSS) and
zinc and lead concentrations, suggesting that heavy metals are present mainly in non-ionic forms
— an assumption supported by filtration tests.
Upstream–Downstream Measurements
Results of the upstream–downstream measurements showed that there were no significant
changes in lead and zinc in the upper half of the wetland (Figures 9.14 and 9.15), but there were
L1401-frame-C9 Page 107 Monday, April 10, 2000 9:56 AM
© 2000 by CRC Press LLC
108 HEAVY METALS IN THE ENVIRONMENT: USING WETLANDS FOR THEIR REMOVAL
lead and zinc decreases in waters passing through the lower area in some runs. Reduction of
zinc and lead across the entire Biala River Wetland was much lower in the studied period 1989
to 1990 than in the year 1978. There was no difference in the reduction during summer and
winter periods. This suggests more reduction of zinc and lead due to physical and chemical
interactions with surface properties of the wetland plants, than to biological uptake by plants
(example: through osmosis).
Figure 9.11
Concentrations of lead (Pb) in the parts of plants in the Biala River wetland. (a) Stems; (b) leaves;
(c) roots. Stations are indicated by number.
120
100
80
60
40
20
0
Phragmites c.
Mentha aq.
Menyanthes t.
(a)
33
4
7
11
11
7
10
10
15
17
15
Concentration, ppm
Phragmites c.
Mentha aq.
Menyanthes
tr.
Typha l.
Carex sp.
Deschampsia
ca.
Sparganium
sp.
300
250
200
150
100
50
0
350
400
Concentration, ppm
(b)
Phragmites c.
Mentha aq.
Menyanthes
tr.
Typha l.
Carex sp.
Deschampsia
ca.
Sparganium
sp.
800
600
400
200
0
1000
1200
Concentration, ppm
Scirpus
la.
(c)
3
3
711
11
3
4
714
4
7
10
10
1517
2
5
6
13
16
9
1
3
6
15
14
3
4
7
11
11
3
7
14
7
10
10
2
6
1
6
15
14
5
L1401-frame-C9 Page 108 Monday, April 10, 2000 9:56 AM
© 2000 by CRC Press LLC
LEAD AND ZINC RETENTION IN THE BIALA RIVER WETLAND OF POLAND 109
Field Experiment
The field experiment provided a quantitative estimation of the role of the plant beds in retarding
flow, helping filter and sediment the particles containing lead and zinc. In the experimental plot
(Figure 9.5) the average plant density was 91 plants per square meter. The effect of the plants in
retarding the flow was evaluated by calculating a coefficient for the Manning equation that relates
water flow in channels to the head of water. For this density of wetland plants it was 0.392, which
is three times higher than the coefficients cited in the literature by Lee (1980).
PROPOSAL TO RESTORE WATER FLOW OVER THE WETLAND
Based on this research it is concluded that present water flows in channels bypass much of
the wetland plants, especially in the upper area. Greater filtration can be achieved by allowing
the receiving wetland to function as it did 15 years ago with waters flowing within the vegetation
more. Although mining wastewaters may decline in the future, municipal wastes are expected
to increase (Figure 9.17). The wetlands will be needed to filter excess nutrients like phosphorus
and nitrogen.
The upper part of the receiving area could be reestablished into a wetland again. In order to
accomplish this, it is proposed that a dike be built across the river valley at a distance of 400 to
Figure 9.12
Comparison of concentrations of lead (Pb) and zinc (Zn) in cattails (
Typha latifolia
) and their
sediments at three stations.
14,000
12,000
10,000
8,000
6,000
4,000
2,000
0
7,000
6,000
5,000
4,000
3,000
2,000
1,000
0
8,000
6,000
4,000
2,000
0
8,000
Zinc
Lead
Station 70
Station 73
Station 75
Concentration, ppm
Concentration, ppm
Concentration, ppm
10,000
Above
Ground
Roots
Sediments
Above
Ground
Roots
Sediments
Above
Ground
Roots
Sediments
L1401-frame-C9 Page 109 Monday, April 10, 2000 9:56 AM
© 2000 by CRC Press LLC
110 HEAVY METALS IN THE ENVIRONMENT: USING WETLANDS FOR THEIR REMOVAL
500 m from the Dabrowka Channel outlet. The dike (Figure 9.18) would be 0.80 m high and 2.5
m wide, resulting in the formation of an intermittent impoundment with a surface area of about
7.4 ha and a volume of 2600 m
3
(Figure 9.19). Longer retention periods would result in better
contacts between wastewater and the wetland vegetation, which may then increase the removal of
heavy metal pollutants. However, if the waters were continuously impounded, changing the hydro-
period and circulation, the vegetation would be lost and the purpose defeated.
The proposed dike experiment could provide a test of the concepts. With proper ecological
monitoring and measurements of efficiency of heavy metals removal in the changed condition,
guidelines could be obtained for using this approach downstream and elsewhere.
Figure 9.13
Substances in the wastewaters discharged into the Biala River wetland from 1977 to 1990.
(a) Total suspended solids; (b) zinc concentrations; (c) lead concentrations.
1977
1978
1979
1984 1985 1986
1987 1988 1989 1990
40
35
30
25
20
15
10
5
0
(b)
1977
1978
1979
1984 1985
1986 1987 1988 1989 1990
4000
3500
3000
2500
2000
1500
1000
500
0
(a)
Total Suspended Solids, ppm
1977
1978
1979
1984 1985 1986
1987 1988 1989 1990
80
70
60
50
40
30
20
10
0
Zinc, ppm
Lead, ppm
(c)
L1401-frame-C9 Page 110 Monday, April 10, 2000 9:56 AM
© 2000 by CRC Press LLC
LEAD AND ZINC RETENTION IN THE BIALA RIVER WETLAND OF POLAND 111
‘
Figure 9.14
Changes observed in lead concentrations as waters passed through the Biala River wetland.
Figure 9.15
Changes observed in zinc concentrations as waters passed through the Biala River wetland.
▲
✦
◆
●
★
■
Apr. 26, 1989
May 31, 1989
June 28, 1989
July 4, 1989
Sept. 29, 1989
Jan. 1, 1990
Mar. 10, 1990
Sept. 22, 1990
Sept. 2, 1990
1978
✳
✳
★
★
★
★
★★★
★
★
▲
▲
▲
▲
▲
▲
▲
▲
▲
▲
✦
✦
✦
✦
✦
✦
✦
●
●
●
●
●
●
●
●●
●
■
■
■
■
■
■
0 1000 2000 3000
4000 5000 6000
0.00
1.00
2.00
3.00
4.00
5.00
Lead, parts per million
*
*
*
*
*
*
*
*
✦
■
■
■
▲
▲
✦
◆
●
★
■
Apr. 26, 1989
May 31, 1989
June 28, 1989
July 4, 1989
Sept. 29, 1989
Jan. 6, 1990
Mar. 10, 1990
Sept. 22, 1990
Sept. 2, 1990
1978
0 1000 2000 3000
4000 5000 6000
0.00
2.00
4.00
6.00
8.00
10.00
Zinc, parts per million
*
*
*
*
*
▲
▲
▲
▲
●
●
■
●
●★
★
★
★
★
★
★
■
■
*
*
*
▲
L1401-frame-C9 Page 111 Monday, April 10, 2000 9:56 AM
© 2000 by CRC Press LLC
112 HEAVY METALS IN THE ENVIRONMENT: USING WETLANDS FOR THEIR REMOVAL
Figure 9.16
Reduction in concentrations of lead in waters during the field experiment on Plot #1. See
Appendix A9 for explanation of the way the line was drawn to the data.
Figure 9.17
Discharges into the Biala River wetland expected in the future.
Lead Reduction, percent
90
80
70
60
50
40
30
20
10
0
20
30
40 50 60
70
Time, minutes
100
80
3
2
1
0
Total
Mine Water
Municipal
Wastewater
Year
Flow, cubic meters per second
1995 2000 2005 2010
L1401-frame-C9 Page 112 Monday, April 10, 2000 9:56 AM
© 2000 by CRC Press LLC
LEAD AND ZINC RETENTION IN THE BIALA RIVER WETLAND OF POLAND 113
Figure 9.18 Dike proposed across the Biala River (Figure 9.19) to spread more water over the wetlands.
Figure 9.19 Map of the changed wetland and lake with the dike in Figure 9.18.
2.5 m
298.8 m
above
sea level
Broken rock, grit and gravel
Soil
0.8 m
300 m
Optional Positions
of Proposed Dike
Boundary Contour of
Proposed Lake
Canal
300 m
300 m
300 m
L1401-frame-C9 Page 113 Monday, April 10, 2000 9:56 AM
© 2000 by CRC Press LLC