Heavy Metals in the Environment: Using Wetlands for Their Removal - Chapter 11 ppt
Bạn đang xem bản rút gọn của tài liệu. Xem và tải ngay bản đầy đủ của tài liệu tại đây (708.1 KB, 21 trang )
121
CHAPTER
11
The Ecological Economics of Natural
Wetland Retention of Lead*
Lowell Pritchard, Jr.
CONTENTS
Evaluation Concepts 122
Emergy Evaluation 122
Economic Valuation 124
Methods 125
Lead Filtered by the Wetland 125
Measurements of Wetland Status 125
Energy and Emergy Evaluation 125
Economic Analysis 126
Results 130
Lead Retained by the Swamp 130
Emergy Evaluation of Impacted Wetlands 130
Emergy Evaluation of Lead Smelter-Chemical Recovery System 132
Comparison of Treatment Systems 134
Economic Analysis Using Money 135
Discussion 137
Emdollar Evaluation of Wetland Lead Retention 137
Economic Valuation of Wetland Lead Retention 137
Comparison of Emergy and Economic Evaluations 138
Wetland Potential for Lead Filtration in the Nation 139
Implications for Environmental Policy 139
Summary and Conclusions 140
Acknowledgments 141
With the reorganization of the biosphere by human economic and industrial development, a
new and more symbiotic pattern of environment and economics is emerging. Linked by the
biogeochemistry of chemical elements, ecological systems, particularly wetlands, are becoming
* Condensed by the Editor.
L1401-frame-C11 Page 121 Monday, April 10, 2000 10:05 AM
© 2000 by CRC Press LLC
122 HEAVY METALS IN THE ENVIRONMENT: USING WETLANDS FOR THEIR REMOVAL
recognized as part of the economy through their work in filtering toxic substances such as heavy
metals. Increasingly, wetlands have been found to be filters of many wastes of the economy which
can be retained in the landscape to mitigate the impact of economic activity. This chapter is an
evaluation of a Florida wetland system which filtered large quantities of lead from the discharge
of a battery processing plant. Field methods were used to compare treatment wetlands with reference
wetlands. Comparison was made between emergy analysis (spelled with an “m”) and mainstream
economic analysis methods in evaluation of wetland services in filtering a toxic metal. An estimate
is made of the potential value of wetland filtration of lead to the state and nation.
Two systems for recovery of lead batteries and lead-contaminated waters were evaluated:
(1) wetland filtration of wastewaters from acid washing of batteries; and (2) chemical treatment of
wastewaters at a lead reprocessing smelter. Both systems were evaluated with
economic
and
emergy
methods. From 1970 to 1979 the Sapp Swamp, Steele City Bay, in Jackson County, FL, received
acidic, lead-contaminated wastewaters from a battery reclamation operation. The 29-ha cypress-
tupelo wetland is the Superfund site described in Chapters 1 and 5. The technological battery
operation is a lead smelter–chemical treatment operation in Tampa, FL. The process of producing
lead batteries was also evaluated using emergy, obtaining the transformity of lead batteries (Figure
A11
B
.7) needed in calculations.
EVALUATION CONCEPTS
This chapter uses two concepts of evaluation: (1) environmental value based on the work of
nature and humans in generating a product; (2) economic values based on human perceptions and
market prices for a product.
Emergy Evaluation
Emergy evaluation provides common units for comparison of environmental and economic
goods and services. After all the inputs are identified with systems diagramming (example: Figure
11.1), each is evaluated in
emergy
units and summed. Emergy is the energy of one kind required
directly or indirectly for their production.
For instance, production of a bushel of corn may require many kinds of available energy from
sunlight, wind, rain, fertilizer, equipment, and human labor, but with emergy evaluation each is
expressed in units of one kind of energy previously used up. The production of wind energy requires
solar energy, and the production of rain requires solar energy and wind energy (which requires
solar energy). Fertilizer, equipment, and human labor are transformations of fossil fuel energy (the
production of which required solar energy and geologic energy). The amounts of solar emergy
necessary are back-calculated.
Emergy is thus a measure of environmental work (Odum, 1986, 1988, 1996) contributing to
production. Its unit is the solar emjoule (sej — see Chapter 4). By measuring the emergy previously
required per unit energy, the method recognizes differences in energy quality of environmental and
economic inputs. The emergy per unit energy is called transformity (sej/J). With each successive
transformation process, the transformity increases, thus measuring the position of an item in an
energy hierarchy.
Emergy flow per time is called empower. The higher the empower the greater is the economic
and ecological value of production (as defined in emergy units).
Emergy/mass ratios are convenient for calculating the emergy of materials which are often
more easily measured in mass rather than energy terms.
Although national emergy use and gross national product are partially independent (see Dis-
cussion), the emergy/money ratio of the overall economy in a given year (emergy use/gross national
L1401-frame-C11 Page 122 Monday, April 10, 2000 10:05 AM
© 2000 by CRC Press LLC
THE ECOLOGICAL ECONOMICS OF NATURAL WETLAND RETENTION OF LEAD 123
product) can be used to estimate the average emergy behind purchased services for which detailed
energy information is lacking (Odum, 1991).
For clarity, Table 11.1 provides a summary of definitions for emergy evaluation terms.
The emergy value of a wetland depends on the energy captured and used in biological production
(often measured by gross primary production). Calculation of stored emergy evaluates storages and
structure, for instance, peat in cypress swamps or tidal channels in salt marshes (Odum and
Hornbeck, 1996).
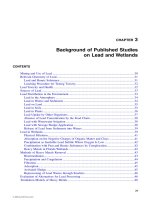
As systems diagrams show, the ecological goods, services, and storages considered economic
amenities are all direct or indirect products of the input energy flows. Figure 11.1 is an energy
diagram of the wetland receiving lead-polluted acid water. It shows the ecological system generating
a storage of lead-adsorbing sediments but experiencing a toxic effect from acid waters. The
sediments adsorb lead from the water column and return lead to the water column as they decay.
Figure 11.1
Energy diagram of swamp receiving lead-polluted water.
Table
11.1 Definitions of Emergy Evaluation Concepts
Emergy The energy of one type required directly or indirectly in transformations to
generate a product or service
Solar emergy Solar energy required directly and indirectly to produce a product or service
(units are solar emjoules — sej)
Transformity Emergy per unit energy for a given product or service in a system
Solar transformity Solar emergy per unit energy (units are solar emjoules/joule — sej/J)
Emergy per unit mass Energy of one type required to generate a flow or storage of a unit mass of
a material (units are sej/g)
Empower Emergy flow per unit time (units are sej/year)
Emergy/dollar ratio Ratio of emergy flow to dollar flow, either for a single pathway or, more
commonly, for a state or a nation, where annual emergy use is divided by
the gross economic product (units are sej/$)
Sources: Odum, 1988; Odum, 1991.
H
+
Pb
Water
Pb
Sediment
Rain
Runoff
Lead
water
Wind
Sun
Swamp
Aesthetics
Wildlife
Trees
plants
Clean water
To the
Regional
Economy
To the
Regional
Economy
Toxic
Effect
L1401-frame-C11 Page 123 Monday, April 10, 2000 10:05 AM
© 2000 by CRC Press LLC
124 HEAVY METALS IN THE ENVIRONMENT: USING WETLANDS FOR THEIR REMOVAL
Flows out of the system include some lead in water (though a lower concentration than the inflow)
and some lead in suspended sediment. The ecological system also generates aesthetic, wildlife, and
timber value to the regional economy.
Economic Valuation
In mainstream economics, goods and services are valuable to the extent that they are useful to
consumers. Some wetland contributions to people are directly useful (bird watching, boating,
recreational fishing) and are called “final” goods (Scodari, 1990).
Intermediate
wetland goods are
valuable to consumers because they serve as factors of production for goods which are, in turn,
enjoyed directly (for example, wetland trees may be a factor in the production of wood for fuel or
pulp for paper and wetland peat may be a factor of production in electricity). Where well-developed
markets exist for wetland final and intermediate goods, it is argued that prices reflect their value
to society. Where markets do not exist, economic value must be determined in other ways.
The
replacement cost
(or
substitution
cost
) method is one such way. This method is an attempt
to measure the value to society of nonmarketed wetland services such as heavy metal retention by
using the cost of a substitute for that service. If society is willing to bear that cost, the value of
the service must be greater than or just equal to the cost. (A different concept of replacement cost
involves measuring the cost of actually replacing a natural wetland and its functions with a
constructed wetland [Anderson and Rockel, 1991].)
The ability of wetlands to retain heavy metals such as lead is an intermediate wetland good.
In this economic paradigm, people do not actually value the intermediate good of heavy metal
retention; they value the final goods of clean water or refined lead (or the output of the industries
using heavy metals). The demand for wetland retention of heavy metals (which represents the
value they place on that service) is a “derived demand” — derived from the value of final goods
by a firm which will use the intermediate good to satisfy the demands of consumers (McCloskey,
1985, p. 450).
To use the replacement cost method of valuing wetland service, the derived demand is assumed
to be perfectly
inelastic,
which means that even with a higher-cost substitute, a firm (or society)
would demand the same amount of lead retention as with “free” treatment by a natural wetland.
For a discussion of why this assumption is made, see Appendix A11
A
.
Wetland products and services such as lead retention are called
positive externalities
. These are
societal benefits that arise from wetlands which cannot be captured by the wetland property owner.
Wetland production of waterfowl, for example, benefits society (especially hunters and bird watch-
ers), but this benefit is external to the private property owner’s decision-making boundary. If the
owner is not personally interested, then he or she is likely to sell or convert the wetlands into other
uses. Likewise, negative externalities (also called
social costs
) are costs “falling beyond the bound-
ary of the decision-making unit that is responsible for those costs” (Bromley, 1986), such as wetland
destruction from pollution. If decisions are to be made about the socially efficient provision of
wetland products and services, the magnitude of these externalities must be ascertained.
In summing benefits and costs over time, mainstream economics stresses the importance of the
time value of money. It is common practice in economic analysis to discount the value of future
benefits and costs. Discounting has been extensively criticized and defended in the literature (see,
for example, Pearce and Turner (1990, pp. 211–225), but the idea is that real current benefits (and
costs) are given more weight than prospective future benefits (and costs). Several reasons exist for
such discounting: inflation erodes the value of benefits over time, there may be some risk that the
future benefits will not materialize, and individuals are impatient (Randall, 1987, p. 239; Pearce
and Turner, 1990). Because the calculations here are in constant dollars, because the concern is
with the longer run, in which case risk has less meaning, and because societal rather than individual
values are considered, these three components (inflation, risk, and impatience) should not influence
our analysis.
L1401-frame-C11 Page 124 Monday, April 10, 2000 10:05 AM
© 2000 by CRC Press LLC
THE ECOLOGICAL ECONOMICS OF NATURAL WETLAND RETENTION OF LEAD 125
Another reason for discounting is that, on average, the economy is growing, and investments
yield a positive return. If the rate of return is 4% per year, then to receive $100 a year from now,
one would need to invest about $96 today. So it can be said that the
present value
of a promise of
$100 a year from now is $96. The rate of real growth in gross national product over the past 20
years has been about 4% (U.S. Department of Commerce, 1990), which may be taken to represent
an appropriate discount rate.
The discounted sum of annual net benefits over time is the
present value
of those benefits. For
longer periods of time it is usually called the
capital asset value
of those annual net benefits. For
such longer time periods, it is equivalent to the amount of money which would need to be invested
at a rate of interest equal to the given discount rate such that the return would equal the net benefit.
At a zero discount rate, the present value is the sum of expected net benefits. The discounting/income
capitalization formula is given in Appendix A11.
METHODS
The first step in valuing the work of the wetland in retaining lead was to quantify the amount
of lead actually held in the wetland sediments. The cost of providing this service was then estimated
using the emergy of lost wetland productivity. The cost of replacing the wetland service with a
technological treatment alternative was then calculated first in emergy terms and then in dollars.
Lead Filtered by the Wetland
The amount of lead retained in on-site wetlands and in Steele City Bay was estimated based
on data in Watts (1984) and Mundrink (1989). The total lead released over the lifetime of the plant
was calculated using the estimated number of batteries processed per year and the average con-
centrations of lead in the electrolyte.
Measurements of Wetland Status
To evaluate the loss of wetland productivity in the field, the gross primary production was
estimated in 1991 for each of three ecosystem components — trees, water lilies, and aquatic
producers. The swamp was divided into productivity classes based on the vegetation structure, and
the various productivity values found in 1991 were used to estimate swamp production in 1981
based on observations of vegetation structure in Lynch (1981). This provided another data point to
crudely estimate swamp recovery rates. To consider ecosystem effects other than productivity loss,
benthic macroinvertebrate species diversity was measured, and a bioassay of toxicity was made
with tree seedlings.
The emergy value of the trees killed was evaluated, but was not included in the value of wetland
damage, because for the most part dead trees were not lost to the system but rather were ecologically
recycled. The emergy value of the loss of wetland production over time represented the real
ecological damage. The transformity of wetland gross primary production for an undamaged
forested wetland in the Florida Panhandle was estimated based on average environmental inputs
of solar energy, wind energy, rain, and runoff. This transformity was applied to the loss of gross
primary production for the wetland system draining the Sapp Battery site, based on measurements
for 1991, estimates for 1981, and a number of projected recovery rates.
Energy and Emergy Evaluation
Energy–emergy evaluation (Odum and Arding, 1991; Huang and Odum, 1991; Odum, 1996)
was used to evaluate the lead battery production, the wetland filtration system, and the chemical
L1401-frame-C11 Page 125 Monday, April 10, 2000 10:05 AM
© 2000 by CRC Press LLC
126 HEAVY METALS IN THE ENVIRONMENT: USING WETLANDS FOR THEIR REMOVAL
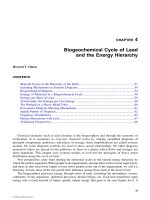
recovery system. First an energy systems diagram was constructed (Figures 11.1 and 11.2), detailing
the system boundaries, important sources, components, flows, and interactions. These were arranged
to show the hierarchy of components (more dilute energies converge to concentrated energies from
left to right) and the quality of sources (arranged outside the boundary from left to right in order
of quality). Pathway lines show flows of energy, materials, and information.
Emergy evaluation tables with five columns were prepared from the diagram:
Column 1: Item number indicating the table footnote detailing calculations
Column 2: Item from the diagram to be evaluated
Column 3: Data in typical units (joules, grams, or dollars)
Column 4: Solar emergy per unit (solar emjoules per unit: sej/J, sej/g, or sej/$)
Column 5: Solar emergy, in solar emjoules; the product of columns 3 and 4
For example, Table 11.2 evaluates annual flows of inputs and products and Table 11.3 evaluates
stored quantities. From the emergy evaluation table emergy indices were calculated to help inter-
pretations.
Economic Analysis
The value of the wetland for treating aquatic lead pollution was estimated using the mainstream
economic concept of replacement cost (Scodari, 1990). This involved three steps. First, the level
of treatment provided naturally was quantified. Second, the financial cost of a technological
substitute was calculated that would have provided the same level of treatment. Third, evidence
that the technological substitute would actually have been chosen in the absence of natural treatment
was supplied to confirm the replacement cost approach.
Figure 11.2
Energy diagram of a lead wastewater treatment plant showing inputs of batteries, water, energy,
chemicals, equipment, and labor.
Battery
Breaking
Treatment
To
Water
Lead
Acid
Plastic Casings
Wastewater
Sludge
smelter
Bat-
teries
Water
Fuels,
Electr.
Chem-
icals
Equip-
ment
Labor
Lead Plates
L1401-frame-C11 Page 126 Monday, April 10, 2000 10:05 AM
© 2000 by CRC Press LLC
THE ECOLOGICAL ECONOMICS OF NATURAL WETLAND RETENTION OF LEAD 127
Table 11.2
Emergy Evaluation of Yearly Flows in a Northwest Florida Swamp (29.2 ha)
with and without Lead/Acid Discharge, 1991
Note Item Raw Units
Transformity or
Emergy/Mass (sej/unit)
Solar Emergy
(sej)
Without discharge
Energy inflows
1 Sunlight 3.07 E12 J 1 sej/J 3.07 E12
2 Wind 1.02 E11 J 623 sej/J 6.37 E13
3 Rain, chemical 2.18 E12 J 15,444 sej/J 3.37 E16
4 Run-in 9.09 E11 J 41,068 sej/J 3.73 E16
5
Ecosystem processes
GPP (undamaged) 5.39 E13 J 1,317 7.10 E16
With discharge
Energy inflows
1 Sunlight 3.07 E12 J 1 sej/J 3.07 E12
2 Wind 1.02 E11 J 623 sej/J 6.37 E13
3 Rain, chemical 2.18 E12 J 15,444 sej/J 3.37 E16
4 Run-in 9.09 E11 J 41,068 sej/J 3.73 E16
6 Lead inflow 3.38 E5 g 7.30 E10 sej/g 2.47 E16
7 Lead outflow 1.11 E5 g 7.30 E10 sej/g 8.07 E15
Ecosystem Processes
8 GPP (damaged) 1.67 E13 J 1,317 2.20 E16
Notes
1. Solar input. 29.2 ha, 1.5 E7 J m
2
y
–1
(Fernald, 1981), albedo 30%.
(29.2 E4 m
2
)(1.5 E7 J m
2
y
–1
)(1 – 0.30) = 3.07 E12 J/y.
Transformity = 1.0 (by definition).
2. Wind energy. Diffusion and gradient values for Tampa, FL; Odum et al., 1987, p. 25 ff.
Winter:
(1 E3m height)(1.23 kg/m
3
air dens)(2.82 m
3
/m/s)(2.26 E–3 s
–1
)
(1.577 E7 s/half y)(29.2 E4 m
2
) = 8.09 E10 J/half y
Summer:
(1 E3 m height)(1.23 kg/m
3
air dens)(1.66 m
3
/m/s)(1.51 E-3 s
–1
) (1.577 E7 s/half
y)(29.2 E4 m
2
) = 2.13 E10 J/half y
Total = Summer + Winter = 2.13 E10 + 8.09 E10 = 1.02 E11 J/y.
Transformity = 623 sej/J (Odum et al., 1987, p. 4).
3. Rain, chemical. 1.51 m/y (Fernald, 1981). Gibbs free energy of rain relative to seawater,
4.94 J/g.
(29.2 E4 m
2
)(1.51 m/y)(1000 kg/m
3
)(4.94 E3 J/kg) = 2.18 E12 J/y.
Transformity = 1.54 E4 sej/J (Odum et al., 1987, p. 4).
4. Run-in. Drainage area estimated equal to wetlands area from USGS map. Annual runoff
rate for Northwest Florida 0.63 m/y (Kenner, 1966 in Fernald, 1981).
(29.2 E4 m
2
)(0.63 m/y)(1000 kg/m
3
)(4.94 E3 J/kg) = 9.09 E11 J/y.
Transformity = 41 E4 sej/J (Odum et al., 1987, p. 4).
5. Gross primary production (undamaged). Reference forest production from Table 5.4:
1.85 E8 J/m
2
/y
(1.85 E8 J/m
2
/y)(29.2 E4 m
2
) = 5.39 E13 J/y.
Transformity calculated from sum of emergy of 3 and 4 above divided by energy of gross
primary production.
(7.10 E16 sej/y)/(5.39 E13 J/y) = 1317 sej/J.
6. Lead inflow. Lead in process wastewater 0.27 g/battery. 1.25 E7 batteries processed
by Sapp in 10 years.
Total wetland area 29.2 ha.
(1.25 E7 batteries/10 years)(0.27 g Pb/battery) = 3.38 E5 g/y.
Emergy/mass of lead = 7.3 E10 sej/g.
continued
L1401-frame-C11 Page 127 Monday, April 10, 2000 10:05 AM
© 2000 by CRC Press LLC
128 HEAVY METALS IN THE ENVIRONMENT: USING WETLANDS FOR THEIR REMOVAL
The technological substitute was an existing wastewater treatment plant operated by a secondary
lead smelter in Tampa, FL. Operation and maintenance cost data were supplied by the firm (Neil
Oakes, personal communication), and capital costs for the treatment plant were estimated using a
component cost approach (James M. Montgomery Consulting Engineers Inc. 1985, p. 661) for
specific wastewater treatment processes and equipment.
The financial cost of replacing the wetland’s work in lead retention was calculated as the sum
of the capital cost of building a treatment facility and the operating costs to treat an amount of lead
equal to that which was retained by the wetland. The operating cost was obtained by multiplying
the unit operating costs (dollars/kilogram) to treat lead in the treatment plant by the amount of lead
(kilograms) retained in the swamp.
While the total benefit of allowing the wetland to treat lead waste was calculated from its
replacement cost, there were some economic costs incurred in this wetland use. The financial cost
of the loss of standing timber from the wetland was calculated from the amount of wood in tree
boles in the standing stock in the reference forest (Location RF, Figure 1.3) and from current market
stumpage values for wetland trees. The data from the 5
×
20-m tree plots were converted to
aboveground stem mass using the following regressions from Day (1984):
log
10
dry weight cypress (kg) = –0.99 + 2.426 log
10
dbh (cm)
log
10
dry weight hardwoods (kg) = –1.0665 + 2.4064 log
10
dbh (cm)
where dbh is the diameter at breast height.
The financial cost of the loss of timber production (as distinct from the loss of standing timber)
was estimated from the same market stumpage values of wetland wood multiplied by the estimated
annual wood production from Johnson (1978).
With wetland treatment, lead that with chemical treatment would be precipitated and recycled
to the economy was instead bound up in wetland sediments. This economic loss of lead metal was
calculated according to the market value of lead (Woodbury, 1988).
The costs of wetland treatment (loss of timber, timber production, and lead metal) were
subtracted from the benefits of wetland treatment (the replacement cost) to calculate the net
benefit of using wetland treatment. Since the stream of benefits and costs occurred over time,
the mainstream economic values of future benefits and costs were discounted at 4%. The formula
used was
where PV is present value, NB is annual net benefit, i is the discount rate, and t is the number of
years in the future. See Appendix A11.
7. Lead outflow. Lead inflow over 10 years = (0.27 g/battery)(1.25 E7 batteries) =
3.38 E6 g. Lead retained in wetland = 2.28 E6 g (this study).
(3.38 E6 g – 2.28 E6 g)/10 years = 1.11 E5 g/y.
8. Gross primary production (damaged). Weighted average of wetland production from
Table 5.4: 5.73 E7 J/m
2
/y.
(5.73 E7 J/m
2
/y)(29.2 E4 m
2
) = 1.673 E13 J/y.
Transformity = 1317 sej/J (calculated in note 5 above).
Table 11.2 (continued) Emergy Evaluation of Yearly Flows in a Northwest Florida Swamp
(29.2 ha) with and without Lead/Acid Discharge, 1991
PV
NB
t
1i+()
t
t0=
N
∑
=
L1401-frame-C11 Page 128 Monday, April 10, 2000 10:05 AM
© 2000 by CRC Press LLC
THE ECOLOGICAL ECONOMICS OF NATURAL WETLAND RETENTION OF LEAD 129
Table 11.3 Emergy Evaluation of Storages in a Northwest Florida Swamp (29.2 ha)
with and without Lead-Acid Discharge, 1991
Note Item
Raw Units
(sej/unit)
Transformity or
Emergy/Mass (sej) Solar Emergy
Without discharge
1 Water 1.38 E12 J 41,000 sej/J 5.67 E16
2 Lead in water 2.92 E1 g 7.30 E10 sej/g 2.13 E12
3 Wood 1.47 E14 J 32,000 sej/J 4.71 E18
4 Peat 3.26 E14 J 17,000 sej/J 5.55 E18
5 Lead in peat 2.73 E5 g 7.30 E10 sej/g 2.00 E16
With discharge
1 Water 1.38 E12 J 41,000 sej/J 5.67 E16
6 Lead in water 8.47 E3 g 7.30 E10 sej/g 6.18 E14
7 Wood 3.02 E13 J 32,000 sej/J 9.65 E17
4 Peat 3.26 E14 J 17,000 sej/J 5.55 E18
8 Lead in peat 2.28 E6 g 7.30 E10 sej/g 1.66 E17
Notes:
1. Water. Depth above peat = 0.5 m. Depth of peat = 0.5 m. Percent moisture =
89.6%. Density of wet peat = 1.0 E6 g/m
3
. Gibbs free energy of water =
4.94 J/kg.
Water in peat = (29.2 E4 m
2
)(0.5 m)(1.0 E6 g/m
3
)(0.896).
(4.94 J/g) = 6.54 E11 J.
Water above peat = (29.2 E4 m
2
)(0.5 m)(1.0 E6 g/m
3
).
(4.94 J/g) = 7.30 E11 J.
Total water above and in peat = 1.38 E12 J.
Transformity = 4.1 E4 sej/J (Odum, 1992b).
2. Lead in water (background). Pb conc = 2.0 E-10 g Pb/g water (Förstner and
Wittmann, 1983, p. 87, avg for freshwater).
(29.2 E4 m
2
)(0.5 m depth)(1 E6 g/m
3
)(2.0 E-10 g Pb/g water) = 29.2 g Pb.
Emergy/mass = 7.3 E10 sej/g (Table A11
B
.6).
3. Wood. Mass from reference forest tree plots = 34.4 kg/m
2
. Wood energy 3500
kcal/kg (Chapman & Hall, 1986, p. 467).
(29.2 E4 m
2
)(34.4 kg/m
2
)(3500 kcal/kg)(4186 J/kcal) = 1.47 E14 J.
Transformity = 3.2 E4 sej/J (Odum, 1992b, p. 27).
4. Peat. Depth 0.5 m. Moisture 89.6%. Density of wet peat 1.0 E6 g/m
3
.
Peat energy 2.15 E4 J/g (Odum, 1992b, p. 27).
(29.2 E4 m
2
)(0.5 m)(1 – 0.896)(1.0 E6 g/m
3
)(2.15 E4 J/g) = 3.26 E14 J.
Transformity = 1.7 E4 sej/J (Odum, 1992b, p. 27).
5. Lead in peat (background). Pb conc = 1.8 E-5 g Pb/g sediment (Okefenokee
Swamp, GA; Nixon and Lee, 1986, p. 116).
(29.2 E4 m
2
)(0.5 m)(1 – 0.896)(1.0 E6 g/m
3
)(1.8 E-5 g Pb/g peat) = 2.73 E5 g Pb.
Emergy/mass (see note 2).
6. Lead in water (contaminated). Pb conc = 5.8 E-8 g Pb/g water (Ton, 1990).
(29.2 E4 m
2
)(0.5 m depth)(1 E6 g/m
3
)(5.8 E-8 g Pb/g water) = 8.47 E3 g Pb/ha.
Emergy/mass (see note 2).
7. Wood. Mass (weighted average of tree plots) = 7.05 kg/m
2
. Wood energy 3500
kcal/kg (Chapman & Hall, 1986, p. 467).
(29.2 E4 m
2
)(7.05 kg/m
2
)(3500 kcal/kg)(4186 J/kcal) = 3.02 E13 J.
Transformity (see note 3).
8. Lead in peat (contaminated). Total Pb in peat estimated at 2276 kg for 29.2 ha
(Figure 5.1).
L1401-frame-C11 Page 129 Monday, April 10, 2000 10:05 AM
© 2000 by CRC Press LLC
130 HEAVY METALS IN THE ENVIRONMENT: USING WETLANDS FOR THEIR REMOVAL
RESULTS
Lead Retained by the Swamp
Lead retained in on-site wetlands was estimated to be about 1000 kg using Watts’ data (1984).
Lead retained in Steele City Bay was estimated at 1354 kg. The average of lead concentrations
reported by Ton (1990) for sediments in Steele City Bay was 52.1 kg/ha, or 1198 kg in all 23
hectares. The average of the two values for Steele City Bay was 1276 kg. Thus, the total lead
retained in on- and off-site wetlands was estimated at 2276 kg. For details on calculations, see
Pritchard (1992, Appendix E).
Assuming a linear rate of increase in battery processing by Sapp Battery from zero at the
beginning of 1970 (when the plant opened) to a peak of 50,000 batteries per week in 1979 (Watts,
1984), the total number of batteries processed was estimated at 12,525,000. Cumulative lead release
from those batteries over 10 years was estimated to be between 1528 and 6162 kg of particulate
and dissolved lead, based on data on electrolyte content from Watts (1984) (calculations in Pritchard,
1992, Appendix E). At a secondary lead smelter in Tampa, FL, process wastewater contained about
0.27 g lead for every battery. This, multiplied by the estimated 12,525,000 batteries processed at
Sapp, would put cumulative lead releases at 3382 kg.
The removal rate is the percentage of lead released that was retained in the wetland system.
Using the range of concentration given by Watts (1984), the removal rate for lead by the wetland
system was between 37 and 100%, with a middle value of about 67% based on data on wastewater
lead concentrations at a secondary lead smelter in Tampa, FL.
Since it is likely that the rate of battery processing at Sapp Battery increased exponentially
rather than linearly to its peak rate as was assumed, 12 million batteries processed is probably an
overestimate, making the actual removal rate higher than the calculated removal rate. However,
emergy and economic calculations that follow are based on the amount of lead retained rather than
on the removal rate. We evaluated the work the wetland did, not the work it did not do (i.e., lead
not absorbed from the waters flowing out).
Emergy Evaluation of Impacted Wetlands
The emergy per gram of lead metal was calculated by summing environmental work and human
work in extracting, refining, and processing in Appendix A11 and was 7.3 E10 sej/g.
The emergy evaluation of the wetlands which received wastewater from the Sapp Battery plant
based on the diagram in Figure 11.1 is given in Tables 11.2 (flows) and 11.3 (storages). The two
largest sources, rain and run-in, were taken as the main annual emergy input to the swamp system.
The reference forest wetland (Location RF) was used to represent the productivity of the impacted
wetland before damage began (line 5 in Table 11.2). The transformity of gross primary production
based on productivity values from the reference forested wetland was about 1300 sej/J.
Productivity data (Table 5.6) were used to estimate the actual level of energy processing in the
swamp in 1991 (line 8 in Table 11.2). Remote sensing information from a previous study (Lynch,
1981) was used to estimate the energy flows and transformations in the local wetlands system for
two points in time. Table 5.4 shows the reduction in empower per square meter due to the acidic
discharge for 1991. In Table 11.4 these estimates are multiplied by the appropriate areas to convert
them to total empower for the wetland complex (calculations in Pritchard, 1992, Appendix F).
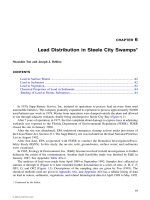
Figure 11.3 is a time graph of wetland empower based on the above calculations.
In the absence of detailed time-series data, several simplifying assumptions were made. It was
assumed that the decrease in empower of the system was linear from the beginning of operations
at Sapp Battery to its closure, a period of 10 years. Lynch’s measurements were made in 1981,
soon after the cessation of operations; the data he cites are taken as the minimum productivity of
the system. Linear recovery is also assumed up to 1991.
L1401-frame-C11 Page 130 Monday, April 10, 2000 10:05 AM
© 2000 by CRC Press LLC
THE ECOLOGICAL ECONOMICS OF NATURAL WETLAND RETENTION OF LEAD 131
Figure 11.3 shows three projections of future recovery, based on (1) the rate of recovery from
1981 to 1991, (2) double the rate of recovery from 1981 to 1991 (assuming that this may be the
effect if water levels were managed to allow regeneration), and (3) no further recovery past 1991.
The lost ecosystem production is the difference between potential and actual production.
The empower loss over time was integrated to obtain total emergy loss. Table 11.5 gives the
value of the integration using each of the projected recovery rates. Notice that if it is the case that
permanent ecological damage has occurred and that recovery time is infinite, the damage is also
regarded as infinite since it continues in perpetuity. This is in contrast with the mainstream economic
notion of discounting future benefits and losses discussed below.
The emergy in the storage of wetland trees that either died in place and fell or were cut down
and land-filled was substantial. Table 11.3 showed an emergy of wood (in stems only) of 1.61 E17
sej/ha for a typical Northwest Florida swamp. There were 25 ha of total tree mortality (Lynch,
1981), so the total emergy of dead trees was 4.03 E18 sej. Neither fallen trees nor land-filled trees
have completely oxidized, so much of the stored emergy has merely been transferred from standing
stock to the detrital pool or to a landfill. This stored emergy is therefore not counted as a loss in
the evaluation of wetland lead retention.
Table 11.4 Empower of Wetlands after Cessation of Lead/Acid Discharge
1981 1991
Empower of wetland system
a
1.0 E16 sej/year 2.2 E16 sej/year
Potential empower
b
7.1 E16 sej/year 7.1 E16 sej/year
Empower loss
c
6.1 E16 sej/year 4.9 E16 sej/year
Ratio of observed to potential empower 0.14 0.31
a
1981 value is based on remote sensing data from Lynch (1981); 1991 value is
based on the results of this study. Calculations in Pritchard (1992, Appendix F).
b
Based on the productivity of the reference forest (2.4 E11 sej/m
2
/year on 29.2 ha
of wetlands).
c
Difference between potential and observed empower.
Figure 11.3
Empower graph of destruction and recovery of wetlands which received lead/acid discharge
between 1970 and 1980, based on Table 5.4. Three recovery rates are projected: (a) present
rate, (b) double the present rate, and (c) no further recovery.
1960 1980 2000 2020 2040 2060
0
10
20
30
40
50
60
70
80
Year
(b)
(a)
(c)
Normal
1981
1991
90
100
1970
Damage
Recovery
Wetland Empower, x 10
15
sej/year
L1401-frame-C11 Page 131 Monday, April 10, 2000 10:05 AM
© 2000 by CRC Press LLC
132 HEAVY METALS IN THE ENVIRONMENT: USING WETLANDS FOR THEIR REMOVAL
Emergy Evaluation of Lead Smelter-Chemical Recovery System
The wastewater treatment plant of a secondary lead smelter in Tampa, FL, is diagrammed in
Figure 11.3, and the emergy evaluation is given in Table 11.6. Several new transformities were
calculated for chemicals used in the treatment system by making an emergy evaluation of their
systems of production (Appendix A11).
Table 11.5 Emergy Loss during Wetland
Destruction and Recovery
Recovery
Projection
a
Recovery
Time (years)
Loss
(sej
b
)
(a) 51 1.9 E18
(b) 30 1.4 E18
(c) Infinite Infinite
a
For explanation of projections see Figure 5.5.
b
Integration of empower reduction in Figure 5.5.
Table 11.6
Emergy Evaluation of a Water Treatment Plant (All Flows Are per Year)
Note Item Raw Units
Transformity or
Emergy/Mass
(sej/unit)
Solar
Emergy
(E16 sej)
Solar
Emergy
(sej)
Junk batteries 2.2 E6 batteries
1 Plastic battery casings 6.3 E13 J 6.6 E4 sej/J 413.5 4.1 E18
2 Battery acid 6.8 E9 g 9.1 E7 sej/g 62.0 6.2 E17
3 Lead in plates 2.7 E10 g 7.3 E10 sej/g 198,639.5 2.0 E21
Trucking cost for acid removal
4 Fuel 5.1 E11 J 6.6 E4 sej/J 3.3 3.3 E16
5 Services 5.8 E4 $ 1.6 E12 sej/$ 9.0 9.0 E16
Process wastewater
6 Water 2.5 E11 J 4.8 E4 sej/g 1.2 1.2 E16
7 Lead 6.0 E5 g 7.3 E10 sej/g 4.4 4.4 E16
Energy inputs to treatment
8 Caustic 9.7 E7 g 6.7 E9 sej/g 65.2 6.5 E17
9 Lime 3.0 E7 g 1.6 E9 sej/g 4.9 4.9 E16
10 Ferrous sulfate 3.3 E7 g 1.0 E9 sej/g 3.3 3.3 E16
11 Diatomaceous earth 1.6 E7 g 2.0 E9 sej/g 3.3 3.3 E16
12 Electricity 1.4 E12 J 2.0 E5 sej/J 29.0 2.9 E17
13 Labor 6.3 E0 p/year 3.4 E16 sej/p 21.3 2.1 E17
Plant capital value
14 Equipment 3.2 E4 $ 1.6 E12 sej/$ 5.0 5.0 E16
Effluent
15 Water 6.2 E10 J 4.8 E4 sej/J 0.3 3.0 E15
16 Lead 5.0 E2 g 7.3 E10 sej/g 0.004 3.7 E13
Recovered metals
17 Lead 6.0 E5 g 7.3 E10 sej/g 4.4 4.4 E16
Notes:
1. Plastic battery casings. 3.0 E6 lb (plant estimate); 4.6 E7 J/kg (Hall et al., 1986, p. 4).
(3.0 E6 lb)(0.454 kg/lb)(4.6 E7 J/kg) = 6.3 E13 J.
2. Battery acid. 7490 short tons (plant estimate) of 15 to 20% sulfuric acid (Watts, 1984).
(7.5 E3 tons)(9.07 E5 g/ton) = 6.79 E9 g.
Emergy per gram = 9.1 E7 sej/g (Table A11
B
.5).
3. Lead in plates. Lead per battery = 20.0 lb (Watts, 1984).
(2.22 E6 batteries)(20 lb/battery)(454 g/lb) = 2.02 E10 g.
Emergy per gram = 7.3 E10 sej/g (Table A11
B
.6).
L1401-frame-C11 Page 132 Monday, April 10, 2000 10:05 AM
© 2000 by CRC Press LLC
THE ECOLOGICAL ECONOMICS OF NATURAL WETLAND RETENTION OF LEAD 133
The Tampa facility receives whole batteries which are sawn and drained. The lead plates are
sent to the smelter on site. The plastic casings are washed and sold to a recycler. The electrolyte
is collected, allowed to settle, and shipped to phosphate fertilizer plants near Tampa to obviate the
need for expensive neutralization.
4. Fuel. 312 trips per year at 100 mi per trip (plant estimate).
Truck mileage about 8 mi/gal. Gasoline = 3.42 E7 J/l (Cervinka, 1980, p. 15).
(312 trips)(100 mi/trip)(1 gal/8 mi)(3.79 l/gal)(3.42 E7 J/l) = 5.05 E11 J.
5. Human services in trucking. Payment for hauling = $58,000.
1990 Emergy/money ratio = 1.55 E12 sej/$ (Odum, 1992b).
6. Water used to cool saws, clean battery casings, equipment, and workplace.
1.3 E7 gal (plant estimate) = 5.0 E7 l. Gibbs free energy of freshwater = 4.94 J/g (Odum,
1992b).
(5.0E7 l)(1000 g/l)(4.95 J/g) = 2.49 E11 J.
7. Lead in process wastewater. Average concentration = 12 mg/l (plant estimate).
(12 mg/l)(0.001 g/mg)(5.0 E7 l) = 6.0 E5 g.
Emergy per gram = 7.3 E10 sej/g (Table A11
B
.6).
8. Caustic soda. 214 tons of liquid (50%) caustic (plant estimate).
214 tons
*
50% = 107 tons.
(107 tons)(2000 lb/ton)(454 g/lb) = 9.7 E7 g.
Emergy per gram = 6.7 E9 sej/g (Table A11
B
.3).
9. Hydrated lime. 66,000 lb (plant estimate).
(66,000 lb)(454 g/lb) = 3.0 E7 g.
Emergy per gram = 1.6 E9 sej/g (Table A11
B
.2).
10. Ferrous sulfate. 1440 bags (plant estimate) at 50 lb/bag.
(1440 bags)(50 lb/bag)(454 g/lb) = 3.27 E7 g.
Emergy per gram = 1.0 E9 sej/g (value for sedimentary rocks, Odum, 1992b).
11. Diatomaceous earth. 36,000 lb (plant estimate).
(36,000 lb)(454 g/lb) = 1.63 E7 g.
Emergy per gram = 2.0 E9 sej/g (Table A11
B
.4).
12. Electricity. Used 4.03 E5 kwh (plant estimate).
(4.03 E5 kwh)(3.6 E6 J/kwh) = 1.45 E12 J.
13. Labor. The treatment plant operation involves the following amount of labor, measured in person-
years (1 person working 8 to 9 h/day for 1 year): 3 operators, 1 mechanic, 1 foreman,
0.5 lab tech, and 0.75 plant engineer = 6.25 person-years.
Emergy/person = GNP/population = 3.4 E16 sej/person (Odum, 1992b).
14. Human services embodied in plant equipment. Capital cost = 3.16 E5 $(1988) (estimated in this
study). Assumed plant lifetime = 10 years.
Annualized cost = ($3.16 E5)/(10 years) = $16,000/year.
15. Effluent water. 25% of inflow (75% is recycled; plant estimate).
(0.25)(5.0 E7 l)(1000 g/l)(4.94 J/g) = 6.2 E10 J.
16. Effluent lead. Average concentration = 0.04 mg/l (plant estimate).
(0.04 mg/l)(0.001 g/mg)(1.3 E7 l) = 504 g.
Emergy per gram = 7.3 E10 sej/g (Table A11
B
.6).
17. Recovered lead. Influent lead = 6.05 E5 g (note 8 above).
Influent – effluent = 6.05 E5 g – 504 g = 6.04 E5 g.
Emergy per gram = 7.3 E10 sej/g (Table A11
B
.6).
Table 11.6 (continued) Emergy Evaluation of a Water Treatment Plant (All Flows Are per Year)
L1401-frame-C11 Page 133 Monday, April 10, 2000 10:05 AM
© 2000 by CRC Press LLC
134 HEAVY METALS IN THE ENVIRONMENT: USING WETLANDS FOR THEIR REMOVAL
Water is used to cool the saws and to wash the plastic casings and the work area. This and
other process wastewater from the plant is collected and treated prior to release into the Tampa
sewer system. Storm water is also collected and treated in a parallel but separate process which is
not considered here.
The treatment system involves hydroxide precipitation of dissolved metals using caustic soda
and hydrated lime. Ferrous sulfate is added as a coagulant. The wastewater is passed through a
filter of diatomaceous earth. The metal-rich precipitate from the chemical process and the spent
diatomaceous earth are used in the smelter as sinter. Water from the filter is sent to a settling pond
from which it drains into the municipal sewer system of Tampa, which leads to a standard sewage
treatment plant.
Comparison of Treatment Systems
Table 11.7 is a summary table for treatment of lead by the two alternatives evaluated —
wetland and chemical treatment. The “emergy necessary” is a “cost” to society since it cannot
be used for other purposes. The emergy necessary for wetland treatment was evaluated as the
total lost emergy production by the wetland complex during the Sapp Battery plant operation
and during ecosystem recovery. The emergy necessary for chemical treatment was evaluated as
the emergy of services in treatment plant construction an
d materials (the money cost of construction multiplied by the U.S. emergy/$ ratio) and the
treatment emergy per kilogram of lead removed from the waste stream, which includes chemicals,
electricity, labor, and fuel, and services in acid removal.
As shown in Table 11.7, the emergy cost of chemical treatment was four to five times higher
than the emergy cost of wetland treatment, whether calculated per battery, per gram of lead
retained, or per emergy of lead retained. The ratio of emergy in treatment to the emergy of lead
retained is a kind of investment ratio, and had a value of 8 to 11 for wetland treatment and 32
for chemical treatment.
Table 11.8 shows the net benefit in emergy terms of using wetland treatment rather than chemical
treatment. The value of lead not recycled was included since it was a loss to the economy, and,
unlike dead wetland trees, it could not be used by the ecological system.
The net benefit from using wetland treatment was between 3.8 E18 and 4.29 E18 sej. The
average value of the swamp (29.2 ha) was 1.29 E17 to 1.47 E17 sej/ha.
Table 11.7 Summary Table of Emergy Indices for Lead Treatment Alternatives
Description Units
Wetland Treatment (30-
to 50-year recovery)
Chemical
Treatment
Emergy necessary for
operation/lead retained
sej/kg Pb 6.15 E14 to 8.35 E14
a
2.3 E15
b
Lead retained in swamp kg Pb × 2276 × 2276
Subtotal sej 1.40 E18 to 1.90 E18 5.23 E18
Emergy in equipment and building sej
+ 0.00 + 0.50 E18
c
Total emergy necessary sej 1.40 E18 to 1.90 E18 5.73 E18
Treatment efficiency
d
% retention 75 99
Emergy/emergy lead
e
sej/sej Pb 8.42 31.75
a
Based on emergy of wetland production loss of 1.4 E18 to 1.9 E18 sej from Table 11.5 divided
by the lead retained in the wetland, 2276 kg.
b
Based on operating emergy for lead wastewater treatment plant (the sum of rows 4, 5, and 8 to
13 in Table 11.6) divided by the lead retained by the treatment plant, 604 kg.
c
Based on financial capital cost from Table 11.9 divided by 1990 emergy/money ratio of 1.55 sej/$.
d
Treatment efficiency = lead retained/lead input.
e
Emergy of lead = (mass of lead retained)
*
(emergy/mass of lead), 7.3 E10 sej/g Pb.
L1401-frame-C11 Page 134 Monday, April 10, 2000 10:05 AM
© 2000 by CRC Press LLC
THE ECOLOGICAL ECONOMICS OF NATURAL WETLAND RETENTION OF LEAD 135
Economic Analysis Using Money
Capital costs for treatment plant construction were estimated according to the methods and data
in Gumerman et al. (1979a and 1979b) and James M. Montgomery Consulting Engineers Inc.
(1985). Values for unit processes are shown in Table 11.9. The sum of these processes were updated
to present costs using the Engineering News-Record (ENR) Building Cost Index (BCI) for the years
concerned, according to the following formula:
Updated Cost = 1978 Construction Cost
Operating costs for the treatment plant are given in Table 11.10.
Table 11.8 Emergy Value of Wetland Treatment Using the
Replacement Cost Method
Zero Discount Rate Emergy Value (sej)
Benefit
Replacement cost 5.73 E18
Emergy cost
Timber destroyed N/A
Loss of production
a
1.40 E18 to 1.90 E18
Lead not recycled
b
4.4 E16
Total cost (emergy loss) 1.44 E18 to 1.94 E18
Net benefit
c
3.79 E18 to 4.29 E18
B/C ratio
d
2.9 to 4.0
a
Based on recovery projections of 25 and 50 years.
b
2276 kg lead at 7.3 E10 sej/g (Pritchard, 1992, Appendix D).
c
Benefit minus total losses.
d
Benefit divided by total losses.
Table 11.9 Capital Costs of 36,000-gpd Water Treatment Plant, 1990 Dollars
Item
Unit Design
Value
Construction
Cost, 1978
Construction
Cost, 1990
a
Lime feed system
b
7.5 lb/h $15,000 $23,258
NaOH feed system
b
1,172 lb/day 25,000 38,764
Ferrous sulfate feed system
b
8.2 lb/h 15,000 23,258
Storage tanks
c
12 m
3
(3) 15,900 24,654
Circular clarifier
b
100 ft
2
30,000 46,516
Rapid mix basin
b
100 ft
3
10,000 15,505
Pressure diatomite filter
c
36,000 gpd 45,000 69,775
Dewatering lagoon
b
40,000 ft
3
9,000 13,955
Subtotal $164,900 $255,685
Contractor overhead
c
12% 19,788 30,682
Engineering 11%
d
18,139 28,125
Subtotal $202,827 $314,493
Legal, fiscal, admininistrative
c
6,200 9,613
Total capital cost $209,027 $324,107
a
Based on Engineering News-Record Building Cost Index (1913 = 100; 1978 = 1731;
1990 = 2684).
b
Gumerman et al., 1979.
c
Hansen et al., 1979.
d
J.M. Montgomery Consulting Engineeers, Inc., 1985.
Current BCI
1978 BCI
L1401-frame-C11 Page 135 Monday, April 10, 2000 10:05 AM
© 2000 by CRC Press LLC
136 HEAVY METALS IN THE ENVIRONMENT: USING WETLANDS FOR THEIR REMOVAL
The net present value of the total benefit (replacement costs) is given in Table 11.11. Details
of the calculation, including the time stream of benefits and costs, are given in Appendix A11
Table 11.10 Annual Operating Costs of a 36,000 gpd Water Treatment Plant, 1990 Dollars
Item
Quantity
($/unit) Price ($) Value
Energy and materials input to treatment
Caustic soda 214 tons 346 74,000
Hydrated lime 33 tons 85 2,805
Ferrous sulfate 36 tons 300
a
10,800
Diatomaceous earth 18 tons 450 8,100
Electricity 403 mwh 66 26,498
Subtotal (per year) $122,203
Labor and management 6.25 p ⋅ year 40,000
b
$250,000
Opportunity cost of capital, $162,000
c
@4.0% 6,480
Total plant operating costs (per year) $378,683
Trucking cost for acid removal
58,300
Total (per year) $436,983
Total (per gram lead retained)
d
$0.72
Total (per battery)
e
0.20
Note: All data are from Tampa lead treatment plant except as noted.
a
Traylor Chemical and Supply, Orlando, FL, quote over phone, 3-12-92.
b
Average 1990 skilled labor wage from Engineering News-Record.
c
Average value of physical capital taken to be one half of capital cost from Table 11.9.
d
Based on 6.04 E5 g Pb retained.
e
Based on 2.22 E6 batteries processed.
Table 11.11 Net Present Value of Benefits and Costs Associated with
Wetland Lead Retention at Discount Rates of 4 and 0% (Details
in Appendix A11A)
4% Discount Rate Net Present Value
Benefit
Replacement cost $1,617,375
Emergy cost
Timber destroyed
a
20,478–58,764
Loss of production
b
4,740–13,203
Lead not recycled
c
1,563
Total cost (emergy loss) 26,781–73,530
Net benefit
d
$1,543,845–1,590,594
B/C ratio
e
22–60
0% Discount Rate Net Present Value
Benefit
Replacement cost $1,962,827
Emergy cost
Timber destroyed
a
23,000–66,000
Loss of production
b
10,500–29,251
Lead not recycled
c
1,980
Total cost (emergy loss) 35,480–97,230
Net benefit
d
$1,865,597–1,927,347
B/C ratio
e
20–55
a
25 ha destruction at 344,000 kg/ha and range of market values for timber of
$0.0027 to $0.0077 per kg.
b
Based on market values for timber and a 50-year recovery period.
c
2276 kg lead at $0.87/kg (Woodbury, 1988).
d
Benefit minus total cost.
e
Benefit divided by total cost.
L1401-frame-C11 Page 136 Monday, April 10, 2000 10:05 AM
© 2000 by CRC Press LLC
THE ECOLOGICAL ECONOMICS OF NATURAL WETLAND RETENTION OF LEAD 137
(Table A11.1). Results are given for a 4% discount rate and a 0% discount rate (for comparison
with emergy analysis results which are not typically discounted). The capital costs were assumed
to occur in the first year of operation. Unit operating costs (dollars/kilogram lead retained) were
multiplied by the amount of lead retained in the wetland during each time period, which increased
over the 10 years of operation.
The economic loss due to timber destruction was calculated from the market stumpage value
of trees in the reference forest (Location RF on map [Figure 5.2]). The mass of tree stems calculated
from the Day (1984) regression was 344,000 kg/ha (standard error = .148,000 kg/ha). The market
value of black gum on the stump was $0.0027/kg for use as pulpwood (Earl Clark, Georgia-Pacific
Corporation Timber Department, personal communication) and $0.0077/kg for veneer (David
Cannon, Cross City Veneer, personal communication). The market value per hectare of wetland
wood was thus between $929 and $2650 per hectare. Lynch (1981) estimated the area of wetland
destruction based on absence of trees at 25 ha. The economic loss of the standing crop of trees
was therefore between $23,000 and $66,000. For the purposes of discounting, this loss was assumed
to be spread equally over the first 5 years of operation.
In addition there was a loss in production of timber over the period of destruction and recovery.
Johnson (1978) estimated that Taxodium/Nyssa stands produce over 100 ft
3
of wood per acre
annually (over 5075 kg/ha
–1
year
–1
). Using the market values given above for wetland wood, the
annual production would be valued at $14 to $39/ha
–1
year
–1
, or $350 to $975 (25 ha)
–1
year
–1
. For
purposes of discounting it was assumed that the wetland production fell at a constant rate from
1970 to 1980, and that recovery would be over a period of 50 years.
The lead that was retained by the wetland represents a loss to the economy, because in the
replacement cost scheme it would be recycled when the chemical precipitate is returned to the
smelter. The value of the lead could either have been added to the cost side, as was done here, or
subtracted from the benefit side (i.e., it would have partly offset the treatment cost). If the 2276
kg of lead had been returned to a smelter, as it is at the secondary lead smelter in Tampa, FL, the
value of the lead would have been about $2000 (2276 kg ∗ $0.87/kg [Woodbury, 1988]).
The discounted net value of wetland treatment was about $1,550,000 (Table 11.11), or
$53,000/ha
–1
($21,000/acre
-1
).
DISCUSSION
Emdollar Evaluation of Wetland Lead Retention
If the U.S. economy with a 1990 gross national product of $5.4 trillion is assumed to be emergy
estimated at 8.6 E24 sej, then the portion of the economy accounted for by the swamp for lead
treatment (about 4.0 E18 sej from Table 11.8) is comparable to $2,500,000, or about $85,000 per
hectare
($35,000 per acre).
Economic Valuation of Wetland Lead Retention
Since the total costs of wetland damage were known, the areas of producer surplus and social
cost could be approximated (Appendix A11).
The value of the sulfuric acid reclaimed under chemical treatment could have been considered
a loss under wetland treatment. In the chemical treatment alternative, the sulfuric acid was shipped
to local fertilizer plants for simple dilution of higher quality sulfuric acid, and had a minimal value
as acid. This practice was largely a useful disposal means obviating the need to treat the acid (Neil
Oakes, personal communication). The value of the acid was therefore not considered further.
Using only the market value of wetland timber to represent the social loss from wetland damage
is incomplete. There are no doubt other losses to society incurred by damaging wetlands, such as loss
L1401-frame-C11 Page 137 Monday, April 10, 2000 10:05 AM
© 2000 by CRC Press LLC
138 HEAVY METALS IN THE ENVIRONMENT: USING WETLANDS FOR THEIR REMOVAL
of aesthetic value, loss of fishery and wildlife support, and so on. These would be important to consider
in a more comprehensive analysis. From a mainstream economics perspective, these losses may have
had a low marginal value considering the size of the wetland relative to the total wetland area of
Florida or the nation. Were wetlands to come into use for heavy metal retention on a larger scale, the
value of each additional unit of these other losses would become more and more important, making
it difficult to scale up from the value for this wetland to a potential value for all similar wetlands.
The calculated net benefit to society from using the wetland was not very sensitive to the
discount rate used (see Table 11.11), because the large total benefits (replacement cost) accrued
within 10 years, and hence were little discounted, whereas the much smaller social costs (value of
timber lost) stretched forward 25 to 50 years, and were even smaller once discounted.
For fixed wetland size, very high loading levels could be more expensive than chemical
treatment, taking into account the level of ecological damage and the lower removal rate that would
result. The cost-effectiveness of chemical treatment at high loading levels was also found by Baker
et al. (1991) in comparison with wetlands treating acid mine drainage.
Comparison of Emergy and Economic Evaluations
Table 11.12 puts the two measures of value (emergy vs. mainstream economic value) on a
similar scale by showing the proportion of the national economy represented by each. The ecological
economic value calculated in emergy is shown as a fraction of estimated 1990 national emergy
use, and the mainstream economic value (undiscounted) is shown as a fraction of gross national
product. The undiscounted sum of costs and benefits is used since it is unclear what discount rate
could be used for emergy.
The cost of replacing the wetland service with chemical treatment as measured with emergy is
twice as large as when measured in dollars. However, the emergy cost of using wetlands is also
larger than the dollar cost, so that although the net benefit measured in emergy is larger than in
dollars, the benefit/cost ratio is much smaller.
As has been noted, a more comprehensive mainstream economic analysis would attempt to
measure more of the costs of using wetlands than timber loss. The difference in the fraction of the
economy accounted for as wetland damage in each of the two methods is, however, almost two
orders of magnitude, so adding in a few more items in the mainstream analysis would change the
comparison only a little.
Table 11.12 Comparison of Ecological Economic and Mainstream Economic Value
of Wetlands for Lead Treatment
0% Discount Rate
Ecological economic value
a
Fraction of National Emergy Use
Emergy/National Emergy Use
(times E-10)
Mainstream economic value
b
Fraction of Gross National
Product
Value/GNP (times E-10)
Benefit
Replacement cost 6702 3592
Costs
Timber destroyed N/A 42–121
Loss of production 1637–2222 19–54
Lead not recycled 51 4
Total costs 1680–2274
c
65–178
d
Net benefit
e
4428–5013 3414–3527
B/C ratio 3–420–55
a
Emergy values in Table 11.4 divided by 1990 U.S. estimate of emergy use of 8.55 E24 sej.
b
Dollar values in Table 11.7 divided by 1990 U.S. GNP of $5.465 E12 (1990 dollars).
c
Two cost estimates based on 30- vs. 50-year recovery projections.
d
Two cost estimates based on range of market values for wetland timber.
e
Benefit (replacement cost) minus total costs.
L1401-frame-C11 Page 138 Monday, April 10, 2000 10:05 AM
© 2000 by CRC Press LLC
THE ECOLOGICAL ECONOMICS OF NATURAL WETLAND RETENTION OF LEAD 139
If emergy is the driving force in the economy, then mainstream economics underestimates the
cost of both treatment alternatives, because both are resource intensive (one in nature and the other
in fossil fuel), and it ignores costs that are not recognized or borne directly by humans. There may
be a greater direct and indirect impact on social welfare with both treatment systems than is shown
by the money circulating in the process.
While there are substantial differences between the emergy method of analysis and mainstream
economics, both agree that value is a systems property, determined at system steady state (which
the mainstream economists call “general equilibrium”). Both agree that something is being maxi-
mized by the system (maximum power of the system in energy theory, maximum profit, or maximum
utility in mainstream theory). They fundamentally disagree on appropriate system boundaries and
the appropriate scale of analysis.
Wetland Potential for Lead Filtration in the Nation
The 29.2 ha of wetlands draining the Sapp Battery site retained 2276 kg of lead over 10 years.
The lead removal rate was 7.8 kg/ha/year. The total release of lead to air, surface water, and public
sewers reported in the U.S. EPA Toxics Release Inventory (1989) for 1987 was 1.5 million kg. If
the great majority of atmospheric lead is rained out over land, then at 7.8 kg/ha/year, it would take
192,000 ha of suitable wetlands to treat that level of lead emission, or approximately 0.5% of the
nations wetlands. It is surely the case that wetlands are even now mitigating the impact of heavy
metal pollution by providing retention, albeit at much lower levels than in the Sapp Battery wetlands.
In 1985 51 million batteries were recycled in the U.S. (Putnam Hayes and Bartlett Inc., 1986,
1987). Breaking and smelting generated 14,000 kg of lead in process wastewater. If all this waste
had been chemically treated it would have cost $10 million in money and used resources worth
3.2 E22 sej (from data in Tables 11.3 and 11.6). If the lead had been treated with natural wetlands
at the same loading as at the Sapp site, 1800 ha of wetlands would have been used, the financial
cost would have been zero (although there would have been opportunity costs), and the emergy
loss from ecological damage would have been about 1.0 E22 sej. With a greater wetland area and
lower loading rate, the ecological damage would have been much less.
Lead recycling rates are extremely susceptible to the vagaries of virgin lead prices. During the
fall in lead prices in the early 1980s, 6% of the secondary smelters in the U.S. went out of business
(U.S. Congress, 1991). In 1980 only 10 million batteries (of 60 million spent) were not recycled.
In 1985 22 million batteries (of 73 million spent) were not recycled (Putnam Hayes and Bartlett
Inc., 1987). These were land-filled, legally and illegally, and represent 200 million kg of lead
released into the environment or buried (at 9.1 kg lead/battery). Twenty-five sites on the National
Priority List of Superfund are now related to battery collection or recycling (U.S. Congress, 1991).
If those batteries had been recycled, even with no treatment of wastes, the amount of lead released
to the environment would have been only 6000 kg. If using wetlands for some wastewater treatment
or final polishing of wastewater can lower the costs of treatment, thereby making lead recycling
more profitable, more lead will be recycled and less will be land-filled.
Implications for Environmental Policy
The fact that society restricts pollution with effluent standards implies that society is willing
to pay a substantial amount for minimum level but is not willing to pay much extra for high levels
of abatement.
For many years wetlands were undervalued by individuals and society. Now wetlands protection
laws have “institutionalized” a recognition that the real value of wetlands far exceeded previous
values. Yet the dichotomy of preservation or conversion as the only two uses for wetlands may at
times stifle innovative attempts to tie wetlands into the human economy through their biogeochem-
ical cycles. Much of the potential value of wetlands to the economy lies in their careful use.
L1401-frame-C11 Page 139 Monday, April 10, 2000 10:05 AM
© 2000 by CRC Press LLC
140 HEAVY METALS IN THE ENVIRONMENT: USING WETLANDS FOR THEIR REMOVAL
It is often thought that the damages to society in using natural systems as waste absorbers is
underestimated. As was shown here benefits may be larger than usually believed. Also, there are
indirect environmental consequences to using technological substitutes that are directly and indi-
rectly fossil fuel intensive. In other words, wetlands may contribute even more to the economy
than can be estimated by dollar values, because of the environmental impacts and the reduced use
of fossil fuel-intensive technology.
Despite the fact that there appears to have been a net benefit, the case of Sapp Battery was
surely not optimal. Because battery casings and sulfuric acid were not recycled, as they are now,
wetland damage was more than it should have been. Also, because the savings in treatment cost
went largely to Sapp while the cost of wetland damage was suffered by society, more damage
occurred than would have been optimal. As humans organize to understand the potential and existing
role of wetlands in the economy, the scale of appropriate wetland use can be determined.
The ecological destruction of much of Steele City Bay and the pollution of its sediments with
lead were unfortunate and a misuse of nature. We suspect, however, that the ecological and economic
damage to nature and society would have been worse had this wetland not been there to intercept
the effluent from the Sapp Battery plant. Retaining wetlands on the landscape can buffer the effects
of willful environmental negligence. Although an abundance of wetlands may be somewhat redun-
dant from only a “heavy metals retention” viewpoint, they provide important insurance against
environmental accidents and catastrophes, as well as a multitude of other services.
Ecological engineering is a way to fit heavy metal industries into a prosperous society by tying
into nature’s cycles of elements, as shown here and in the Polish companion study (see Chapter 9;
Wójcik and Wójcik, 1989; Wójcik et al., 1990).
Further research on transformities of various forms of chemicals and elements is needed. If the
EPA Toxics Release Inventory weighted toxic releases by their transformity, an estimate of emergy
loss through pollution could be calculated. If transformity is in some way proportional to toxicity,
a ranking of hazardous potential would be possible, since the amounts released are known.
SUMMARY AND CONCLUSIONS
A wetland case study was used to derive an economic value for wetland lead retention using
both ecological economic and mainstream economic methods. A 29.2-ha cypress/black gum wetland
received lead/acid discharge from a reclamation facility that processed an estimated 12.5 million
automobile batteries in 10 years. The wetland retained about 2276 kg of lead, an average removal
rate of about 7.8 kg/ha
–1
year
–1
.
The ecological damage caused by the lead/acid discharge was substantial. Gross primary produc-
tion in the damaged wetland was 70% less than gross primary production in a nearby undamaged
wetland. Leaf area index of trees was less than 10% in the damaged wetland. Benthic macroinverte-
brate diversity was normal. Regeneration of canopy species was probably inhibited not by toxicity,
but by constant high water levels, since tree seedlings planted in contaminated areas survived.
Both emergy and mainstream economics show a net benefit from the use of the wetland for
lead retention (with some ecological damage) compared with use of a chemical treatment system
(with no wetland damage). Lead retention by the wetland saved the economy resources valued at
about 4.0 E18 sej and about $1.5 million.
Replacement cost was defined as the resources necessary (in emergy or dollar terms) to replace
the lead retention function of the study wetland with a chemical treatment system. Both emergy
and mainstream economics showed a net benefit from the use of the wetland for lead retention
(with some ecological damage) compared with use of a chemical treatment system (with no wetland
damage). Using the wetland resulted in net savings to the economy of resources valued in emergy
terms at 3.8 E18 to 4.3 E18 sej, and resources valued in dollar terms at $1.5 to $1.6 million (over
10 years of wetland use, 50 years of wetland damage recovery, and with a discount rate of 4%).
L1401-frame-C11 Page 140 Monday, April 10, 2000 10:05 AM
© 2000 by CRC Press LLC
THE ECOLOGICAL ECONOMICS OF NATURAL WETLAND RETENTION OF LEAD 141
The benefit/cost ratio was lower using emergy evaluation (B/C ratio 3:4) than with mainstream
economics (B/C ratio 20:55), because the value of wetland damage was larger using emergy
evaluation. Since the gains from wetland use went largely to the polluting firm and the losses from
wetland damage were suffered mainly by others, wetland damage may have been excessive.
Emergy and mainstream economic methods were compared by expressing each as their fraction
of the national economy comparing emdollars and dollars. The emergy method valued the emdollars
of work of the wetland nearly twice as high as the dollars from the mainstream economic method
(6.7 E-7 vs. 3.5 E-7). However, the emdollars of wetland damage was also greater (by a factor of
35 to 9) than the market value of the damage. As a result, the net benefit of using the wetland for
lead retention was close using the two methods; the ecological economic value as a fraction of
national emergy use was 4.5 E-7 to 5.0 E-7 and the mainstream economic value as a fraction of
gross national product was 3.4 E-7 to 3.5 E-7.
When expressed as a fraction of the economy, values derived from emergy evaluation are nearly
always higher than mainstream economic values because unpaid inputs from the environment are
included. At present both methods reveal valuable information about the structure of the economy
and its dependence on natural systems. They should both be used in gathering information for use
at the public policy level. Mainstream economic methods reveal valuable information about human
behavior and preferences, whereas ecological economic methods reveal more about the real depen-
dence of the human economy on natural systems and resources.
Capacity for retention of toxic substances may be one of the highest values of wetlands, but
the standard economics method used (based only on money values) may underestimate both the
replacement value of the wetland and the value of ecological damage.
ACKNOWLEDGMENTS
This work, based on research conducted for a master’s degree at the University of Florida
(Pritchard, 1992), was made possible by a grant for the study of Heavy Metals in Wetlands from
the D.T. Sendzimir Foundation to the Center for Wetlands, University of Florida, with H.T. Odum
as Principal Investigator. Thanks are in order to my master’s committee, H.T. Odum, Gary Lynne,
and J.J. Delfino, and to my collaborator, Shanshin Ton, whose thesis “Natural Wetland Retention
of Lead from a Hazardous Waste Site” provided much of the data on lead analyses and processes.
Other assistance was provided by Robert Woithe, Jan Sendzimir, Karen Pritchard, Joanna Pritchard,
Peter Keller, Clay Montague, and Kathleen Dollar. Peter Wallace graciously donated the tree
seedlings used in the toxicity test. William Dunn of CH2M-Hill provided access to data and reports
on the site. Neil Oakes of Gulf Coast Recycling provided the data for replacement cost analysis.
L1401-frame-C11 Page 141 Monday, April 10, 2000 10:05 AM
© 2000 by CRC Press LLC