Integrated Assessment of Health and Sustainability of Agroecosystems - Chapter 2 potx
Bạn đang xem bản rút gọn của tài liệu. Xem và tải ngay bản đầy đủ của tài liệu tại đây (1.08 MB, 31 trang )
25
2
Design and
Implementation of an
Adaptive, Integrated
Approach to Health
and Sustainability in a
Smallholder-Dominated
Agroecosystem
2.1 INTRODUCTION
How can knowledge and research be structured to help people make better decisions
with regard to managing their agroecosystems? Increasingly, recognition is growing
among researchers and development workers that people are part of complex systems
(Fitzhugh, 2000). Through various activities, they inuence the structure and func-
tion of these agricultural and ecological systems to increase the benets they derive
from them, serving—in this way—as the primary managers of the system. The sys-
tems, however, consist of extensive, complex, and dynamic interrelationships, such
that activity at one point of the system results in complex, sometimes counterintuitive
or unpredictable reactions at other spatial or temporal points (Holling, 1986, 1992).
Furthermore, the reactions may be lagged in time or difcult to perceive because of
the scale at which they occur. Because of these, the consequences of various man-
agement strategies are not always easily recognized, making purposeful manage-
ment of these complex systems difcult.
The concept of health has been found useful in structuring the processes of man-
aging an agroecosystem toward the desired or ideal state (Rapport, 1995; Waltner-
Toews and Nielsen, 1995; Haworth et al., 1998). Agroecosystem health is a metaphor
that helps to organize knowledge about agroecosystems, structure our evaluative
judgments concerning their current state, and reect them against our hopes for the
future so that they (agroecosystems) might be monitored and managed adequately
(Haworth et al., 1998). Agroecosystem health management consists of ve steps:
(1) describing the system of interest; (2) identifying the owners, actors, and custom-
ers; (3) setting or naming the goals and objectives of the system; (4) identifying
and implementing feasible and desirable changes; and (5) monitoring appropriate
© 2009 by Taylor & Francis Group, LLC
26 Integrated Assessment of Health and Sustainability of Agroecosystems
indicators, reassessing the situation, and implementing desired changes (Bellamy
et al., 1996; Waltner-Toews and Nielsen, 1997).
A systemic description is a model, built using conventional systems theory (Bel-
lamy et al., 1996), the purpose of which is to describe the behavior of the agroeco-
system. Agroecosystems, however, can be viewed and interpreted from a variety of
nonequivalent perspectives (Waltner-Toews et al., 2000), giving rise to multiple—
conicting or complementing—descriptions (Gitau et al., 1998). Since farmers and
communities are the primary managers of the agroecosystem, a managerially useful
description is likely to be a synthesis of their perspectives. Colearning tools such
as action research (Stringer, 1999) provide means through which such a synthesis
can be achieved. By incorporating the primary managers in a collegial participa-
tory process (Biggs, 1989), action research methods provide the framework through
which implementation of desired changes and reassessment of the situation can be
carried out.
Agroecosystem goals are a reection of what are considered desirable states for
the agroecosystem (Bellamy et al., 1996). According to Haworth et al. (1998), agro-
ecosystem goals can be derived in three ways. The rst is a purely subjective process
by which expectations for the agroecosystem are decided on a priori based on what
is generally regarded as the purpose of the agroecosystem. In the second way the
human participants of an agroecosystem form expectations for that agroecosystem.
In this sense, system goals are the expected outcomes of transformations that agro-
ecosystem users, owners, or managers would undertake to modify the agroecosys-
tem to optimize the benets they derive from it. Another way of generating system
goals is to study the way the agroecosystem functions, with the selection of system
goals a matter of elucidating the goals inherent in the system itself. The three meth-
ods represent different points of a continuum; the choice is dependent on the nature
of the agroecosystem under study. Whichever way is used to derive system goals,
the account of agroecosystem health will consist of a list of goals, a description
of the agroecosystem’s capacity to meet those expectations, coupled with a list of
indicators that enable one to decide how well the system is meeting the expectations
(Haworth et al., 1998). Data gathered using these indicators then serve as a basis for
rening the system descriptions and management goals (and therefore the indicators
themselves) in an iterative, feedback process.
The use of indicators to study complex phenomena is widely accepted (Rapport
and Regier, 1980; Odum, 1983; Rapport et al., 1985; Swindale, 1992; Izac and Swift,
1994; Winograd, 1994; van Bruschem, 1997; Aldy et al., 1998; Smit et al., 1998).
Their use is complicated by the fact that agroecosystem health is system and scale
specic, making the choice of indicators and their interpretation similarly specic.
In addition, there is a virtually innite list of potential indicators. What is needed to
implement the broad ideas of health and sustainability is not so much another list of
indicators to measure but an integrated framework within which such indicators can
be developed and interpreted (Waltner-Toews, 1991). Without a conceptual model
that provides a framework for selecting indicators, specifying the data collection and
calculation methodologies and a process for synthesizing all the information into
a picture of the system, the overall status of the system cannot be assessed (Boyle
et al., 2000).
© 2009 by Taylor & Francis Group, LLC
Design and Implementation of an Adaptive, Integrated Approach 27
This chapter describes the process used to implement an integrated and adaptive
approach to agroecosystem health and sustainability management in a smallholder-
dominated tropical highlands agroecosystem. Participatory and action research meth-
ods were used to generate system descriptions and to generate local theory (Elden
and Levin, 1991) on the management of agroecosystem. Soft system methodologies
were used as a tool for creating mutual understanding and for negotiation among
the stakeholders so that action plans can be made and implemented. Conventional
research methods were used to carry out measurements on selected indicators.
2.2 RESEARCH STRATEGY AND METHODS
Kiambu district, a geopolitically dened region within the Kenyan highlands, was
chosen as the study area for two reasons: (1) its proximity to the University of Nai-
robi (cost considerations) and (2) the fact that it is a district with high agricultural
potential and with a preponderance of smallholder farms. The district is relatively
more endowed with resources, while agricultural production is more intense than in
many other districts. Questions of ecosystem sustainability and health are therefore
of greater concern in this district. There are relatively more management options for
self-sustenance in Kiambu, therefore providing a suitable venue for testing methods
of implementing health and sustainability.
The project involved three groups of actors: (1) communities in six study sites
distributed across the district, (2) resource persons comprising extension and techni-
cal staff from divisional administrative ofces, and (3) researchers. The last group
a multidisciplinary team of agronomists, economists, engineers, medical personnel,
sociologists, and veterinarians. Additional personnel, including district staff, and
experts from governmental and nongovernmental organizations were included when
need arose. All people living within each respective intensive study site (ISS) were
invited to participate in the village workshops. However, communities decided to
elect a committee, referred to as the village AESH committee, to serve as the focal
point for action plan implementation and for communication between the community
and other actors. There was a resource persons’ team in each division of the district.
Each team served as the main link between the research team and the communities.
A group of six to eight people were selected from a divisional team to be facilitators
in participatory workshops organized in study sites within their jurisdiction.
Table 2.1 shows a chronology of the main activities carried out in the project.
Initial activities included (1) collection and collation of background information,
(2) training of researchers and their assistants in participatory methods, and (3) initial
village workshops. Subsequently, the multidisciplinary team attempted to analyze
the village systems using loop (inuence or spaghetti) diagrams (Puccia and Levins,
1985). It was then proposed that each community should be requested to make simi-
lar diagrams to show how they perceived the relationships among factors inuencing
the health and sustainability of their agroecosystems. A list of potential indicators
was then generated and used to carry out a baseline assessment. Concurrently, com-
munities were facilitated to develop their own suite of indicators and to use them
to monitor and assess their agroecosystem in a separate process. The researcher-
developed suite of indicators was rened using correspondence analysis. The initial
© 2009 by Taylor & Francis Group, LLC
28 Integrated Assessment of Health and Sustainability of Agroecosystems
TABLE 2.1
Chronology of Activities Carried Out in a Process to Assess the Health
of a Tropical Agroecosystem in the Central Highlands of Kenya
Timescale Action Outputs Actors
April 1997 Secondary data search,
collation, and analyses
Hierarchy structure of the
Kiambu agroecosystem;
choice of scales and
sampling strategy
Researchers
May 1997 PAR training Expertise in PAR methods,
visual aids (researchers
and assistants)
Research team
June 1997 Sampling study sites List of study sites,
workshop schedules
Researchers and
resource persons
July–October
1997
Initial village workshops
in the ISS
System descriptions,
problem analysis,
community action plans
Communities,
researchers, and
resource persons
September 1997 Multidisciplinary team
meeting
System description;
problem analysis
Researchers,
multidisciplinary
team
October–
November 1997
Village workshops Inuence diagrams,
problem analyses, soft
system models
Communities,
researchers, resource
persons
December 1997 Multidisciplinary team
meeting
List of potential research-
based indicators
Researchers and
resource persons
January–March
1997
Census of land-use units Typology of land-use units Communities,
resource persons
April 1997 Statistical and system
analyses
System attributes, models,
and potential indicators
Researchers
May 1998 Multidisciplinary team
meeting
A suite of research-based
indicators
Researchers,
multidisciplinary
team
May 1998 Leadership training and
intervillage workshop
Understanding of AESH
and monitoring and
evaluation concepts
Community leaders,
researchers, resource
persons
June 1998 Multidisciplinary team
meeting
Methods for measuring
research-based indicators
Researchers,
multidisciplinary
team
July 1998 Village workshops Community-driven
indicators, AESH training
materials
Communities,
researchers, and
resource persons
August–October
1998
Village workshops Analyses of community-
based indicators data;
overall evaluation
Communities
October 1998–
January 1999
Development of
measurement tools
Questionnaires,
semistructured interviews,
participatory tools
Researchers,
multidisciplinary
team
© 2009 by Taylor & Francis Group, LLC
Design and Implementation of an Adaptive, Integrated Approach 29
phase of the research process was concluded with a wrap-up workshop in which
community leaders, resource persons, and some members of the multidisciplinary
team discussed the problems, advantages, and disadvantages of the AESH approach.
A conceptual framework of the research strategy is summarized in Figure 2.1.
2.2.1 se C o n D A r y DA t A A n D ho l A r C h i C A l sC A l e s
The purpose of secondary data was to construct a conceptual hierarchical structure
of the Kiambu agroecosystem and to identify the scales (in these hierarchies) at
which health and sustainability management would best be carried out. Secondary
data were used to provide information on the biophysical, economic, and sociopoliti-
cal characteristics of the Kiambu agroecosystem. Administrative and topographical
maps of the district (Survey of Kenya topology maps 134/3, 134/4, 148/2, 149/1, 148/3,
148/4) provided background data on administrative boundaries, topography, infra-
structure, and natural resource endowment. Data on climatic and ecological zonation
were derived from the Farm Management Handbook (Jaetzold and Schmidt, 1983).
Kiambu District Development Plans and reports from various government ministries
were used to provide information on existing projects and development plans.
Holarchies were dened from two perspectives: the biophysical and the human
activity perspectives. The human activity holarchy followed social, cultural, and
TABLE 2.1 (continued)
Chronology of Activities Carried Out in a Process to Assess the Health
of a Tropical Agroecosystem in the Central Highlands of Kenya
Timescale Action Outputs Actors
January–March
1999
Research-based
indicator measurement
(land use)
Land-use unit-level
indicator data
Researchers
April–June 1999 Research-based
indicator measurement
(study site)
Village-level research-based
indicator data
Researchers, resource
persons,
communities
May 1999 Multidisciplinary team
meeting
Approaches to analysis of
research-based indicators
Researchers,
multidisciplinary
team
August 1999–
February 2000
Research-based
indicator analyses
Renement of research-
based indictors
Researchers
March–
November 2000
Village workshops Monitoring and evaluation
using both suites of
indicators
Researchers,
communities
August 2000 Wrap-up workshop Overall assessment of the
AESH process by the
communities
Community leaders,
resource persons,
multidisciplinary
team
AESH, agroecosystem health; ISS, intensive study site; PAR, participatory action research.
© 2009 by Taylor & Francis Group, LLC
30 Integrated Assessment of Health and Sustainability of Agroecosystems
political boundaries, while the biophysical holarchy was dened mainly by geocli-
matic and land use characteristics. The scale at which to carry out the study was
decided on based on three considerations. The rst was that the health and sus-
tainability of smallholder farms was of most concern in this study. Second, the
integration of ecological, economic, and social factors gives rise to emergent prop-
erties that are key to the health and sustainability of smallholder farms. Last, the
principle stated by Izac and Swift (1994) that to assess sustainability at a given level
(n) in the holarchy, both the level above (n + 1) and that below (n − 1) must also be
included in the assessment.
2.2.2 sA m p l i n g st u D y si t e s
Once the target hierarchical scales were identied, a sampling strategy for each
scale was decided. It was assumed that comparisons among sampling units within
each scale as well as an assessment of how they complement and interlink with oth-
ers would provide sufcient details on the main features of the agroecosystem as a
whole. In this study, two sampling units were used. The rst were the study sites,
Identifying
holarchical
scales
Collating
secondary data
Developing a systemic
description of the
agroecosystem
Selection of stakeholder
driven
indicators
Monitoring,
evaluation,
assessment
Selection of
research-based
indicators
Action planning
Implementation
of interventions
Sampling
study sites
Key
Italics = Participatory process; Bold = Stakeholder driven activities
Normal = Research-based activities
FIGURE 2.1 Flowchart of the research process used to assess and implement health and
sustainability of a smallholder-dominated, tropical highlands agroecosystem. See CD for
color image.
© 2009 by Taylor & Francis Group, LLC
Design and Implementation of an Adaptive, Integrated Approach 31
corresponding to villages in the human activity holarchy and catchments in the bio-
physical. The second sampling units were the land-use units, roughly corresponding
to farms in the biophysical holarchy and to households or homesteads in the human
activity holarchy. Land-use units were dened as parcels of land separated by formal
boundaries shown on ordinance survey maps. Households were dened as people
living under the same roof or sharing food from the same kitchen. Homesteads were
groups of households within the same land-use unit, with no formal boundaries
between them.
The Kiambu agroecosystem was stratied into regions based on the holarchical
scales in the human activity system. A stratied purposive sampling protocol was
used to select study sites. The criteria for selection were preponderance of small-
holder farmers (favored if more) and the number of development agencies (favored
if less). This was done by the resource persons using a participatory scoring matrix.
In total, 12 sites (2 in each main holarchical division) were selected. Six of the study
sites (one in each division) were labeled “intensive” (ISS) and the others “extensive”
(extensive study sites, ESSs) using a random protocol. The ISSs were those study
sites in which health and sustainability interventions were instituted.
2.2.3 sy s t e m i C De s C r i p t i o n A n D AC t i o n pl A n n i n g
The objective was to obtain a systemic description of the agroecosystem based on the
perspectives of the people living in the ISSs. The process commenced with partici-
patory workshops in each of the six ISSs. The local language, Gikuyu, was used as
the main language of communication between community groups and the research
team. These workshops had three objectives: (1) a systemic description of the agro-
ecosystem, (2) participatory problem analysis, and (3) community action planning.
Data on (1) boundaries, (2) natural resources, (3) institutional structure, (4) historical
background, (5) social structure, (6) farming system characteristics, (7) economic
and climatic trends, (8) human health, (9) constraints to health and well-being of the
residents, and (10) their coping strategies were gathered, analyzed, and presented
using a variety of participatory tools. The workshops culminated with participatory
problem analysis and action planning. Details of the methods used are presented in
Chapter 3.
One-day workshops were held in each of the ISSs 4–6 weeks later. In these, par-
ticipants (the village committee and at least one representative from each household/
homestead) were asked to make similar inuence diagrams based on their percep-
tion of these relationships. The resulting diagrams were analyzed using graph theory
(Bang-Jensen and Gutin, 2001), qualitative methods (Puccia and Levins, 1985), and
pulse process modeling (Perry, 1983). Details of these analyses are presented in
Chapter 4.
Descriptions and pictures of the problematic situations identied in each of the
ISSs (holons) were developed using approaches described by Checkland and Scholes
(1990). Relationships among various institutions and interest groups were explored
and depicted in rich pictures (Checkland, 1979a). In addition, root denitions (Check-
land, 1979b) were made for each intervention in the community action plans. These
denitions, descriptions, pictures, and models were used in two ways: (1) to identify
© 2009 by Taylor & Francis Group, LLC
32 Integrated Assessment of Health and Sustainability of Agroecosystems
both the sources and the types of conicting or competing perspectives, goals, and
action plans; and (2) as tools for generating a common understanding of a problem
situation and for negotiating some degree of consensus on goals and plans. These are
discussed in detail in Chapter 5.
To determine the types and characteristics of the units comprising the penultimate
layer of the study sites, a census of all land-use units within each of the six ISSs was
carried out. In this census (Appendix 1) details on the (1) characteristics of the owners
and managers, (2) types and quantities of resources available, (3) types of enterprises
carried out within them, (4) constraints to productivity, (5) goals and objectives, and
(6) productivity were sought. Gini coefcients and Lorenz curves as described by
Casley and Lury (1982) were used to explore the distribution of resources among the
land-use units. Gini coefcients were calculated as (T1 − T2)/10,000, where T1 is
the sum of the cross products of cumulative percentage of land-use units and lagged
cumulative percentage of the resource. T2 is the sum of the cross products of lagged
cumulative percentage of land-use units and cumulative percentage of the resource.
The Gini coefcient lies between 0 (absolute equality) and 1 (absolute inequality).
If two distributions are compared, the one with a larger coefcient is more unequal,
but this depends on the shape of the Lorenz curves. If the distribution with a smaller
coefcient lies entirely within the other, then the conclusion about relative inequality
is unequivocal. If the curves cross each other, then the inequalities differ only over
parts of the range of these distributions.
2.2.4 in D i C A t o r s
Two methods were used to generate two suites of indicators. Communities, through
a participatory process facilitated by the researchers, developed the rst set suite.
Researchers and the multidisciplinary team developed the second suite using descrip-
tions given by the communities in the initial workshop and in the loop diagrams.
Details of the process and methods used are presented in Chapter 6, Section 6.2.
2.2.4.1 Community-Driven Indicators
The objective for the community-driven indicators was to develop a suite of indica-
tors that the communities can use to assess the health and sustainability of their
agroecosystem. The indicators were developed in two stages. First, discussions were
initiated among communities during leadership training programs with regard to the
AESH concept and the ideas of monitoring and evaluation. Three-day workshops
were then held in each of the six villages; the indicators were developed at these
workshops. Participatory tools such as focus group discussions, scoring matrices,
and trend analyses were used to identify, rank, and then categorize indicators. Fur-
ther details on the participatory methods used are provided in Chapter 3.
2.2.4.2 Selection of Research-Based Indicators
For research-based indicators, the objective was to develop a suite of indicators for
use by researchers and policymakers. It was assumed that this suite of indicators
would be complementary to the community-driven suite. Indicators were dened
as variables that reect (1) changes in key system attributes or (2) changes in the
© 2009 by Taylor & Francis Group, LLC
Design and Implementation of an Adaptive, Integrated Approach 33
degree of risk or potential of the system. Indicators were selected based on the ease
of measurement and interpretation, validity, cost-effectiveness, and usefulness of the
information gathered to researchers and policymakers. Further details are provided
in Chapter 6.
2.2.5 mo n i t o r i n g , ev A l u A t i o n , A n D As s e s s m e n t
2.2.5.1 Community-Based Assessments
Participatory monitoring, evaluation, and assessments were carried out in ISSs only.
This was based on the assumption that self-monitoring provides communities with
information that is crucial to the successful management of the agroecosystem. It was
also assumed that self-evaluation would create a sense of ownership of the process by
the communities, and that this would enhance their participation, thereby increasing
the sustainability of the process. By understanding how communities evaluated infor-
mation gathered using indicators, it was hoped that researchers would gain insight on
how indicators can be analyzed to be of use in practical decision making.
Monitoring was taken to mean the evaluation of indicators on a daily or weekly
basis to provide information on the progress of specic community activities. Such
information would be used for short-term management and decision making. Evalua-
tion was dened as a review of goals and objectives against achievements. This would
occur after completion of specic activities or attainment of predened milestones.
Evaluation could also be done regularly after a dened period to evaluate progress
toward overall community goals. Assessment was dened as an overall review of the
agroecosystem status in terms of health and sustainability using selected indicators.
2.2.5.2 Research-Based Assessments
Research-based assessments were carried out in all 12 study sites in February 1998
and again in February 1999. Empirical data on research-based indicators were gath-
ered using both conventional research methods and participatory tools. A question-
naire (Appendix 2) was developed and applied to each of the land-use units in each
of the 12 study sites. Process and methods used are discussed in Chapter 6.
2.2.6 im p l e m e n t A t i o n o f in t e r v e n t i o n s
The objectives were to reinforce the communities’ capacity for collective remedial
action. The underlying assumption was that health and sustainability depended on
the communities’ ability to design appropriate remedial actions and to implement
them successfully. Community participation was seen to be the key to the sustain-
ability of the process. Two types of interventions were therefore envisaged. The rst
was to impart analytical, management, and participatory skills to the communities
to enhance their capacity for problem identication and analyses, consensus build-
ing, conict resolution, action planning, monitoring, evaluation, and assessment.
The second type of intervention was to provide expertise and support geared toward
facilitating communities in the implementation their action plans.
© 2009 by Taylor & Francis Group, LLC
34 Integrated Assessment of Health and Sustainability of Agroecosystems
2.2.6.1 Community Training
Training programs were organized in each of the six ISSs and at the district level. Vil-
lage AESH committee members, some opinion leaders, and 6–10 people from the ISSs
were trained on participatory approaches, management methods, community mobili-
zation, gender issues, community-based leadership, action planning, monitoring, and
evaluation. Experts from the various disciplines were invited to conduct training in
each of the specialized areas. Focus group discussions were held after each topic. The
experts then addressed specic issues arising from these discussions. Leaders in each
of the ISSs were encouraged to hold monthly village meetings to discuss, in a partici-
patory manner, their agroecosystem sustainability and health concerns.
2.2.6.2 Community-Based Development Interventions
Leaders in each of the ISSs were provided with copies of the action plans developed
in the participatory workshops. The research team facilitated meetings among the
community leaders in each village and between them and other institutions to discuss
the implementation of action plans and to institute measures for better management
of their agroecosystem. The leaders were expected to initiate participatory processes
to develop activity schedules, delegate duties, monitor progress, and evaluate the
progress of individual projects.
The implementation of the action plans was the responsibility of the communi-
ties. In addition, the communities were expected to supply all the resources needed
to carry out the required interventions. The role of the research team was to identify
experts, resource persons, or institutions that the communities might need for success-
ful implementation of a project. If the resources needed for a project were more than
the communities could generate from within, information and skills (e.g., proposal
writing) for seeking support from the government, nongovernmental organizations,
and other development agencies were provided. However, communities were requested
to show how such a project would be sustained after the donor support ceased.
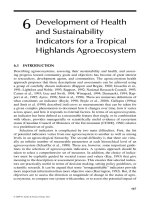
2.3 RESULTS
Figure 2.2 shows the relative size and location of Kiambu district. Change in altitude
(in units of 200 m starting from sea level) is also shown to illustrate the location
and extent of the highlands. The geographical distribution of the study sites within
Kiambu district and the relative size of the divisions are illustrated in Figure 2.3. The
boundaries of the newly created Tigoni Division were yet to be properly documented
by the time of this study.
Communities in all selected study sites agreed to participate. Community partic-
ipation was high, with 75% to 100% of the households and homesteads represented
in all the participatory workshops held in the study sites. The concept of AESH was
well understood by the stakeholders as evidenced by use of the health language and
concepts during the participatory workshops.
© 2009 by Taylor & Francis Group, LLC
Design and Implementation of an Adaptive, Integrated Approach 35
+
VILLAGES
DIVISION
Githunguri
Kiambaa
Kikuyu
Lari
Limuru
Tigoni
+
+
+
+
6
6
6
6
6
+
6
INTENSIVE
EXTENSIVE
iririka
Kihenjo
Gikabu
Redhill
Githima
Gitwe
Kameria
Gakinduri
Makindi
Muongoiyia
Kiawanagira
Gitangu
+
6
FIGURE 2.3 Map of Kiambu showing the administrative divisions and the locations of
intensive and extensive study sites. See CD for color image.
KENYA
ETHIOPIA
TANZANIA
UGANDA
SOMALIA
FIGURE 2.2 Map of Kenya showing the location and relative size of Kiambu district and
the highlands. See CD for color image.
© 2009 by Taylor & Francis Group, LLC
36 Integrated Assessment of Health and Sustainability of Agroecosystems
2.3.1 ho l A r C h i C A l sC A l e s
The biophysical holarchy is best described in terms of ve layers (Figure 2.4).
The innermost or smallest layer—the eld—was dened mostly by management
char acteristics. The layer after the eld was the farm. Farms were dened mostly
by land-use characteristics and were perceived as nested within catchments (a term
commonly used by soil conservation ofcers in the district). The latter were dened
mostly by topographical (valley, ridge, plain, etc.) characteristics. Catchments cor-
responded, in many instances, to the villages dened in the human activity holarchy.
Catchments were seen as nested within agroecozones as described by Jaetzold and
Schmidt (1983). Agricultural potential, vegetation, and geologic and climatic factors
dened the boundaries of agroecozones. Kiambu is within the central highlands
geoclimatic zone and comprises four major agroecozones (Figure 2.4).
The human activity holarchy was conuent with the administrative zoning of
Kiambu district. The district is divided into six administrative zones called divi-
sions (Limuru, Kikuyu, Lari, Tigoni, Githunguri, and Kiambaa). Each division is
further subdivided into several locations, which are in turn divided into sublocations
(Figure 2.4). The latter is the lowest formal administrative unit. According to the
key informants and administrative ofcials, each sublocation may consist of one to
four villages with informal boundaries, but consisting of groups of people who work
FIGURE 2.4 An illustration of the holarchical structure of the Kiambu agroecosystem from
both the biophysical and the human activity perspectives. GOK, Government of Kenya. See
CD for color image.
BIOPHYSICAL SYSTEM HUMAN ACTIVITY SYSTEM
POLICY
AND
MANAGEMENT
HOLARCHY BOUNDARIES TYPES
HOLARCHY
GEO-CLIMATIC
ZONE
AGROECOZONE
CATCHMENT
-GEOLOGY
-CLIMATE
-VEGETATION
-
AGRIC. POTENTIAL
-ARID AND SEMI-ARID
-CENTRAL HIGHLANDS
-COASTAL REGION
-LAKE BASIN
-FOREST ZONE
-TEA-DAIRY ZONE
-COFFEE-TEA ZONE
-MARGINAL ZONE
GEOGRAPHIC
AND CLIMATIC
FEATURES
FARM
FIELD
LAND USE
MANAGEMENT
GOK
PROVINCIAL
ADMIN.
DISTRICT
ADMIN.
DIVISIONAL
OFFICE
CHIEF
SUBCHIEF
HEADMAN
FARMER
NATION
PROVINCE
DISTRICT
DIVISION
LOCATION
SUBLOCATION
VILLAGE
FARM
© 2009 by Taylor & Francis Group, LLC
Design and Implementation of an Adaptive, Integrated Approach 37
together as a unit. Village boundaries are dened through different criteria, including
topographical features. It is possible for villages to lie across administrative boundar-
ies. Secondary data listing villages or describing their boundaries could not be found.
Within homesteads and households, systems of management dene several farm
enterprises, comprising the lowest rung of the human activity holarchy. For health and
sustainability management of the Kiambu agroecosystem, the village level and the
household level were selected as the most appropriate scales for AESH management.
2.3.2 st u D y si t e s
Participatory mapping conrmed the presence of villages as a layer nested within the
sublocation in the human activity holarchy. Sociocultural factors were more impor-
tant in dening the boundaries of the villages. Communities regarded themselves as
belonging to one of these villages, with various sociocultural institutions organized
and functioning at this level.
Githima village has boundaries that are conuent with administrative ones. The
village is described as the area under the administrative jurisdiction of the assistant
chief. Another identity factor was the use of two coffee-processing factories and
three tea-buying centers in the area. People settled in the village prior to 1952, clear-
ing an indigenous wattle tree forest.
Gitangu village derives its identity partly from its historical background (area
inhabited by three subclans) and from administrative boundaries (area under an
assistant chief). The area is an indigenous forest occupied by hunter-gatherers.
Settlement by the current tribe began before the arrival of Europeans. The three
subclans (Mbari-ya-igi, Mbari-ya-Gichamu, and Mbari-ya-Ngoru) derive from the
three people who rst settled in the area.
Deriving its identity from its geophysical location (a swampy valley bounded
by roads and railway) and its sociocultural history, Kiawamagira is inhabited by
descendants of squatters in the Church Missionary Society Mission in Thogoto.
Elders claimed that during the land demarcation process, those squatters who were
not considered favorably by the mission were allocated land in the valley.
Mahindi village lies on a ridge between two streams and is inhabited by mem-
bers of the Kihara subclan. The name of the village refers to the elephant skeletons
found on the ridge. Settlement started in the 1950s. The boundaries of Gikabu-na-
Buti village of Tigoni Division are socioeconomic. The village adjoins another, and
both are sandwiched within two vast tea estates. The land was part of one of the tea
estates and was sold to a cooperative of its laborers. Settlement began in 1972. Itungi
village consists of 4-acre land parcels, while Gikabu-na-Buti village consists entirely
of half-acre plots, thereby creating a socioeconomic subdivision within what seems
to be a single village. During the initial mapping exercise, participants indicated
that they were one village. In subsequent meetings, it was revealed that the two are
disparate with very few interactions between them. The sixth village, Thiririka, was
described as the area under the administrative jurisdiction of an assistant chief. This
was part of Kinale forest until 1989, when land was allocated to settle squatters from
various forests in the district.
© 2009 by Taylor & Francis Group, LLC
38 Integrated Assessment of Health and Sustainability of Agroecosystems
2.3.3 sy s t e m i C De s C r i p t i o n
Gitau (1997) provided a detailed description of the information gathered during the
initial village workshops. This includes descriptions of natural resources, historical
background, social structure, typology of farms, trends, human health, seasonal cal-
endars, felt needs, and coping strategies by communities living in the six ISSs.
2.3.3.1 Demographic Features
Table 2.2 gives a summary of key demographic features of the six ISSs based on a
census of land-use units. The Githima study site had the highest number of land-
use units (229), followed by Gitangu. Kiawamagira and Mahindi had the fewest
(41 and 40, respectively). The mean acreage per land-use unit was highest in Thiririka
(3.5 acres), followed by Mahindi (2.7 acres) and Githima (2.3 acres). Kiawamagira
and Gikabu had the least (1.8 and 1.9, respectively). In terms of total size, Thiririka
is the largest in land size, covering approximately 3 km
2
and having several publicly
owned parcels of land. Mahindi and Kiawamagira are the smallest in size, covering
approximately 0.5 km
2
each. There were areas in Kiawamagira left as public land
due to swamping.
In all villages, there were land-use units that consisted of more than one house-
hold (Table 2.2). These were more common in Githima (23) and Gitangu (19) and
least common in Mahindi and Kiawamagira (1 and 6, respectively). Nearly half
(43.9%) of the households in Kiawamagira were female headed. The majority of the
households in Gikabu (63.9%) and Kiawamagira (53.7%) were managed by females.
The majority of households in Mahindi (67.5%) and Gikabu (57.8%) had off-farm
income. The average number of people per household was highest in Thiririka
(8 persons), followed by Mahindi, and the fewest people were in Githima households
(5.6 persons). Mahindi had the highest number (2.5) of people with off-farm employ-
ment per household, followed by Gikabu (1.5) and Kiawamagira (1.4), while Githima
had the fewest (0.3).
2.3.3.2 Geoclimatic Features
According to the agroecological classication by Jaetzold and Schmidt (1983),
Thiririka village lies in the forest reserve zone (Upper Highlands; UH0 in Figure
2.5) as shown in Figure 2.5. Githima village lies in the coffee-tea zone (upper mid-
lands; UM1). Mahindi and Kiawamagira villages lie in the marginal coffee zone
(upper midlands; UM3). The other two villages are on the lower highlands (LH)
zones: Gitangu in the wheat-maize-pyrethrum zone (LH2) and Gikabu in the tea-
dairy zone (LH1).
2.3.3.3 Resource Use and Distribution
Off-farm employment, small ruminants, and income from various farming enter-
prises were the most unevenly distributed. Gini coefcients were 0.72 for off-farm
employment, 0.28 for population, 0.41 for farm land, 0.43 for cattle, 0.69 for sheep
and goats, 0.64 for income from cash crops, 0.53 for income from food crops, and
© 2009 by Taylor & Francis Group, LLC
Design and Implementation of an Adaptive, Integrated Approach 39
0.54 for income from livestock. Population was evenly distributed in all six villages,
as were farmland and cattle (Table 2.3).
In Mahindi, all eight resources considered were equitably distributed. In Kia-
wamagira, only off-farm employment was markedly uneven, while in Gikabu it was
only income from food crops. Off-farm employment was most unevenly distrib-
uted in Githima (Figure 2.6), while sheep and goats were unevenly distributed by
TABLE 2.2
Summary of Key Demographic Features Based on a 1997 Census of Land-Use
Units in the Intensive Study Site, Kiambu District, Kenya
Githima Gitangu Mahindi Thiririka Kiawamagira Gikabu
Division Githunguri Limuru Kiambaa Lari Kikuyu Tigoni
Approximate
size of village
(km
2
)
2 2 0.5 3 0.5 1
Number of
land-use units
229 224 40 188 41 83
Mean acreage
per unit
2.3 ± 0.17 2.1 ± 0.12 2.7 ± 0.34 3.5 ± 0.14 1.8 ± 0.21 1.9 ± 0.19
Units with
more than one
household
23 19 1 9 6 15
Number of
households
304 296 41 230 62 147
Proportion of
female-headed
households
22.7% 18.8% 30.0% 17.0% 43.9% 27.7%
Proportion of
female
managed
households
31.9% 46.4% 50.0% 32.4% 53.7% 63.9%
Proportion of
households
with off-farm
income
14.8% 37.5% 67.5% 29.8% 36.6% 57.8%
Mean number
of people per
household
5.6 ± 0.25 6.1 ± 0.22 7.8 ± 0.6 8.0 ± 0.35 7.3 ± 1.0 7.0 ± 0.36
Mean off-farm
employed per
household
0.3 ± 0.06 0.8 ± 0.10 2.5 ± 0.4 0.6 ± 0.09 1.4 ± 0.35 1.5 ± 0.20
Mean number
going to
school per
household
2.3 ± 0.12 2.7+0.15 1.7 ± 0.28 2.8 ± 0.15 2.24 ± 0.31 2.5 ± 0.24
© 2009 by Taylor & Francis Group, LLC
40 Integrated Assessment of Health and Sustainability of Agroecosystems
about the same magnitude in Githima, Gitangu, and Gikabu (Figure 2.7). Income
from food crops was the most inequitable in Githima (Figure 2.8), in contrast to
Thiririka, where income from cash crops (coffee and tea) was the most inequitable
(Figure 2.9).
Figure 2.10 shows the proportion of land under various crops in the six ISSs
based on the 1997 census of land-use units. For each village, the proportion of land
under each enterprise was calculated as the average of the per farm proportion. Most
(36.44%) of the farmland in Githima village was allocated to coffee. In Kiawamagira
village, most (49.70%) of the land was under food crops. In Thiririka, nearly 50%
of farmland was left fallow or as pasture. Gitangu village had the highest (17.39%)
proportion of land allocation to fodder (mostly Napier) among the six villages (Gik-
abu 9.18%; Githima 6.52%; Kiawamagira 7.72%; Mahindi 12.58%; and Thiririka
0.52%). In addition, the land allocated to noncrop activities (other) was proportion-
ately bigger because of space used for housing livestock and paddocks. Horticultural
crops had the biggest proportion of farmland in Thiririka village.
Figure 2.11 shows the location of public medical facilities in Kiambu district
relative to both ISSs and ESSs. Of the ISSs, only Thiririka and Mahindi were close
to a public health facility (within 1-km radius of the village; closest facility for other
iririka
AEZONE
LH1
LH2
LH3
LH4
LH5
UH1
UH2
UH0
UM1
UM2
UM3
UM4
UM5
+
Kihenjo
Gikabu
Gitangu
Redhill
Githina
VILLAGES
Gitwe
Kameria
Gakinduri
Makindi
Muongoiyia
Kiawanagira
6
6
6
6
6
6
+
+
+
+
+
6
INTENSIVE
EXTENSIVE
FIGURE 2.5 Map of Kiambu showing the distribution of study sites by agroecozones as
described by Jaetzold and Schmidt (1983). LH, lower highlands; UH, upper highlands; UM,
upper midlands. See CD for color image.
© 2009 by Taylor & Francis Group, LLC
Design and Implementation of an Adaptive, Integrated Approach 41
villages was 10 km). Private health facilities, however, were available within Gikabu,
Kiawamagira, and Githima villages.
The distribution of water supply schemes in the district relative to the study sites
and major urban centers is shown in Figure 2.12. Among the ISSs, only Githima,
Kiawamagira, and Gitangu were located within areas covered by a water supply
scheme. At the time of this study, Komothai water scheme (covering Githima study
TABLE 2.3
Equity, Measured by the Gini Coefficient, of Key Resources in the Intensive
Study Site, Kiambu District, 1997
a
Resource Githima Gitangu Mahindi Thiririka Kiawamagira Gikabu
Off-farm employment 0.72 0.61 0.43 0.68 0.53 0.35
Population 0.26 0.25 0.18 0.29 0.14 0.22
Farm land 0.44 0.35 0.23 0.27 0.28 0.40
Cattle 0.44 0.39 0.38 0.39 0.40 0.34
Sheep and goats 0.70 0.66 0.45 0.54 0.34 0.61
Income from cash
crops
0.54 0.09 0.00 0.42 0.00 0.32
Income from food
crops
0.56 0.47 0.31 0.48 0.26 0.52
Income from livestock 0.44 0.40 0.15 0.66 0.20 0.43
a
Gini coefcients were calculated using the method described by Casley and Lury (1982) as (T1-T2)/
10,000 where T1 is the sum of the cross-products of cumulative percentage of land-use units and lagged
cumulative percentage of the resource. T2 is the sum of the cross-product of lagged cumulative percent-
age of land-use units and cumulative percentage of the resource.
Farms (Cumulative %)
Off-farm employment (Cumulative %)
100806040200
100
80
60
40
20
0
Githima
Gikabu
Mahindi
Gitangu
iririka
Kiawamagira
FIGURE 2.6 Lorenz curve showing the distribution of off-farm employment in the inten-
sive study site, Kiambu District, Kenya, 1997. See CD for color image.
© 2009 by Taylor & Francis Group, LLC
42 Integrated Assessment of Health and Sustainability of Agroecosystems
site) was not operational, reportedly because of silting of the main dam. The Ngecha
water scheme, covering Gitangu village, was also not operational following theft of
the pumping equipment. In both cases, the water supply infrastructure (pipes and
tanks) was still present but in a state of disrepair.
2.3.3.4 Agriculture
The main agricultural products in Githima were coffee and tea, while in Gitangu,
Mahindi, Thiririka, and Kikuyu they were dairy and vegetables. In Gikabu, the
Farms (Cumulative %)
Off-farm employment
Cattle
Income from food crops
Population
Sheep and goats
Income from livestock
Farmland
Income from cash crops
Resource (Cumulative %)
100806040200
100
80
60
40
20
0
FIGURE 2.8 Lorenz curves of eight key resources in Githima intensive study site, Kiambu
District, Kenya, 1997. See CD for color image.
Farms (Cumulative %)
Sheep and Goats (Cumulative %)
100806040200
100
80
60
40
20
0
Githima
Mahindi Kiawamagira
Gikabu
Gitangu
iririka
V
V
V
V
V
V
V
V
FIGURE 2.7 Lorenz curve showing the distribution of sheep and goats in all intensive study
sites, Kiambu District, Kenya, 1997. See CD for color image.
© 2009 by Taylor & Francis Group, LLC
Design and Implementation of an Adaptive, Integrated Approach 43
main products were tea and dairy. Thus, only Githima, Thiririka, and Gikabu had
agricultural activities conuent with their agroecological classication. The other
three villages were mainly focusing on dairy and horticultural vegetable production,
irrespective of their agroecological classication. Little or no pyrethrum was being
Farms (Cumulative %)
Off-farm employment
Cattle
Income from food crops
Population
Sheep and goats
Income from livestock
Farmland
Income from cash crops
Resource (Cumulative %)
100806040200
100
80
60
40
20
0
FIGURE 2.9 Lorenz curves of eight key resources in Thiririka intensive study site, Kiambu
District, Kenya, 1997. See CD for color image.
100
90
80
70
60
50
40
30
20
10
0
Githima
Food Crops CoffeeTea Napier
Other
Horticulture
MahindiKiawamagira
Gikabu
Gitangu
iririka
FIGURE 2.10 Allocation of land resource to various crops in the intensive study site (ISS)
Kiambu district, 1997. For each village, the average per-farm acreage of a crop was expressed
as a percentage of the average farm size in that village. See CD for color image.
© 2009 by Taylor & Francis Group, LLC
44 Integrated Assessment of Health and Sustainability of Agroecosystems
produced in Gitangu village, and there was no coffee production at all in Kiawama-
gira. There were a few farmers in Mahindi village who had coffee, but they had not
had a harvest for 10 years. The reason given was that coffee was not protable to
produce in this village.
A comparison of the relative importance of the three main farm enterprises
(cash crop, food crop, and livestock), based on their contribution to the annual farm
income, is shown in Figure 2.13. Proportions were computed for each farm and then
averaged for each village. Most (84.88%) of the farm income in Githima village
came from traditional cash crops (coffee and tea), while that in Mahindi (62.67%)
came from the sale of surplus food crops (maize, beans, potatoes, kale). In Thiririka,
farm income was mainly (57.09%) from sale of horticultural produce, especially
vegetables. Farm income in Gikabu was balanced among tea, dairy, and food crops
(especially kale). Livestock were the major (77.87%) contributors to farm income in
Gitangu village and contributed an important proportion (35.42%) of it in Kiawama-
gira. Annual farm income was highest in Githima village, followed by Gitangu,
while it was lowest in Mahindi, followed by Kiawamagira (Figure 2.14). In contrast,
income per acre of land was highest in Githima, followed by Kiawamagira. It was
lowest in Mahindi and Thiririka villages.
FIGURE 2.11 Map of Kiambu showing the distribution of medical facilities. See CD for
color image.
+
+
+
+
+
+
+
VILLAGES
DIVISION
Medical Ty pe
Githunguri
Kiambaa
Kikuyu
Lari
Limuru
Tigoni
Dispensary
Government health center
Government hospital
Private hospital
6
6
6
6
6
INTENSIVE
EXTENSIVE
iririka
Kihenjo
Gikabu
Githima
Gitwe
Kameria
Gakinduri
Makindi
Muongoiyia
Kiawanagira
Gitangu
6
Redhill
6
© 2009 by Taylor & Francis Group, LLC
Design and Implementation of an Adaptive, Integrated Approach 45
Table 2.4 shows the agricultural products, inputs, and crop and animal diseases
in each of the six villages. Githima, Thiririka, and Gikabu reported herbicides as
one of the major external inputs for their villages in terms of quantity and expen-
diture. Fertilizer was considered an important input in all villages, but it was relied
on heavily only in Githima and Thiririka villages. Farmers classied farm enter-
prises as livestock (Mahiü), food crops (irio), and nonfood (cash) crops. The livestock
enterprise was further classied as commercial poultry, cattle, and small ruminants
(mbüri) and local chicken. Food crops were further distinguished by whether they
were mainly for consumption within the farm (subsistence) or for sale. Food crops
grown for subsistence were mostly maize, beans, potatoes, and peas. Food crops
grown mainly for the market were vegetables, especially kale (horticulture). Different
cash crop enterprises (coffee, tea, and pyrethrum) were always specied and consid-
ered separate. The farmers’ choice of enterprises was governed mostly by the tradi-
tion in the area, experience of the manager, availability of resources, availability of
market for the produce, and the potential yield of the enterprise.
Horticulture was considered the most important in terms of income in all vil-
lages except Githima. The main crop produced was kale (Sukumawiki), which has
FIGURE 2.12 Map of Kiambu District showing the coverage of different water supply
schemes. See CD for color image.
+
+
+
+
+
+
+
VILLAGES
WATER SUPPL
Y
DIVISION
Githunguri
Kiambaa
Kikuyu
Lari
Limuru
Tigoni
6
6
6
6
6
6
6
INTENSIVE
EXTENSIVE
iririka
Kihenjo
Gikabu
Redhill
Githima
Gitwe
Kameria
Gakinduri
Makindi
Muongoiyia
Kiawanagira
Gitangu
© 2009 by Taylor & Francis Group, LLC
46 Integrated Assessment of Health and Sustainability of Agroecosystems
a ready market in Nairobi. The capital outlay was minimal, and return to labor was
considered high. The limitations were seen to be transportation and soil fertility.
Yield was high during the rainy season, but the villages are not accessible during this
time, so most of the produce goes to waste. Disease and pests are also an important
100
90
80
70
60
50
40
30
20
10
0
Githima
Food CropsCash Crops Livestock
MahindiKiawamagiraGikabu Gitanguiririka
FIGURE 2.13 A comparison of the relative importance of the three main farm enterprises
based on their contribution to annual total farm income. Proportion of annual income from
each enterprise was computed per farm and then averaged by village. See CD for color
image.
30000
25000
20000
15000
10000
5000
0
14000
12000
10000
8000
6000
4000
2000
0
Githima
To tal farm income (Y1) Income per acre (Y1)
MahindiKiawamagiraGikabu
Total farm income
Income per acre
Gitanguiririka
FIGURE 2.14 Comparison of the annual farm incomes in the six intensive study sites. Total
farm income was calculated as all sales for 1997 minus all farm-related costs except casual
and household labor. Income per acre was calculated as the annual farm income divided by
the farm size (in acres). See CD for color image.
© 2009 by Taylor & Francis Group, LLC
Design and Implementation of an Adaptive, Integrated Approach 47
TABLE 2.4
The Main Products, Inputs, Crop Pests, and Livestock Diseases Reported by
Farmers in Farm Censuses Carried Out in the Intensive Study Sites
Githima Mahindi Thiririka Gikabu Gitangu Kiawamagira
Food crops
(mainly for
home
consumption)
Maize
Beans
Potatoes
Arrowroots
Yams
Bananas
Maize
Beans
Potatoes
Arrow roots
Bananas
Maize
Beans
Maize
Beans
Potatoes
Arrowroot
Peas
Maize
Beans
Potatoes
Peas
Banana
Maize
Beans
Potatoes
Arrowroots
Bananas
Cash crops Coffee
Tea
Tea Pyrethrum
Horticulture Kale
Tomatoes
Kale
Celery
Flowers
Sugar cane
Potatoes
Kale
Carrots
Peas
Onions
Pears
Kale
Pears
Onion
Plums
Kale
Flowers
Oranges
Carrots
Avocado
Coriander
Mangoes
Avocados
Livestock Cattle
Sheep
Goats
Cattle
Sheep
Goats
Poultry
Cattle
Sheep
Cattle
Sheep
Poultry
Cattle
Sheep
Donkey
Cattle
Sheep
Goats
Fodder Napier Napier Napier
Oats
Pasture
Napier Napier
Crop residue
Napier
External
inputs
Fertilizer
Manure
Herbicides
Feed
Manure
Seeds
Fertilizer
Feed
Herbicides
Fertilizer
Seeds
Feed
Rent
tractor
Herbicides
Fertilizer
Feed
Feed
Seeds
Manure
Feeds
Manure
Herbicides
Fertilizer
Labor Casual
Family
Family Casuals
Family
Permanent
Casual
Family
Permanent
Casual
Family
Family
Crop and
livestock
diseases and
pests
Coffee BD
FMD
Milk fever
Pneumonia
Moles
Hedgehogs
Blight
Aphids
Mastitis
Worms
ECF
Blight
Aphids
Frost
Foot rot
Mastitis
Pneumonia
Moles
Hedgehogs
Stock borer
Bacterial wilt
Mastitis
Milk fever
ECF
Blight
Moles
Hedgehogs
Gumboro
Ndigana
Bacterial wilt
Blight
Stock borer
Weevils
Off-farm
activities
Employment
Hawking
Business Employment
Business
Employment Business
Employment
BD, Berry Disease; FMD, Foot and Mouth Disease; ECF, East Coast Fever
© 2009 by Taylor & Francis Group, LLC
48 Integrated Assessment of Health and Sustainability of Agroecosystems
consideration in kale production. Farmers were conscious of the environmental and
health impacts of chemical control.
2.3.3.5 Agroecosystem Health Goals
2.3.3.5.1 Participatory Method
Details of problems and concerns—as identied and prioritized by participants in
the village workshops—are given in Chapter 3. Concerns common to all ISSs were
availability of water for domestic use, poor roads, poor human health, and absence
of health care facilities. Only one village (Kiawamagira) had access to piped water,
and even then, the water was available for one half-day per week. Roads were mainly
loose surface, becoming impassable during the wet season. Due to the hilly terrain
of the Kiambu agroecosystem, ooding and gully formation are the biggest causes of
poor road condition. Among the agriculture-related problems were lack of articial
insemination services, low crop yields, poor soil productivity, lack of markets for
produce, lack of extension services, and crop and animal diseases.
According to the participants, the main limitation to crop production in these
villages was land size, but climate and market (price) were also important. Limita-
tion to dairy production was seen to be mainly capital and feed-related constraints.
Food crop production was reported as limited mainly by soil fertility, which in turn
is a consequence mainly of soil erosion and depletion of nutrients. Poultry produc-
tion was reported as severely limited not only by diseases, especially Gumboro and
Newcastle, but also by market for eggs and meat. In terms of livestock, dairy cattle
were given a higher preference to small ruminants and poultry since the milk market
is available, and the returns were said to be higher. In all ISSs, consensus on needs
and goals was achieved. Committees of local participants were selected to oversee
the implementation of the action plans.
2.3.3.5.2 Survey Method
In the land-use unit survey, 35.3% of the respondents reported lack of extension
services as a constraint to productivity (Table 2.5). In contrast, 33.8% of the farmers
reported soil infertility as a constraint; land size was a constraint for 14.4% of the
TABLE 2.5
Constraints to Productivity as Reported by Respondents in a Survey
of Land-Use Units in the Six Intensive Survey Sites
Small
Farm Size
Soil
Infertility
Inadequate
Extension
Lack of
Labor
Lack of
Capital Flooding
Githima (% of 229 units) 23.1 70.3 48.9 3.1 14.8 0.0
Mahindi (% of 40 units) 22.5 52.5 47.5 10.0 0.0 0.0
Thiririka (% of 188 units) 7.4 27.1 31.4 1.1 3.2 14.9
Gikabu (% of 83 units) 15.7 21.7 28.9 4.8 8.4 0.0
Gitangu (% of 224 units) 7.6 4.9 25.0 17.9 0.9 0.0
Kiawamagira (% of 41 units) 24.4 24.4 34.1 2.4 0.0 7.3
Overall (% of 805 units) 14.4 33.8 35.3 2.2 6.1 3.9
© 2009 by Taylor & Francis Group, LLC
Design and Implementation of an Adaptive, Integrated Approach 49
respondents. Soil infertility was a more common problem in Githima (23.1%) and
Mahindi (22.5%) villages. Githima (14.8%) village had more respondents reporting
lack of capital than in other villages. Flooding and waterlogging was reported only
in Thiririka and Kiawamagira villages.
Nearly all the respondents (96.3%) indicated that they would like to improve
farm productivity, whether by starting new enterprises or improving existing ones
(Table 2.6). The majority of respondents not willing to improve farm productiv-
ity were in Gikabu (11/30) and Thiririka (12/30) villages. Most of the respondents
reported that they would prefer to improve livestock (mainly dairy) production and
horticulture. In Githima village, most respondents reported that they preferred to
enhance cash crop (tea or coffee) production compared to all the other options.
2.3.4 he A l t h A n D su s t A i n A b i l i t y As s e s s m e n t
Communities understood the concepts of health and health indicators and accepted
the notion of using indicators to evaluate the status of their agroecosystem. They
appeared to regard the approach not as an innovation, but as a revisiting and mod-
ernization of traditional methods of agroecosystem management.
Communities in the ISSs opted to carry out agroecosystem evaluations and assess-
ments jointly with other ISSs. The communities initiated intervillage collaboration
because they felt that participants from other study sites provided additional useful
criticism and suggestions compared to those by the researchers and extension agents.
2.3.5 im p l e m e n t A t i o n o f in t e r v e n t i o n s
At the end of the initial village workshops, all communities expressed a profound
demand for action to ameliorate the problems identied. Formation of the village
committees was seen as evidence of their desire to implement the action plans. Five
of the six villages proceeded with implementation of the action plans immediately
after the workshops, mostly without further contact or consultation with the research
team. In nearly all the cases, this led to some degree of frustration on the part of
the communities as they were ill prepared in terms of organization and community
leadership to carry out many of the tasks. However, there were some successes, and
failure and frustration did not deter most of the communities from continuing to try.
Further details are provided in Chapter 3. Details on the methods used to facilitate
planning and implementation of action plans by the communities are provided in
Chapter 4.
2.4 DISCUSSION
2.4.1 h
o l A r C h i C A l sC A l e
There were two reasons why the village was selected as the target level for this study.
Foremost of these is that at the village/catchment level, ecological, economic, and
social factors are integrated, resulting in unique emergent properties. Second, trade-
offs among farms within a village are essential factors in the sustainability of agri-
culture in the entire Kiambu ecosystem. The land-use level was selected because it is
© 2009 by Taylor & Francis Group, LLC