Radionuclide Concentrations in Foor and the Environment - Chapter 3 pdf
Bạn đang xem bản rút gọn của tài liệu. Xem và tải ngay bản đầy đủ của tài liệu tại đây (2.3 MB, 21 trang )
37
3
Radioactivity in the Air
Peter Carny
CONTENTS
3.1 Cosmic Rays 37
3.2 Cosmogenic Radionuclides 38
3.3 Terrestrial Radiation 38
3.3.1 Terrestrial Radiation: Radon and Decay Products in the Air
and Other Radionuclides That Can Be Inhaled 38
3.3.2 Terrestrial Radionuclides in the Air Due to Industrial Activities
(Other Than Nuclear Energy) 41
3.3.3 Summary: Airborne Activity Due to Natural Radiation Sources 42
3.4 Man-Made Radionuclides in the Air 43
3.4.1 Man-Made Radionuclides in the Air Due to Nuclear Weapons
Tests and Production 43
3.4.2 Man-Made Radionuclides in the Air Due to Electricity
Generation in Nuclear Power Plants: Fuel Production and
Operation of Nuclear Power Plants 44
3.4.3 Man-Made Radioactivity in the Air in Case of Nuclear
Accident 46
References 57
3.1 COSMIC RAYS
Cosmic radiation contributes to a great extent to the total radiation exposure of
human beings. This radiation has its origins in outer space; one component
(protons with energies ~100 MeV) is generated by the Sun, all other components
are primarily from our galaxy, and the origin of some high-energy protons (with
energies ~10
19
eV) is probably extragalactic.
Cosmic rays enter our atmosphere as protons,
α
particles, heavier nuclei, and
electrons. These cosmic particles have an energy from 10
8
eV to greater than
10
20
eV. After their interaction with atoms and molecules in the atmosphere, a lot
of secondary charged and uncharged particles are generated: protons, neutrons,
pions, nuclei with lower
Z
values, and further nucleonic cascades, electrons, muons,
and photons. Exposure from cosmic rays at ground level is primarily from muons,
electrons, photons, and neutrons. This exposure is realized as external exposure.
The intensity of cosmic rays and the dose absorbed depends on the layer of the
atmosphere above the ground; in other words, it quite strongly depends on the
DK594X_book.fm Page 37 Tuesday, June 6, 2006 9:53 AM
© 2007 by Taylor & Francis Group, LLC
38
Radionuclide Concentrations in Food and the Environment
altitude and on geographic latitude. The thicker the layer of atmosphere, the lower
the absorbed dose. At sea level, the typical annual effective dose due to cosmic
rays is about 350 µSv/year (from this, 80 µSv/year is typically due to neutrons).
According to the United Nations Scientific Committee on the Effects of Atomic
Radiation (UNSCEAR) [1], the world average (altitude and latitude averaged)
annual effective dose due to cosmic rays is about 460 µSv/year (from this 120
µSv/year is due to neutrons). People living at altitudes of 2 to 3 km above the sea
level could obtain an annual effective dose from cosmic rays of up to 2000 µSv/year.
3.2 COSMOGENIC RADIONUCLIDES
Radioactivity in air due to cosmic radiation is a source of external irradiation of
human beings as well as internal irradiation. Internal irradiation is caused by
cosmogenic radionuclides present in the air. Cosmogenic radionuclides are products
of cosmic ray interactions in the atmosphere. As a result of these interactions, many
lower
Z
nuclei are created. The most important cosmogenic nuclei are
3
H and
14
C.
Their importance is shown by their role in human body metabolism. They are
contributors to the internal irradiation of human beings via inhalation and ingestion.
Typical average volumes in air and average annual effective doses from these
cosmogenic radionuclides are given in Table 3.1 (according to UNSCEAR [1]).
The global inventory of
3
H is about 1275
×
10
15
Bq and the annual production
rate is 72
×
10
15
Bq/year. The global inventory of
14
C is about 13
×
10
18
Bq and
the annual production rate is 1.5
×
10
15
Bq/year. Both these cosmogenic nuclides
(
3
H and
14
C) are released to the environment as man-made nuclides from nuclear
installations and have been released during nuclear weapons tests.
3.3 TERRESTRIAL RADIATION
3.3.1 T
ERRESTRIAL
R
ADIATION
: R
ADON
AND
D
ECAY
P
RODUCTS
IN
THE
A
IR
AND
O
THER
R
ADIONUCLIDES
T
HAT
C
AN
B
E
I
NHALED
Radionuclides that have a terrestrial origin (primordial radionuclides) are present
at various levels in every kind of matter in nature. This means they are naturally
present, even in the human body.
TABLE 3.1
Typical Volume Activities of the Most Important
Cosmogenic Radionuclides in the Air, Typical
Annual Effective Dose Caused By These Nuclides
Nuclide
3
H
14
C
Average volume activity in air (Bq/m
3
) 1.4
×
10
–3
56.3
×
10
–3
Annual effective dose (µSv/year) 0.01 12
DK594X_book.fm Page 38 Tuesday, June 6, 2006 9:53 AM
© 2007 by Taylor & Francis Group, LLC
Radioactivity in the Air
39
Terrestrial radiation is formed mainly by radionuclides from the
238
U and
232
Th series and from
40
K. These radionuclides irradiate our body with
γ
radiation
(externally and internally) and
β
and
α
radiation (mainly internally). External
irradiation is caused by radioactivity present in the soil and in any other material
surrounding our bodies, including the air. Internal irradiation is caused by radio-
nuclides that are inhaled or ingested. In this chapter we discuss radioactivity in
the air; therefore, the most important exposure pathway is inhalation.
Irradiation and effective doses caused by inhalation of terrestrial nuclides
from the air result from the presence of dust particles containing radionuclides
from the
238
U and
232
Th series. Typical amounts of
238
U and
232
Th in the air are
about 1 µBq/m
3
. If the dust particles in air are formed by organic matter, then
their uranium and thorium content is significantly lower. On the other hand, if
dust particles are formed by fly ash (from the burning of coal), then the uranium
and thorium content may be much higher. Typical volumes of uranium and
thorium series radionuclides in air (according to UNSCEAR [1]) are shown in
Table 3.2. The average annual effective dose from inhalation of uranium and
thorium series radionuclides in air (without contributions of radon [
222
Rn] and thoron
[
220
Rn]) is typically about 5 to 10 µSv/year.
The most important and dominant contributors to inhalation dose are decay
products of radon. Radon and its decay products in the air are the main natural
sources of irradiation in human beings.
Inhalation of radon (and its decay products) and thoron (so-called thoron)
from the air causes their deposition on the lining of the lungs. These deposited
radionuclides irradiate the lungs and other tissues, especially by
α
particles, as
well as
β
and
γ
radiation.
What is the mechanism by which radon and thoron enter the atmosphere?
Both nuclides are the gaseous products of the decay of radium isotopes
226
Ra and
224
Ra, which belong to the uranium and thorium series and are present in any
terrestrial materials (in solid matrix). Some radon atoms are released from the
solid matrix and escape from the mineral grain into the pore space. These radon
atoms are then transported by diffusion and advection, and are either decayed or
released to the atmosphere. As a result, the volume activity of radon and its
daughter products in the air is observed. The process of radon emanation (escape
from the solid matrix) and transportation is influenced by many factors such as
TABLE 3.2
Typical Volume Activities of Radionuclides From the Uranium and Thorium
Series in Air (Bq/m
3
), with the Exception of
222
Rn and
220
Rn
Nuclide
238
U
230
Th
226
Ra
210
Pb
210
Po
232
Th
228
Ra
228
Th
235
U
Average
volume
activity
1
×
10
–6
0.5
×
10
–6
1
×
10
–6
500
×
10
–6
50
×
10
–6
0.5
×
10
–6
1
×
10
–6
1
×
10
–6
0.05
×
10
–6
DK594X_book.fm Page 39 Tuesday, June 6, 2006 9:53 AM
© 2007 by Taylor & Francis Group, LLC
40
Radionuclide Concentrations in Food and the Environment
moisture, geological factors, and climate or meteorological conditions. Radon
and its decay products are released not only from the soil or from the mineral
grains, but can also be released from various building materials. Radon can
penetrate from the ground around the foundations of buildings. Under some
special conditions radon can be “withdrawn” from the ground to the atmosphere
of buildings at higher entry rates. These phenomena can cause indoor radon
activity to be higher than outdoor radon activity. The volume activity of radon
in the air is therefore classified as “outdoor” activity and “indoor” activity.
The typical outdoor volume activity of radon and thoron in the air is 10 Bq/m
3
.
There are many places in the world with lower volume activities (from 1 Bq/m
3
)
and with higher average activities (more than 100 Bq/m
3
) of radon and thoron in
the air. Lower activities are typical for coastal regions and small islands. Higher
activities are typical for sites with higher radon emanation and release to the
atmosphere. The typical outdoor volume activity of radon results in a typical
annual effective dose of about 100 µSv/year. Significant variations in radon
volume activity in the air are usually observed in a given place during the day
(solar radiation causes heating and transport of radon to higher layers of the
atmosphere, thus expected air volume activity near the ground will be lower; at
night and in the early morning, temperature inversions cause radon atoms to be
closer to the ground, thus expected air volume activity near the ground will be
higher), as a result of precipitation (rain can wash radon and its decay products
from the higher air layers, causing an increase in radon levels near the ground),
or as a result of winds.
The typical indoor volume activity of radon is about 10 to 100 Bq/m
3
and
thoron is about 2 to 20 Bq/m
3
. The typical indoor volume activity of radon
produces a typical annual effective dose of about 1000 µSv/year (1 mSv/year)
(Table 3.3). The indoor volume activity of radon varies significantly depending
on geological conditions and the building materials used. Numerous surveys in
many countries have been performed to determine the radon activity in dwellings.
For example, the mean radon volume activity in dwellings in the Czech Republic
TABLE 3.3
Typical Volume Activities of
222
Rn and
220
Rn
in the Air (Outdoor and Indoor) and Typical
Annual Effective Doses (Outdoor and Indoor)
Nuclide
222
Rn
220
Rn
Average volume activity in outdoor air (Bq/m
3
)10 10
Average volume activity in indoor air (Bq/m
3
) 10–100 2–20
Annual effective dose (µSv/year), outdoor 100 ~10
Annual effective dose (µSv/year), indoor 1000 ~90
Note:
Values are based on data from UNSCEAR [1].
DK594X_book.fm Page 40 Tuesday, June 6, 2006 9:53 AM
© 2007 by Taylor & Francis Group, LLC
Radioactivity in the Air
41
is about 140 Bq/m
3
, but buildings with values as high as 20,000 Bq/m
3
have been
found. The mean radon volume activity in dwellings in Slovakia is about 90
Bq/m
3
and the highest values found have been about 4000 Bq/m
3
(see Table 3.4).
On the other hand, the mean radon volume activity in dwellings in Egypt is about
9 Bq/m
3
and maximal values found have been about 20 Bq/m
3
.
As was stated above, building materials (and the radioactivity of the uranium
and thorium series in them) can affect indoor radon activities. Therefore in many
countries there is legislation that defines the maximal permitted activity in build-
ing materials. For example, in Slovakia, the maximal permitted mass activity of
226
Ra in building materials is 120 Bq/kg.
3.3.2 T
ERRESTRIAL
R
ADIONUCLIDES
IN
THE
A
IR
D
UE
TO
I
NDUSTRIAL
A
CTIVITIES
(O
THER
T
HAN
N
UCLEAR
E
NERGY
)
Natural (terrestrial) radionuclides can be and are released to the atmosphere as
a result of the industrial processing of various raw materials. Mineral processing
and the combustion of fossil fuels are the most important processes that contribute
to the emission of uranium and thorium series radionuclides to the environment,
increasing their air volume activities and causing exposure of human beings.
The main radionuclide released from industrial activities is radon. Radon is
released in the process of burning natural gas, as well as in the phosphates and
cement industry and gas and oil extraction. Iron and steel production processes
and cement and phosphorus production result in the release of
210
Pb.
Radionuclides released to the atmosphere can be transmitted over large dis-
tances (especially if they are released as a result of a thermal process) or can be
released in the form of dust or fly ash in the vicinity of the industrial plant.
Radionuclides released to the atmosphere from industrial activities other than
nuclear energy contribute mainly to the internal exposure of human beings via
inhalation and ingestion. For example, in the case of coal-burning power plants,
the annual effective dose from natural radionuclides present in emissions is
assumed to be maximally 10 to 50 µSv/year. According to UNSCEAR [1], the
overall average annual effective dose due to emissions from industrial activities
TABLE 3.4
Typical Content of Radionuclides in Building Materials in Slovakia
(According to Cabanekova [4]) and Typical Mass Activity (in Bq/kg)
40
K
226
Ra
232
Th
Bricks 600 (varies from 100 to
1000)
60 (varies from 30 to
300)
70 (varies from 100 to
600)
Concrete 300 (varies from 100 to
600)
50 (varies from 10 to
100)
30 (varies from 5 to 70)
DK594X_book.fm Page 41 Tuesday, June 6, 2006 9:53 AM
© 2007 by Taylor & Francis Group, LLC
42 Radionuclide Concentrations in Food and the Environment
(other than nuclear) ranges between 0.001 and 20 µSv/year. The highest values
for members of critical groups could be about 1000 µSv/year. Examples of typical
releases of radon to the atmosphere from various industrial plants are shown in
Table 3.5 (values are from UNSCEAR [1]).
3.3.3 SUMMARY: AIRBORNE ACTIVITY DUE TO NATURAL
R
ADIATION SOURCES
Table 3.6 shows typical air volume activities (in Bq/m
3
) of natural radionuclides
in the environment.
TABLE 3.5
Typical Annual Releases of
222
Rn
from Various Industrial Plants
Industrial Plant Release of
222
Rn (Bq/year)
Coal-fired power plant 34 × 10
9
Gas-fired power plant 230 × 10
9
Oil extraction 540 × 10
9
Iron production 180 × 10
9
TABLE 3.6
Typical Air Volume Activities of Natural
Radionuclides in the Environment
Nuclide
Average Volume Activity
(Bq/m
3
)
3
H 1.4 × 10
–3
14
C 56.3 × 10
–3
238
U1 × 10
–6
230
Th 0.5 × 10
–6
226
Ra 1 × 10
–6
210
Pb 500 × 10
–6
210
Po 50 × 10
–6
232
Th 0.5 × 10
–6
228
Ra 1 × 10
–6
228
Th 1 × 10
–6
235
U 0.05 × 10
–6
222
Rn outdoor 10
222
Rn indoor 10–100
220
Rn outdoor 10
220
Rn indoor 2–20
DK594X_book.fm Page 42 Tuesday, June 6, 2006 9:53 AM
© 2007 by Taylor & Francis Group, LLC
Radioactivity in the Air 43
3.4 MAN-MADE RADIONUCLIDES IN THE AIR
3.4.1 M
AN-MADE RADIONUCLIDES IN THE AIR DUE TO
N
UCLEAR WEAPONS TESTS AND PRODUCTION
Nuclear weapons tests in the atmosphere were performed between 1945 and 1980
by the U.S., the Soviet Union, the U.K., France, and China. During these tests
(especially when performed in the atmosphere), many radioactive materials were
released directly into the environment without any restrictions. As a result, the
world’s population was exposed to these materials via exposure from the ground
deposition, inhalation of airborne nuclides, and ingestion. According to
UNSCEAR [1], the average annual effective dose resulting from atmospheric
nuclear tests was highest in 1963, about 110 µSv/year. At the end of the 20th
century it was less then 6 µSv/year.
Many radionuclides were deposited as local or intermediate fallout and cre-
ated deposits on the ground; however, large amounts of volatile radionuclides
like
90
Sr,
137
Cs, and
131
I were dispersed in the world’s atmosphere (Table 3.7). In
the 1960s, the highest average airborne volume activities of
90
Sr in the air near the
ground were about 10
–3
Bq/m
3
, while in the 1980s they were only about 10
–7
to
10
–6
Bq/m
3
.
The effective dose from the inhalation (total effective dose due to inhalation
resulting from all tests) of radionuclides produced in atmospheric tests was about
150 µSv. The annual effective dose due to inhalation was highest in 1963, about
36 µSv. The most important contributors to this exposure pathway were
144
Ce,
106
Ru,
95
Zr, and
90
Sr. After the atmospheric tests ceased, airborne activity of these
radionuclides decreased rapidly and inhalation as an exposure pathway due to
nuclear tests became practically negligible (Table 3.8).
There are still two other contributors to exposure that are widely dispersed
in the atmosphere (and especially in the biosphere), namely
3
H and
14
C. However,
their contribution to the inhalation dose is negligible and they contribute to
effective dose via ingestion only. The estimated global release of
14
C in atmo-
spheric tests was about 213 × 10
15
Bq. The global inventory of
14
C as a cosmogenic
TABLE 3.7
Average Annual Airborne Volume Activity
for the Northern Hemisphere of
90
Sr Due
to Releases From Atmospheric Tests
(According to UNSCEAR [1])
Year Average Annual Volume Activity in Air (Bq/m
3
)
1957 0.23 × 10
–3
1963 2.17 × 10
–3
1970 0.12 × 10
–3
1983 0.001 × 10
–3
DK594X_book.fm Page 43 Tuesday, June 6, 2006 9:53 AM
© 2007 by Taylor & Francis Group, LLC
44 Radionuclide Concentrations in Food and the Environment
nuclide is about 13 × 10
18
Bq and the annual production rate due to cosmic
radiation is 1.5 × 10
15
Bq/year. From this it can be seen that atmospheric tests
quite significantly influenced the natural state.
3.4.2 MAN-MADE RADIONUCLIDES IN THE AIR DUE TO ELECTRICITY
G
ENERATION IN NUCLEAR POWER PLANTS: FUEL
P
RODUCTION AND OPERATION OF NUCLEAR POWER PLANTS
Global radionuclides released from the nuclear fuel cycle are nuclides that are
fairly long-lived and are dispersed in the atmosphere and biosphere and irradiate
the world population as a whole. These nuclides are
3
H (half-life 12.26 years),
14
C
(half-life 5,730 years),
85
Kr (half-life 10.7 years), and
129
I (half-life 1.6 × 10
7
years).
Again it should be emphasized that
3
H and
14
C are cosmogenic nuclides; this
means they are also present naturally in the environment.
The total activity of global radionuclides released from the nuclear fuel cycle
(nuclear power plants and reprocessing plants, release activity from the entire
nuclear power industry at the end of 1997, according to UNSCEAR [1]), together
with the average annual effective doses to individuals due to releases of global
radionuclides (world average) are shown in Table 3.9.
Common releases caused by normal long-term operation of nuclear power
plants consist of not only global radionuclides, but many other radionuclides. As
an example, Table 3.10 and Table 3.11 list common atmospheric discharges from
a nuclear power plant (VVER-440 MW type).
The activity of aerosols in normal effluents from power reactors is a function
of the state of the fuel. If there is a problem with the tightness of the fuel in the
reactor, contamination of the primary circuit is increased and consequently efflu-
ents of aerosols can be higher.
TABLE 3.8
Average Effective Dose Due to Inhalation (Total
Effective Dose Due to Inhalation Resulting From All
Tests) Caused By the Most Important Radionuclide
Contributors Produced in Atmospheric Tests
Nuclide
Effective Dose Due to Inhalation
(Total From All Atmospheric Tests) (µSv)
131
I 2.6
95
Zr 2.9
144
Ce 53
106
Ru 35
90
Sr 9.2
137
Cs 0.3
Pu, Am 38
DK594X_book.fm Page 44 Tuesday, June 6, 2006 9:53 AM
© 2007 by Taylor & Francis Group, LLC
Radioactivity in the Air 45
The reported annual effective dose in individuals living in the vicinity (up to
50 to 100 km from the site) of a nuclear power reactor is between 1 and
500 µSv/year. According to UNSCEAR [1], the typical annual effective dose to
individuals resulting from nuclear reactor effluents to the atmosphere is between
0.04 µSv/year and 10 µSv/year (per reactor; this means that the dose is realized
in human beings living up to approximately 50 km from the reactor).
TABLE 3.9
Activity of Global Radionuclides Released to the
Atmosphere From the Nuclear Fuel Cycle Through the End
of 1997, According to UNSCEAR [1], and World Average
Annual Effective Dose Due to These Releases
Global
Nuclide
Activity in Effluents, Sum From the
Whole Nuclear Fuel Cycle (Bq)
Annual Effective Dose
(World Average)
3
H ~300 × 10
15
~0.005 µSv/year
14
C ~3 × 10
15
Maximally 1 µSv/year
85
Kr ~3.3 × 10
18
~0.1 µSv/year
TABLE 3.10
Common Activity of Noble Gasses Measured in Atmospheric
Discharges From a Nuclear Power Plant VVER-440 (According
to Tecl [8])
Nuclide Half-Life
Typical Activity in Atmospheric Discharges
From a Nuclear Power Plant VVER-440
41
Ar 110 minutes 500–700 Bq/m
3
133
Xe 5.2 days 70–80 Bq/m
3
85
Kr 10.7 years 20–30 Bq/m
3
TABLE 3.11
Atmospheric Effluents of Aerosols: Typical
Values in Discharges From a Nuclear Power
Plant VVER-440 (According to Rulik et al. [5])
Nuclide
Common Discharge Activity Per Quarter
(VVER-440)
137
Cs 1E+4 to 1E+5 Bq
242
Cm 1E+3 to 1E+5 Bq
238
Pu 1E+3 to 1E+4 Bq
DK594X_book.fm Page 45 Tuesday, June 6, 2006 9:53 AM
© 2007 by Taylor & Francis Group, LLC
46 Radionuclide Concentrations in Food and the Environment
3.4.3 MAN-MADE RADIOACTIVITY IN THE AIR IN CASE
OF NUCLEAR ACCIDENT
The operation of nuclear power plants is one human activity that, if a serious
accident occurs, can lead to very significant radioactive pollution of the environment
and can cause increased irradiation of the population, especially in the vicinity of
the plant (up to 100 to 300 km from the site of release). The possible impacts of
a serious accident are the main reason why the nuclear industry is under very strict
and sophisticated controls. These controls cover the nuclear power plant (the phys-
ical and chemical principles of the processes and the barriers preventing radio-
nuclides from the reactor core from being released to the environment; one such
barrier is modern containment, in which the reactor and all other systems that might
be in contact with radioactivity from the core are covered and protected), training
of the operators, safety procedures, etc. These controls have greatly improved
because of the serious nuclear accidents that have taken place in the last 30 years.
Two such accidents were Three Mile Island, in the U.S., and Chernobyl, in
Ukraine (former USSR). The Three Mile Island accident occurred in 1979. The
initial cause of the accident was the loss of primary coolant. Consequently partial
core damage occurred (half of the reactor core melted). As a result, an increase
in radioactivity in the air due to the release of radionuclides to the atmosphere
was observed. Effective doses to the inhabitants in the vicinity of the plant were
relatively low, about 10 µSv per individual. This dose was realized in about 2
million people living in the vicinity of the plant.
The most catastrophic and severe nuclear accident happened in 1986 at the
Chernobyl nuclear power plant. There was almost total damage of the core, with
very high releases of radioactive substances from the reactor core to the atmo-
sphere and the environment. Radioactive products were also emitted from the
fires and explosions in the reactor. Released radionuclides were dispersed over
long distances and pollution was measured all over Europe. The Chernobyl
accident was the most severe accident that could be imaged in the context of the
peaceful use of nuclear power.
For a better understanding of what could be expected in case of such a severe
nuclear accident (as an example), the radiological conditions of a Chernobyl-type
release are shown in Table 3.12, based on computer model calculations. The source
term (the total release of radionuclides to the atmosphere) applied in the model
calculations was the same as that estimated for the Chernobyl accident. The mete-
orological conditions applied were prepared (artificial) ones. The point of release
assumed in the model calculations is identical with the former Chernobyl nuclear
power plant site in Ukraine. It should be stated here that all three remaining reactors
of the Chernobyl nuclear power plant have been shut down and decommissioned.
The model calculations were performed using the este code — the computer code
that is used by emergency response workers and crisis staff in case of a nuclear
accident [2]. The results (the maps of radiological impacts calculated by este) are
shown in Figure 3.1 and Figure 3.2. The estimated total release of radionuclides
(the source term) in case of a Chernobyl-type accident is shown in Table 3.12.
DK594X_book.fm Page 46 Tuesday, June 6, 2006 9:53 AM
© 2007 by Taylor & Francis Group, LLC
Radioactivity in the Air 47
TABLE 3.12
Estimated Total Release of Radionuclides (the Source Term) From the Core of a Chernobyl-Type Reactor
in the Case of a Severe Accident with Total Melting of the Core (Core Damage) and Bypass of or Damage
to the Reactor Building (According to Carny [6])
Nuclide
Estimated Core Inventory of the
RBMK 1000 Reactor. T is the
time from the end of the chain
reaction (Bq).
Core Inventory
of the Chernobyl
Nuclear Power
Plant at the Time
of the Accident,
According to
OECD [7] (Bq)
Total Release to the Environment.
The most severe source term for the
RBMK 1000 reactor: total melting of
the core (core damage) and bypass
of or damage to the reactor building.
Total Release to the
Environment During
the Chernobyl
Accident, Estimation
According to OECD [7]
T = 1.5 Hours T = 24 Hours (Bq) Percent of the Core Percent of the Core
85m
Kr 7.6E+17 2.2E+16 2.2E+16 100.00
85
Kr 2.1E+16 2.1E+16 (2.5–3.3)E+16 2.1E+16 100.00 100
87
Kr 1.0E+18 3.6E+12 3.6E+12 100.00
88
Kr 2.0E+18 7.2E+15 7.2E+15 100.00
86
Rb 9.6E+14 9.3E+14 2.2E+14 23.99
88
Rb 1.9E+18 8.1E+15 1.9E+15 23.99
89
Sr 3.5E+18 3.4E+18 (2.3–4.0)E+18 1.6E+17 4.80 4.0–6
90
Sr 1.4E+17 1.4E+17 (1.7–2.3)E+17 6.6E+15 4.80 4.0–6
91
Sr 3.8E+18 7.0E+17 3.4E+16 4.80
90
Y 1.4E+17 1.4E+17 3.1E+14 0.22
91m
Y 1.3E+18 4.5E+17 9.8E+14 0.22
91
Y 4.4E+18 4.4E+18 9.7E+15 0.22
95
Zr 5.6E+18 5.5E+18 (5.1–5.8)E+18 1.2E+16 0.22 3.5
97
Zr 5.3E+18 2.1E+18 4.5E+15 0.22
(continued)
DK594X_book.fm Page 47 Tuesday, June 6, 2006 9:53 AM
© 2007 by Taylor & Francis Group, LLC
48 Radionuclide Concentrations in Food and the Environment
TABLE 3.12 (continued)
Estimated Total Release of Radionuclides (the Source Term) From the Core of a Chernobyl-Type Reactor
in the Case of a Severe Accident with Total Melting of the Core (Core Damage) and Bypass of or Damage
to the Reactor Building (According to Carny [6])
Nuclide
Estimated Core Inventory of the
RBMK 1000 Reactor. T is the
time from the end of the chain
reaction (Bq).
Core Inventory
of the Chernobyl
Nuclear Power
Plant at the Time
of the Accident,
According to
OECD [7] (Bq)
Total Release to the Environment.
The most severe source term for the
RBMK 1000 reactor: total melting of
the core (core damage) and bypass
of or damage to the reactor building.
Total Release to the
Environment During
the Chernobyl
Accident, Estimation
According to OECD [7]
T = 1.5 Hours T = 24 Hours (Bq) Percent of the Core Percent of the Core
95
Nb 5.6E+18 5.6E+18 1.2E+16 0.22
97
Nb 2.4E+18 2.2E+18 4.9E+15 0.22
99
Mo 5.9E+18 4.6E+18 (4.8–7.3)E+18 9.2E+15 0.20 >3.5
99m
Tc 5.2E+18 4.4E+18 8.7E+15 0.20
103
Ru 4.1E+18 4.0E+18 (3.8–5.0)E+18 8.0E+15 0.20 >3.5
105
Ru 2.3E+18 6.3E+16 1.3E+14 0.20
106
Ru 9.3E+17 9.2E+17 (0.8–2.1)E+18 1.8E+15 0.20 >3.5
103m
Rh 2.1E+18 4.0E+18 8.0E+15 0.20
105
Rh 1.8E+18 1.4E+18 2.7E+15 0.20
127
Sb 2.2E+17 1.9E+17 2.3E+16 11.99
129
Sb 1.0E+18 2.6E+16 3.1E+15 11.99
127
Te 2.2E+17 1.8E+17 2.1E+16 11.99
129m
Te 2.0E+17 1.9E+17 2.3E+16 11.99
129
Te 1.1E+18 3.0E+16 3.5E+15 11.99
DK594X_book.fm Page 48 Tuesday, June 6, 2006 9:53 AM
© 2007 by Taylor & Francis Group, LLC
Radioactivity in the Air 49
131m
Te 4.7E+17 2.8E+17 3.3E+16 11.99
132
Te 4.4E+18 3.6E+18 (2.7–4.4)E+18 4.3E+17 11.99 25–60
131
I 3.1E+18 2.9E+18 (2.4–3.1)E+18 7.0E+17 23.99 50–60
132
I 4.4E+18 3.7E+18 8.9E+17 23.99
133
I 6.1E+18 2.8E+18 6.8E+17 23.99
134
I 3.2E+18 4.0E+10 9.5E+09 23.99
135
I 5.0E+18 4.5E+17 1.1E+17 23.99
133m
Xe 2.2E+17 1.6E+17 1.6E+17 100.00
133
Xe 6.3E+18 6.0E+18 (6.2–7.8)E+18 6.0E+18 100.00 100
135
Xe 1.6E+18 1.4E+18 1.4E+18 100.00
138
Xe 3.3E+17 1.4E–12 1.4E–12 100.00
134
Cs 2.8E+17 2.8E+17 (1.1–2.0)E+17 6.7E+16 23.99 33–43
136
Cs 1.1E+17 1.1E+17 2.5E+16 23.99
137
Cs 1.7E+17 1.7E+17 (2.2–2.9)E+17 4.2E+16 23.99 33–43
138
Cs 1.1E+18 1.7E+05 4.0E+04 23.99
140
Ba 5.9E+18 5.6E+18 (5.4–6.1)E+18 2.7E+17 4.80 4.0–6.0
140
La 5.9E+18 5.9E+18 1.3E+16 0.22
143
Pr 4.8E+18 4.6E+18 1.0E+16 0.22
147
Nd 2.2E+18 2.1E+18 4.6E+15 0.22
141
Ce 5.5E+18 5.4E+18 (5.1–5.6)E+18 1.1E+16 0.21 3.5
143
Ce 4.7E+18 2.9E+18 6.0E+15 0.21
144
Ce 3.1E+18 3.1E+18 (3.2–3.9)E+18 6.5E+15 0.21 3.5
239
Np 5.8E+19 4.4E+19 (2.7–6.7)E+19 9.2E+16 0.21 3.5
238
Pu 2.1E+15 2.1E+15 (0.7–1.6)E+15 4.4E+12 0.21 3.5
239
Pu 7.8E+14 7.8E+14 (8.0–9.6)E+14 1.6E+12 0.21 3.5
240
Pu 7.8E+14 7.8E+14 (1.2–1.6)E+15 1.6E+12 0.21 3.5
241
Pu 1.3E+17 1.3E+17 (1.7–1.9)E+17 2.6E+14 0.21 3.5
DK594X_book.fm Page 49 Tuesday, June 6, 2006 9:53 AM
© 2007 by Taylor & Francis Group, LLC
50 Radionuclide Concentrations in Food and the Environment
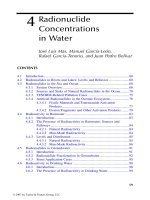
FIGURE 3.1
Example of the maps of
131
I air volume activity in the vicinity of the point of
release as a function of time from the beginning of release. The point of release is the site of the
Chernobyl nuclear power plant. The source term applied is the estimated source term for the Chernobyl
accident. Meteorological conditions are modeled without relation to the real conditions during
the accident at Chernobyl. Modeled by the computer code este. Actual situation, cloud 4 hours
after release. Projected cloud in 3 hours. Projected cloud in 6 hours. Projected cloud in 9 hours.
Example of air volume activities and time integrals of air volume activities at chosen point.
Actual situation, cloud due to 4 h release. Projected cloud in 3 h.
Projected cloud in 6 h.
Projected cloud in 9 h.
Example of air volume activities and time integrals of air volume activities at chosen point.
DK594X_book.fm Page 50 Tuesday, June 6, 2006 9:53 AM
© 2007 by Taylor & Francis Group, LLC
Radioactivity in the Air 51
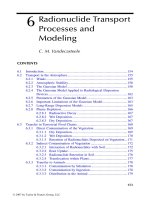
FIGURE 3.2 Example of the maps of
137
Cs ground deposition in the vicinity of the point
of release as a function of the time from the beginning of release. The point of release is
the site of the Chernobyl nuclear power plant. The source term applied is the estimated
source term for the Chernobyl accident. Meteorological conditions are modeled without
relation to the real conditions during the accident at Chernobyl. Modeled by the computer
code este. Actual situation, deposition 4 hours after release. Projected deposition in 3 hours.
Projected deposition in 6 hours. Projected deposition in 9 hours. Example of expected
ground deposition at the chosen point in 9 hours.
Actual situation, deposition due to 4 h release.
Projected deposition in 3 h.
Projected
deposition in 6 h. Projected deposition in 9 h.
Example of expected ground deposition at chosen point in 9 h.
DK594X_book.fm Page 51 Tuesday, June 6, 2006 9:53 AM
© 2007 by Taylor & Francis Group, LLC
52 Radionuclide Concentrations in Food and the Environment
Examples of maps of radiological impacts due to a very serious nuclear
accident are shown in Figure 3.3 and Figure 3.4. All the maps and results have
been calculated using este [2]. From the figures, the expected range of air volume
activities of
131
I can be seen. The radiotoxicity of
131
I occurs because iodine is
inhaled with the air or ingested with food and causes irradiation of internal organs,
especially irradiation of the thyroid gland. During longer periods after the acci-
dental release, other nuclides (due to their longer half-life and expected larger
amounts in the release) are expected to take the role of the most radiotoxic one,
namely
134
Cs and
137
Cs. Therefore, ground deposition of
137
Cs is shown.
Finally, Figure 3.5 and Figure 3.6 show maps of avertable doses. Avertable
doses (doses to human beings that could potentially be saved) serve as a criteria
for interventions in case of a nuclear (radiological) accident (e.g., for the evacu-
ation of inhabitants, for sheltering, for administration of iodine prophylaxis, etc.).
Values of airborne activity that demand protective measures (urgent or precau-
tionary measures) are shown in Table 3.13 [3].
FIGURE 3.3 Example of the map of time integrals of air volume activity of
131
I in the
vicinity of the point of release. Predicted situation 24 hours from the beginning of the
release. The point of the release is the site of the Chernobyl nuclear power plant. The
source term applied is the estimated source term for the Chernobyl accident. Meteorolog-
ical conditions are modeled without relation to the real conditions during the accident at
Chernobyl. The sites of other Ukrainian nuclear power plants — Rovno and Chmelnitsky —
can be seen on the map. Modeled by the computer code este.
DK594X_book.fm Page 52 Tuesday, June 6, 2006 9:53 AM
© 2007 by Taylor & Francis Group, LLC
Radioactivity in the Air 53
FIGURE 3.4 Example of the map of ground deposition of
137
Cs in the vicinity of the
point of release. Predicted situation 24 hours from the beginning of the release. The point
of the release is the site of the Chernobyl nuclear power plant. The source term applied
is the estimated source term for the Chernobyl accident. Meteorological conditions are
modeled without relation to the real conditions during the accident at Chernobyl. The sites
of other Ukrainian nuclear power plants — Rovno and Chmelnitsky — can be seen on
the map. Modeled by the computer code este.
DK594X_book.fm Page 53 Tuesday, June 6, 2006 9:53 AM
© 2007 by Taylor & Francis Group, LLC
54 Radionuclide Concentrations in Food and the Environment
FIGURE 3.5 Example of the map of avertable dose: the dose averted by evacuation of
inhabitants before the cloud enters a given region on the map. The intervention level for
evacuation is usually the effective dose averted (= 50 mSv). (The value of the intervention
level can vary country by country.) This means that evacuation of inhabitants is optimized
if the effective dose averted by evacuation is 50 mSv or more. In some circumstances
evacuation can be imposed according to other criteria. Predicted avertable doses, situation
24 hours from the beginning of the release. The point of the release is the site of the
Chernobyl nuclear power plant. The source term applied is the estimated source term for
the Chernobyl accident. Meteorological conditions are modeled without relation to the
real conditions during the accident at Chernobyl. Modeled by the computer code este.
DK594X_book.fm Page 54 Tuesday, June 6, 2006 9:53 AM
© 2007 by Taylor & Francis Group, LLC
Radioactivity in the Air 55
FIGURE 3.6 Example of the map of avertable dose to thyroid: the dose to thyroid averted
by iodine prophylaxis implementation (iodine tablets are swallowed by inhabitants before
the cloud enters a given region on the map). The intervention level for iodine prophylaxis
implementation is usually the dose to thyroid averted (= 100 mGy). (The value of the
intervention level can vary country by country. In some countries, special lower values of
intervention levels for children are defined and used.) This means that implementation of
iodine prophylaxis to inhabitants is optimized if the dose to thyroid averted by iodine
tablet ingestion is 100 mGy or more. Predicted avertable doses to thyroid, situation
24 hours from the beginning of the release. The point of the release is the site of the
Chernobyl nuclear power plant. The source term applied is the estimated source term for
the Chernobyl accident. Meteorological conditions are modeled without relation to the
real conditions during the accident at Chernobyl. Modeled by the computer code este.
DK594X_book.fm Page 55 Tuesday, June 6, 2006 9:53 AM
© 2007 by Taylor & Francis Group, LLC
56 Radionuclide Concentrations in Food and the Environment
TABLE 3.13
Examples of Time Integrals of Air Volume Activities of Various Nuclides
That Should Lead to Administration of Urgent or Precautionary Protective
Measures in Case of Nuclear (Radiological) Accident [3]
Operational Intervention
Level (Bq/h/m
3
)
Intervention: Urgent Protective Measures,
Precautionary Protective Measures, or Measures
in the Field of Agriculture Nuclide
Dry
Deposition
Wet
Deposition
(5 mm/h)
8E+05 3E+04 Sheltering
137
Cs
9E+05 Wear (provisional) filter masks
8E+06 3E+05 Evacuation
5E+02 Protection of workers exchanging filters in buildings
4E+03 Exchange filters in trucks
4E+06 2E+04 Avoid staying outdoors, change clothing after staying
outdoors
4E+02 Immediate harvest of agriculture products
Cover plants with foils
Close greenhouses
Close stables, sheds
Put livestock in stables
Stop inflow into cisterns
7E+04 Iodine prophylaxis for children and pregnant women
131
I
7E+05 6E+04 Sheltering
1E+06 Wearing (provisional) filter masks
7E+05 Iodine prophylaxis for adults
7E+06 6E+05 Evacuation
1E+04 Protection of workers exchanging filters in buildings
1E+05 Exchange filters in trucks
1E+06 3E+04 Avoid staying outdoors, change clothing after staying
outdoors
2E+02 Immediate harvest of agriculture products
Cover plants with foils
Close greenhouses
Close stables, sheds
Put livestock in stables
Stop inflow into cisterns
DK594X_book.fm Page 56 Tuesday, June 6, 2006 9:53 AM
© 2007 by Taylor & Francis Group, LLC
Radioactivity in the Air 57
REFERENCES
1. United Nations Scientific Committee on the Effects of Atomic Radiation,
UNSCEAR 2000 Report to the General Assembly, with scientific annexes,
UNSCEAR, Vienna, Austria, 2000.
2. Carny, P., New functions of the este system — new possibilities for emergency
response, paper presented at the conference “The 27th Days of Radiation Protection,”
Liptovsky Jan, Slovakia, 2005, Conference Proceedings ISBN 80-88806-53-4.
3. Carny, P., Procedures of the State Office for Nuclear Safety of the Czech Republic
to the Catalogue of countermeasures in case of event with no insignificant radio-
logical impacts, technical report ABment, Trnava, Slovakia, 2003.
4. Cabanekova, H., Building materials as the source of radiation load of Slovak
population, paper presented at the conference “The 27th Days of Radiation
Protection,” Liptovsky Jan, Slovakia, 2005, 2005, Conference Proceedings ISBN
80-88806-53-4.
5. Rulik, P., Pfeiferova, V., Staubr, R., Tecl, J., Holgye, Z., and Schlesingerova, E.,
Independent monitoring of the aerosols effluents from NPP provided by SURO,
paper presented at the conference “The 27th Days of Radiation Protection,” Lip-
tovsky Jan, Slovakia, 2005, Conference Proceedings ISBN 80-88806-53-4.
6. Carny, P., Database of basic source terms of European NPPs for emergency
response purposes, technical report ABmerit, Trnava, Slovakia, 2003.
7. Devell, L., Guntay, S., and Powers, D.A., The Chernobyl accident source term.
Development of a consensus view, NEA/CSNI/R(95)/24, OECD/NEA, Issy-les-
Moulineaux, France, 1995.
8. Tecl, J., Results of independent monitoring of releases of noble gasses from
nuclear facilities collected by the SURO Prague, paper presented at the conference
“The 27th Days of Radiation Protection,” Liptovsky Jan, Slovakia, 2005, Confer-
ence Proceedings ISBN 80-88806-53-4.
DK594X_book.fm Page 57 Tuesday, June 6, 2006 9:53 AM
© 2007 by Taylor & Francis Group, LLC