Báo cáo sinh học: "A large, consistent plasma proteomics data set from prospectively collected breast cancer patient and healthy volunteer samples" doc
Bạn đang xem bản rút gọn của tài liệu. Xem và tải ngay bản đầy đủ của tài liệu tại đây (842.73 KB, 11 trang )
RESEARCH Open Access
A large, consistent plasma proteomics data set
from prospectively collected breast cancer
patient and healthy volunteer samples
Catherine P Riley
1
, Xiang Zhang
2
, Harikrishna Nakshatri
3
, Bryan Schneider
4
, Fred E Regnier
1
, Jiri Adamec
1
and
Charles Buck
1*
Abstract
Background: Variability of plasma sample collection and of proteomics technology platforms has been detrimental
to generation of large proteomic profile datasets from human biospecimens.
Methods: We carried out a clinical trial-like protocol to standardize collection of plasma from 204 healthy and 216
breast cancer patient volunteers. The breast cancer patients provided follow up samples at 3 month intervals. We
generated proteomics profiles from these samples with a stable and reproducible platform for differential
proteomics that employs a highly consistent nanofabricated ChipCube™ chromatography system for peptide
detection and quantification with fast, single dimension mass spectrometry (LC-MS). Protein identification is
achieved with subsequent LC-MS/MS analysis employing the same ChipCube™ chromatography system.
Results: With this consistent platform, over 800 LC-MS plasma proteomic profiles from prospectively collected
samples of 420 individuals were obtained. Using a web- based data analysis pipeline for LC-MS profiling data,
analyses of all peptide peaks from these plasma LC-MS profiles reveals an average coefficient of variability of less
than 15%. Protein identification of peptide peaks of interest has been achieved with subsequent LC-MS/MS
analyses and by referring to a spectral library created from about 150 discrete LC-MS/MS runs. Verification of
peptide quantity and identity is demonstrated with several Multiple Reaction Monitoring analyses. These plasma
proteomic profiles are publicly available through ProteomeCommons.
Conclusion: From a large prospective cohort of healthy and breast cancer patient volunteers and using a nano-
fabricated chromatography system, a consistent LC-MS proteomics dataset has been generated that includes more
than 800 discrete human plasma profiles. This large proteomics dataset provides an important resource in support
of breast cancer biomarker discovery and validation efforts.
Background
Proteomic analyses of readily accessible bodily fluids
present a powerful opportunity to monitor experimental
and control (e.g., healthy and disease) phenotypes with
an extremely data-rich readout [1-3]. The proteomic
approach enables detection and quantification of protein
expression. Another distinct advantage of this technol-
ogy is that measurement of functional gene products (i.
e., proteins) may directly reflect mechanisms that differ-
entiate groups. For example, altered expression of a
cytokine protein in diseased samples can indicate signal-
ing pathways impacted by this cytokine that may contri-
bute to the disease process. The fact that proteomics
approaches assess many hundreds and even thousands
of proteins simultaneously, can also support the func-
tional evaluation of a specific protein by revealing
changes in other proteins in relevant and associated
pathways. When applied in readily accessible human
biofluids, such as plasma, this technology is especially
promising for identification of protein biomarkers for
disease diagnosis, progressi on, and for therapeutic effi-
cacy [4-6].
* Correspondence:
1
Bindley Bioscience Center, Purdue University, West Lafayette, IN, USA
Full list of author information is available at the end of the article
Riley et al. Journal of Translational Medicine 2011, 9:80
/>© 2011 Riley et al; licensee BioMed Central Ltd. This is an Open Access article distri buted under the terms of the Creative Commons
Attribu tion License (h ttp: //creativecommons.org/licenses/by/2.0), which permits unrestricted use, distribution, and reproduction in
any medium, provided the original work is properly cited.
Liquid chromatography coupled with two- dimensi onal
mass spectro metry (LC-MS/MS) is the most commonly
employed technology for proteomics [7-9]. Tryptic
digestion of protein mixtures creates peptide fragments
of suitable size for ionization to enable mass spectrome-
try analyses. High performance liquid chromatography
(HPLC) is included to separate peptide mixtures accord-
ing to the physical properties of the molecules and this
separation of the peptides enables detection of larger
numbers of peptide ions in the MS. Peptide ions are
identified by dissociation within the mass spectrometer
in the second MS dimension to obtain amino acid
sequences that may be assigned to parent proteins via
database search [10-12]. In this data-dependent 2
nd
MS
dimension identification step, the act ivity of the mass
spectrometer is intermittently co-opted; additional pep-
tide ion detection does not occur in this phase of the
process. The second dimension MS step is typically
undertaken during profiling to ensure that identified
peptides are identical to the ions detected and quantified
at a specific point in the same experiment [13].
Although effective, this approach introduces bias by
occupying the duty cycle of the instrument for pep tide
ion selection and identification, rather than detection
and quantification. Peptide ions originating from low
abundance proteins or those with low ionization effi-
ciency may not be selected for identification, even
though some of these peptides/proteins may actually
contribute to disease development. Nevertheless, this
method is widely employed because variability of chro-
matography complicates the alternative approach of
sequential, non-coupled LC-MS/MS for peptide (and
protein) identification.
Proteomics technology has not yet provided validated
biomarkers [14]. One reason for this is that many of the
required steps suffer from a high degree of variability,
particularly the chromatography component. In addition,
the protocols for LC and MS require optimization of the
specific technology platform (i.e., the instruments).
Because of the complexity of these instruments, this pro-
cess is often unique to the laboratory, not standar dized,
and poorly reproducible between laboratories. Although
concerted efforts are underway to improve the reproduci-
bility of targeted proteomic analyses in complex biofluids
[15-17], relatively few consistent and reproducible pro-
teomics profiling platforms have been reported. Notably,
the generation of large numbers of comparable proteo-
mic profiles from complex biofluids that will enable a
data-drivenevaluationofthistechnologyonalarger
scale (i.e., ‘omics scale) has not been described.
The source of material for proteomic analyses is a par-
ticularly important consideration. For example, with
cancer indica tions, it has been suggested that tumor tis-
sue per se should be collected and proteins from this
tissue be assessed with proteomic methods [18]. Both
the availability and choice of control tissue is a signifi-
cant and potentially confounding issue. Normal tissue
may be difficult or impossible to obtain from living
donors under conditions similar to those used for col-
lection of tumor material. In addition, because of tumor
heterogeneity, the choice of tissue to best represent the
proteome of the tumor is not straightforward and will
be difficult to standardize at different clinical sites. An
alternative approach utilizes more readily accessible and
available biological sample material such as urine or
bloo d. Proteomic analyses of su ch flui ds should indicate
tumor proteins shed or excreted by the tumor that
couldbediagnosticforthepresenceofthetumor.
These same proteins may also be useful targets for ther-
apeutic intervention. In the case of blood plasma, such
analyses are complicated by abunda nt proteins that
comprise a disproportionate fraction of the total protein
pool [19-22]. Regardless of what tissue or fluid is
selected, an important goal is to standardize tissue/fluid
collection in order to minimize variability in the proteo-
mic profile that may arise from conditions of collectio n
or storage of the biosamples.
Wedescribeahighlyreproducibleproteomicsplat-
form that employs a commercially-available, nanofabri-
cated liquid chromatography apparatus a nd single
dimension ion trap mass spectrometry for LC-MS pep-
tide pro filing (detection and quantification). The profil-
ing step i s followed by separate LC-MS/MS analyses for
protein identification with t he identical, coupled LC-MS
platform (Agilent ChipCube™ and XCT II ion trap
mass spectrometer) [23,24]. The platform provides con-
sistent peptide profiles with respect to quantity and
quality of peptides detected in the same sample over
time, including from different tryptic digestions and
with different operators of the equ ipment [25,26]. To
provide further evidence validating this platform, we
report the generation of over 800 LC-MS proteomic
profiles from hu man plasma samples that were pro spec-
tively collected and stored under standard operating
procedures in a clinical trial-like protocol. Samples from
healthy volunteers and breast cancer patient volunteers
are included. Follow up samples from the breast cancer
patient volunteers at 3 month intervals are also
included. Consistency of these data is illustrated with
multiple peptide peaks detected across the complex
chromatograms. Follow on analyses o f selected samples
with LC-MS/MS provides protein identification for a
high percentage of detected LC-MS peaks and enabled
creation of a spectral library for human plasma. Identi-
fied proteins agree substantially with previo us high con-
fidence plasma proteomic analyses [27].
Validation of quantitative features of detected peptide
peaks is further demonstrated for discrete peaks of high,
Riley et al. Journal of Translational Medicine 2011, 9:80
/>Page 2 of 11
medium and low abundance proteins with targeted mul-
tiple reaction monitoring (MRM) analyses [17]. For
these studies, targeted analyses of plasma samples were
performed on a triple quadrupole mass spectrometer
employing the same ChipCube™ chromatography appa-
ratus. The study protocol for sample collection from
breast cancer patient volunteers included follow up sam-
ples from each patient at three month intervals. Proteo-
mic profiles from hundreds o f these follow up samples
have been generated to enable evaluation of disease pro-
gression and therapeutic efficacy. To our knowledge this
is the largest LC-MS proteomics dataset generated to
date. We expect this dataset to be of substantial value
for biomarker discovery and verification.
Methods
Trypsin digestion
Two hundred four healthy and 216 breast cancer plasma
samples (100 μg per sample) were denatured with 8 M
urea and 10 mM dithiothreitol (DTT) for 1.5 h at 37°C.
The mixtures were subjected to reduction and alkylation
with 0.5% triethylphosphine (TEP), 2% 2-Iodoethanol
and 97.5% acetonitrile for 1.5 h at 37°C [28]. Samples
were dri ed down, resu spended and digested in 100 mM
ammonium bicarbonate containing 2 μgoftrypsinand
incubated at 37°C for 16 h. Finally, 2.5 μlof10%tri-
fluoroacetic acid (TFA) was added to stop the digestion.
Additional discrete plasma samples collected from th e
breast cancer patient volunteers at 3 month intervals
after study enrollment were prepared in the same fash-
ion (fo llowed up to 30 months). All chemicals, solvents
and buffers were from Fischer Scientific (Pittsburgh,
PA).
NanoLC-Chip-MS
Plasma tryptic peptides (1 μg) were separated on a
nanoLC-Chip system (1100 Series LC equipped with
HPLC Chip interface, Agilent Technologies, Santa Clara,
CA) [25]. The peptides wereconcentratedontheAgi-
lent 300SB-C18 e nrichment column and washed with
5% acetonitrile (ACN); 0.01% TFA at flow rate 3 μl/min
for 5 min. The enrichment column was switched into
the nano-flow path and peptides were separated with
the C18 reversed phase ZORBAX 300SB-C18 analytical
column (0.75 μm × 150 mm; Agilent) coupled to the
electrospray ionization (ESI) source of the ion trap mass
spectrometer (XCT II P lus, Agilent Technologies). The
column was eluted with a 55 min linear gradient from
5% - 35% of a buffer containing 100% ACN, 0.01% TFA
atarateof300nl/min,followedbya10mingradient
from 35% - 100%. The column was equilibrated with an
isocratic flow (5% of same buffer) at 300 μl/min. The
system was controlled by Agilent ChemStati on software.
NanoLC-MS chromatograms were acquired in positive
ion mode. Acquisition range was 350 - 2000 m/z with
0.15 s maximum accumulation time and scan speed of
8,100 m/z per second.
NanoLC-Chip-MS/MS and targeted MS/MS
Trypsin digested human healthy and breast cancer
plasma peptides were separated on a nanoLC-Chip sys-
tem using the same setup and gradient as described
above. Automated MS/MS spectra were acquired during
the run in the data-dependent acquisition mode with
the selection of the three most abundant precur sor ions
(0.5 min active exclusion; 2+ ions preferred). These
spectrawereusedtogenerateaplasmaspectrallibrary
for the project. Targeted MS/MS spectra were acquired
during the run in the data-depend ent acquisition mode
for specific masses associated with the peaks of interest
when required for protein identification.
Protein Identification
NanoLC-Chip-MS/MS spectra were analyzed using
Spectrum Mill A.03.02.060 software (Agilent Technolo-
gies) and searches were performed against the human
IPI database (International Protein Index, version 3.03).
The parame ters of the search were as follows; no more
than two tryptic miscleavages allowed, cysteine searched
as iodoethanol, 1.0 Da peptide mass tolerance and 0.7
Da fragment ion mass tolerance [29].
Merging MS and MS/MS data
A peak list was generated from alignment of 204 healthy
and 216 baseline breast cancer samples analyzed with
LC-MS, and from 97 and 49 of these analyzed with LC-
MS/MS, respectively. The raw data from the MS and
MS/MS files were compared to ensure that the molecu-
lar information [m/z (+/- 0.7 Da), retention time (+/-
0.5 min), charge state] and chromatographic patterns
were the same in each file. The lists were combined to
provide a project peak list.
Multiple Reaction Monitoring (MRM) analysis
MRM analysis was performed using the same Agilent
nanoLC-chip system coupled to a triple quadruple tan-
dem mass spectrometer (6410 serie s, Agilent Technol-
ogies) using the same column and gradient as
described above. NanoLC-MS/MS chromatograms for
three of the peptides identified using targeted MS/MS
were acquired in positive ion mode under the follow-
ing conditions: capillary voltage of 1950 V; dry tem-
perature of 300°C; and dry gas f low of 4 l/min. Other
acquisition parameters and the chromatographic reten-
tion times of the peptide compounds measured are
listed in Table 1. Data acquisition and analysis were
accomplished using MassHunter software (version B
2.0.1, Agilent Technologies).
Riley et al. Journal of Translational Medicine 2011, 9:80
/>Page 3 of 11
Plasma sample collection
All samples were obtained from volunteers by healthcare
professionals under defined standard operating proce-
dures in a clinical trial-like protocol undertaken by the
Hoosier Oncology Group, a not-for-profit project part-
ner organization. All volunteers were enroll ed following
informed consent and in compliance with the health
insurance portability and accountability act (HIPAA)
and with authorization for release of personal health
information (PHI ). Inclusion criteria for the breast can-
cer cohort were: age ≥18 years, female (not pregnant),
histologically/cytologically confirmed invasive disease or
ductal carcinoma in situ (D CIS), preparing to begin a
new therapeutic regimen. For the healthy control cohort
inclusion criteria were: age ≥18 years, females (not preg-
nant), no history of invasive breast cancer or DCIS, no
history of malignancy in past 5 years (with the excep-
tions of basal/squamous cell cancer with low potential
for metastasis). Plasma sample processing was initiated
within 30 min of blood draw to an ethylenediaminete-
traacetic acid (EDTA) c ontaining tube. Samples were
spun for 30 min at 3500 rpm in a clinical centrifuge.
Plasma was immediately harvested in approximately 1
ml aliquots and frozen at either -20°C or -80°C. Frozen
samples were shipped by overnight courier to the Hoo-
sier Oncology Group laboratory for storage at -80°C
until use.
Data Analysis and Statistics
The Proteome Discovery Pipeline (PDP) bioinformatics
infrastructure created at the Bindley Bioscience Center
at Purdue University was used for data management and
data analyses [30]. Briefly, the pipeline converted the
raw data into mzXML format using Bruker’s CompassX-
port program and then processed the data files with
Xmass and Xalign software for deconvolution and align-
ment [31,32]. A log linear model was used fo r peptide
peak normalization across samples [33]. The parametric
student’s t test was employed for statistical evaluation of
peptide peak expression levels between groups. Normal-
ized values were employed to calculate the percentage
coeffient of variance (CV) [34]. For LC-MS/MS peptide
identification, only peptides with a Spectrum Mill score
of 5 or higher and Spectrum Mill Scor ed Peak Intensity
(SPI) of 70% or higher were considered positives [29].
Three specific and discrete transitions and their intensi-
ties were monitored for each peptide in the MRM ana-
lyses to ensure accuracy [15,35].
Results
A stable proteomic profiling platform is required for
proteomic analyses of plasma samples donated by
healthy volunteers and breast cancer patients. We col-
lected samples in a clinical trial-like protocol as part of
an NCI-sponsored clinical proteomics technology assess-
ment for cancer (CPTAC) biomarkers project. All
plasma samples were specifically collected for proteo-
mics analyses under standard operating procedures. A
rapid data collection ion trap instrument was selected
for profil ing (Agilent XCT II Plus) coupled with HPLC
via the nanofabricated Agilent ChipCube™ chromato-
graphy column for improved reproducibility and high
resolution via a highly stable nano-flow rate (18 μl/h).
Proteomic analyses run on the same platform at differ-
ent times have been reported to exhibit high variability
on multiple proteomic platforms [1,36]. We assessed
variability of our platform over time and with different
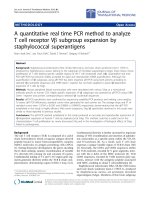
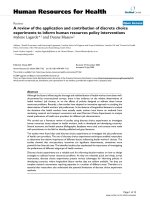
technical operato rs (Figure 1). The same plasma sample
digest analyzed two years apart showed good reproduci-
bility with the sample stored at -80°C in the interval
between runs (CV = 2.4%). Similarly, proteomic profil es
of different tryptic digests, and a sample r un two years
apart, are reproducible (CV = 4.3%). These analyses
were also run by two different operators. Similar consis-
tency is observed t hroughout the life of the ChipCube™
column and between different columns and column
Table 1 Proteins, peptides and transitions selected from LC-MS/MS spectra and the corresponding parameters for
MRM verification of plasma expression levels
Proteins Peptides Transitions precursor ion [M+H]
*-> product ion
Retention
time (min)
dwell time
(min)
Fragmentor
energy (kV)
Collision
energy (kV)
ApoA1 DYVSQFEGSALGK 701.1->532.4 34 100 200 20
701.1->661.4 25
701.1->808.5 30
Hemopexin EVGTPHGIILDSVDAAFICPGSSR 829.8>650.3 44 100 200 25
829.8>992.3 30
829.8>909.7 27
Angiotensin
preprotein
ADSQAQLLLSTVVGVFTAPGLHLK 822.8->664.4 62 100 200 20
822.8->877.1 25
822.8->816.7 22
Riley et al. Journal of Translational Medicine 2011, 9:80
/>Page 4 of 11
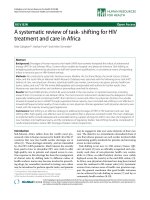
batches. Additionally, as can be seen in the base peak
chromatogram (BPC) overlays in Fig ure 1, there is more
variability in these hydrophobic peptides eluted off the
column after 40 min, compared to the peptides eluted
off the column earlier. The consistency of the platform
is further illustrated with a randomly selected ion from
these single plasma sample analyses, illustrated by the
extracted ion chromatographs (EIC; Figure 1). This low
intensity peak is detected with excellent reproducibility
between different tryptic digests and with analyses sepa-
rated by t wo years. The sources of technical variability
of the analytical platform, including plasma storage,
Digest 1 t = 0
Digest 1 t = 2 yr
Digest 2 t = 0
Digest 2 t = 0
Digest 1 t = 2 yr
Digest 1 t = 0
BPC
EIC 692.4; 38.4-39.9 min
MS
MS
MS
Digest 1 t = 0
Digest 2 t = 0
Digest 1 t = 2 yr
Figure 1 Base peak (BPC) and extracted ion chromatographs (EIC; mass over charge (m/z) value of 692.4) from one healthy plasma
sample analyzed on three different dates using the LC-MS platform. Both the overall BPC and randomly selected EIC are consistently
represented in the sample over time and between tryptic digests. The green chromatographs are from the original sample digest (10/27/2008)
run on the day of the tryptic digestion, red traces are from the same sample digest stored at -80°C for 22 months (run on 8/30/2010), and the
blue traces are from a new tryptic digest of the same plasma sample (digested and run on 8/31/2010). The corresponding MS scans illustrate
summed spectra (RT 38.4-39.9 minutes) associated with the major peak from each of the EICs. Insets indicate similarity even for a very low
intensity region of the spectra.
Riley et al. Journal of Translational Medicine 2011, 9:80
/>Page 5 of 11
protein digestion, chromatography, and data processing
must all be separately controlled.
The consistency of the platform across multiple sam-
ples was assessed with samples from 10 individuals in
each of two groups. The average CV of all peptide peak
areas detected in plasma samples from 10 discrete
healthy volunteers is 7.6% and 9.2% for 10 discrete
breast cancer patient volunteer plasma samples. All 10
of the breast cancer patients selected for this group
were diagnosed with stage I disease. The proteomics
profiling platform showed good consistency between
samples within the same group (healthy volunteers and
breast cancer patient volunteers). Variations between
biological samples confound the accuracy of the proteo-
mics analyses. However, intra-group CVs of less than
10% for LC-MS proteomic profiles that simultaneously
measure hundreds of proteins is excellent.
The behavior of the ChipCube™ chromatography col-
umn was assessed with multiple columns and samples.
The total number of detected pepti de peaks from 420
discrete plasma sample LC-MS proteomic profiles,
including samples run over a span of two years with dif-
ferent nanofabricated columns, averages 2348 peaks
with an average CV of 14.4%. Additionally, when these
samples are aligned with our data analysis pipeline [30],
92% of all peaks aligned, indicating the stability of the
profiling platform. The aligned peak intensities range
from 7,844 to 53,400,700. The detected peaks are
derived from proteins in all abundance classes (Addi-
tional file 1, Table S1).
A prim ary goal for differential proteomics is to detect
those proteins that are signi ficantly differently expressed
between groups. To evaluate the likelihood of false dis-
covery with our platform, we have compared LC-MS
profiles on replicates of individual samples that would
not be expected to provide significant differences in
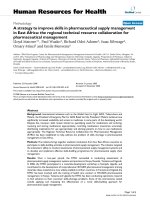
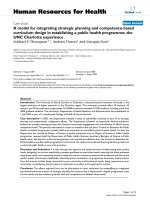
peptide peak intensity. Figure 2 shows the statistical eva-
luation o f replicate i njections of the same plasma sam-
ple. For comparison, the same statistical evaluation
performed on LC-MS profiles from 20 healthy volunteer
plasma compared with 20 breast cancer patient plasma
samples is also included. The self-comparison does not
result in peptides recognized as differentially expressed
(no statistically different peaks are identified). In con-
trast, many peaks differen tially expressed betw een these
healthy volunteer and baseline breast cancer patient
volunteers are identified (71 peaks with p value of <
0.05 and a fold change of 2 or higher). Candidate bio-
markers from our very large dataset will b e described
elsewhere (Riley et al., in preparation).
While the LC-MS proteomics profiling platform offers
several advantages, th is approach does not include iden-
tification of proteins. This is a critical aspect of the pro-
teomics workflow that enables assessment of the
involvement of specific proteins in relevant processes
and pathways. Because of the consistency of the Chip-
Cube™ apparatus, identical conditions were employed
to perform LC-MS/MS analyses of a group of the same
plasma samples (including both healthy and baseline
breast cancer patien t volunteers) to obtain protein iden-
tification for peptide peaks of interest. Thus in our plat-
form, spe cific peaks of interest (e .g., those differe ntially
expressed between groups) m ay be targeted for LC-MS/
MS analyses for peptide identification. In addition, we
have completed full spectrum LC-MS/MS experiments
on nearly 150 discrete human plasma samples to create
an LC-MS/MS spectral library for these human plasma
samples. Peptide peaks of interest may be identified
directly from this spectral library without the require-
menttore-runasampleinLC-MS/MSmodeandto
target a specific p eptide mass and retention time. This
same LC-MS/MS platform may be employed to target
specific peptide peaks of interest for identification. In
addition, the MS/MS spectral information can be
employed to identify specific peptides of interest for fol-
low-on, independent verification studies with sensitive
and quantitative multiple reaction monitoring (MRM)
studies on a triple quadrupole mass spectrometer
employing the same nanochromatography unit (see
below). The LC-MS/MS data from these plasma samples
Figure 2 Statistical evaluation of LC-MS peptide peak
expression level differences. Volcano plot displaying intensity
differences of peaks from LC-MS proteomic profiles of 10 replicate
injections of a single plasma sample (green). The same analyses of
the intensity differences of peaks from a comparison of LC-MS
profiles of healthy volunteer and breast cancer patient volunteer
plasma samples is also displayed (red balls, 20 discrete plasma
samples in each group). The negative log2 scale is displayed for
each axis: horizontal and vertical lines indicate fold change greater
than 2 and p values < 0.05.
Riley et al. Journal of Translational Medicine 2011, 9:80
/>Page 6 of 11
was submitted to protein database search algorithms to
identify the proteins. We routinely employ the Spectrum
Mill™ data search algorithm but other search algo-
rithms can also be used to analyze the LC-MS/MS data
for protein identification (e.g., X!tandem, Sequest, Mas-
cot) [10-12,29]. Proteins identified are listed in Addi-
tional file 1, Table S1.
As expected, abundant plasma proteins are well repre-
sented in the database search results from the LC-MS/
MSdata.However,in146LC-MS/MSexperiments,a
total of 1351 discrete proteins were identified with high
confidence. A manually-val idated, high confidence, mass
spectrometry protein data set generated from 11 human
plasma samples depleted of abundant plasma proteins
and containing 697 proteins, was recently described
[27]. Our results confidently identify 306 of the proteins
in this plasma protein reference set (44%). This indicates
that protein identification with our methods provide
coverage of the plasma proteome that is cons istent with
existing high confidence plasma proteome analyses and
that our platform is not overwhelmed with detection of
abundant plasma proteins.
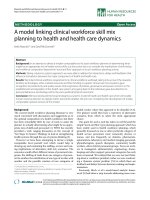
We employed multiple reaction monitoring (MRM) of
peptide peaks i n the triple quadrupole mass spectro-
meter to assess the consistency of our proteomics profil-
ing platform and to obtain independent verification of
the LC-MS-derived detection and the LC-MS/MS pro-
tein identification data that it provid es [17]. We employ
for these studies the Agilent 6410 triple quadrupole
mass spec equipped with the ChipCube ™ accessory to
standardize chromatography; in this case, between the
ion t rap and triple quadrupole mass spectrometers. To
confirm the consistency of the LC-MS profiling platform
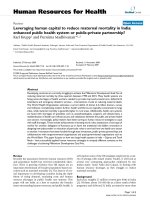
on a peak-by-peak basis, we arbitrarily selected specific
LC-MS peptide peaks of high, medium and low intensi-
ties for MRM analyses in 10 plasma samples from the
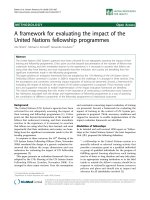
healthy volunteer group (Table 1). In each sample, the
independent and targeted MRM analysis confirms the
identity of these three peptides detected with LC-MS
profiling and identifi ed by LC-MS/MS (Figure 3). These
independent analyses provide additional support for the
consistency of our LCMS proteomic profiling platform.
The relative plasma concentrations we detected by LC-
MS for these proteins is consistent with other reports
[37-39].
To exploit the consistency of our LC-MS proteomic
platform, we generated profiles from a very large collec-
tion of human plasma samples prospectively collected in
our CPTAC program c linical trial-like protocol. The
samples were obtained under institutional review board
(IRB)-approved informed consent from healthy volun-
teers an d volunteer breast cancer patients scheduled to
begin a new treatment regime (here designated as ‘base-
line’ samples). These patients also provided samples at
each 3 month follow up visit with their oncologist.
These time course samples were obtained to enable
822.8->877.1
822.8->664.4 822.8->816.7
829.8>650.3
829.8>909.7
829.8>992.3
701.1->532.4
701.1->661.4
701.1->808.5
A.
B.
C.
D.
E.
F.
Figure 3 Representative MRM analyses of three selected plasma proteins. The proteins evaluated are ApoA1 (A, D); Hemopexin (B, E), and
Angiotensin preprotein (C, F). Panels A-C illustrate LC-MS/MS scans from the spectral library used to develop the MRM. The transitions in the
original MS/MS scan are indicated with the colored ovals matching the targeted MRM peaks in panels D-F that show each MRM transition and
the relative intensity of each transition.
Riley et al. Journal of Translational Medicine 2011, 9:80
/>Page 7 of 11
studies of therapeutic efficacy and disease progression.
As wa s the case with the small sample sets, th e consis-
tency of profiles from th is large number of plasma sam-
ples was excellent. To illustrate the performance of the
LC-MS platform at this scale of analysis, we selected
random peptide peaks that were detected in both the
healthy volunteer and baseline breast cancer patient
volunteer data sets. There were 79 and 68 peaks
detected in every healthy (n = 204) and every breast
cancer baseline plasma (n = 216) sample, respectively. A
total of 50 peaks were detected in every one of these
420 plasma sa mples. In the breast cancer patient sample
set, the average CV for each common peak was 9.3%.
The CV for the common peaks in the healthy volunteer
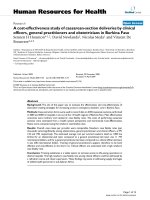
sample set was 10.8%. The intensity distributions of 25
of these peaks, selected at random, are illustrated in Fig-
ure 4 (red and green boxes).
We also performed the intensity distribution analysis
on peaks that appear consistently in a group but not
necessarily in every sample, consistent with many bio-
marker discovery approach es. A pe ak-by-peak assess-
ment of randomly selected peaks that were detected in
at least 75% of the 204 healthy and 216 breast cancer
volunteer human plasma samples was performed (that
is, the selected peaks were identified in greater than 150
of the plasma samples in each group). The intensity dis-
tributions across all samples of each of 25 randomly
selected peaks that meet these criteria ar e also shown in
Figure 4 (blue and purple boxes). The distribution of
these peaks includes those with high, medium and low
intensities. The average cv for each peak was 11.3% for
the healthy volunteer sample set and 11.1% for the
breast cancer patient sample set. The consistent LC-MS
proteomics profiling platform is again demonstrated.
Analysis with criteria for inclusion of peptide peaks that
are not detected in every sample still provides quantita-
tive detection of peaks with acceptable coefficients of
variation. Furthermore, employing the 75% inclusion cri-
teria, as for a biomarker discovery analysis, facilitates
comparison of peak intensities between groups. Peaks
with different intensities that reach statistical signifi-
cance may be considered candidate biomarkers that
warrant identification and additional evaluation.
Discussion
As a result of widely appreciated difficulties with repro-
ducibility of proteomic profiling, large datasets that will
provide a richer molecular description of protein
Figure 4 Intensity distribution of plasma LC-MS peptide peaks. Example intensity distributions are shown for 25 randomly selected LC-MS
peaks found in each of 420 plasma samples (peaks 1-25, red and green boxes) and 25 randomly selected peaks found in at least 75% of all
plasma samples (peaks 26-50, blue and purple boxes). The dark center line in each box represents the median intensity for each peak and the
surrounding box contains the interquatrile (+/- 25%) of the data points for that peak. The whiskers show peaks with intensities up to two
standard deviations from the median; circles represent peak intensities from these 420 plasma samples that are outside of this range.
Riley et al. Journal of Translational Medicine 2011, 9:80
/>Page 8 of 11
content in biosamples have not been reported. Although
gel free LC-MS-based global proteomics has introduced
remarkable speed and sensitivity for biomarker discovery
[1-3], high technical variability has severely limited the
use and impact of these approaches. Isotope labeling
strategies have been developed to improve the reliability
of LC-MS results [40-43]. Additionally, the advantages
of ultra high performance LC-MS instruments such as
Fourier transform ion cyclotron resonance (FT-ICR) MS
have been extensively explored [27,44]. Unfortunately,
the impact of these strategies is limited by the high
costs for reagents and instruments and the associated
need for in-depth technical expertise [45,46]. Neverthe-
less, highly reproducible proteomic technology platforms
and protocols hold great promise for biomarker discov-
ery. In addition, consistent data collected from large
numbers of high quality samples will enable develop-
ment of advanced informatic appr oaches to mor e effec-
tively utilize proteomic data to classify experimental
groups and patient populations.
Proteomic profiling of complex biosamples with LC-
MS, rather than the more commonly employed data
dependent LC-MS/MS approach, presents several
advantages. First, the LC-MS approach enables more
thorough collection of data in the mass spectrometer
since the duty cycle of the instrument is not occupied
with collecting the second MS information during pro-
filing [47-49]. The cost per sample is also decreased
with shorter sample run times. Second, generation and
captureofmorecompletedatafromacrossthechro-
matographic spectrum provides a solution to the pro-
blem of biasing the results with peptides from
abundant proteins and undersampling o f complex mix-
tures. Since the instrument is less occupied with peak
selection for a second MS dimension, i t is more likely
that less abundant and rare protein peptides will be
detected in the mass spectrometer [50]. Third, quant i-
fication is simplified with area under the curve calcula-
tion for detected peaks. Fourth, inclusion of a protein
identification step, which is error prone and computa-
tionally expensive, is not included in the initial proteo-
mic detection and quantification steps of the LC-MS
proteomics pipeline. In this case, the consistency of
the ChipCube™ chromatography component inte-
grated into our platform typically enables protein iden-
tification for peaks of interest directly from the human
plasma LC-MS/MS spectral library we have cre ated
from MS/MS analyses of nearly 150 discrete human
plasma samples; additional and subsequent targeted
LC-MS/MS analysis is often not required to identify
protein peaks of interest. However, peptide peaks not
identified in the spectral library that correspond to
proteins of interest , such as those that may differenti-
ate sample groups, can be readily identified subsequent
to the LC-MS profiling step in tar geted LC-MS/MS
follow-up sequencing experiments.
In the platform described here, chromatography is
standardized with the nanofabricated ChipCube™ appa-
ratus that enables strong reproducibility of peptide
behaviors between samples and over time (F igure 1).
The combination of the nano-flow rate and the Chip-
Cube™ apparatus affords impr oved reliability wit h very
consistent chromatography and excellent sensitivity for
peptide detection with eliminated dead volumes and
very low flow r ates [49,51-53]. The LC-MS proteomics
platform is coupled with a recently developed LC-MS
data analysis pipeline to facilitate generation and ana-
lyses of large numbers of proteomic profiles fro m com-
plex biological samples [30]. This developed platform
has been employed to compare proteome profiles of
large numbers of breast cancer patients with healthy
volunteers. Proteomic profiling results with these sam-
ples on our LC-MS platform provides excellent consis-
tency and reproducibility.
Independent verification of the accuracy of quantifica-
tion derived f rom the LC-MS label free analysis must be
preformed to improve confidence in candidate biomarker
selection. An MRM analysis of additional samples is a
high ly sensitive and specific approach [17]. The informa -
tion in our LC-MS/MS peptide spectral library can be
effectively used to design MRM methods with little to no
optimization. This in dependent verification of expression
levels of specific proteins of interest can be augmented
with software predictors for MRM method transition
ions that avoid contaminating ions not belonging to the
peptide of interest (such as Skyline; .
washington.edu/software/skyline/) [54].
In addition to the 420 healthy and baseline breast can-
cer patient volunteer plasma samples, we completed LC-
MS proteomic profiling anal yses on approximately 400
follow up samples collected every three months from
the breast cancer patient volunteers in our study (up to
36 months). These human plasma samples have b een
employed to reveal proteins that may indicate develop-
ment or presence of breast cancer and to ascertain the
changes in breast cancer plasma proteome with thera-
peutic treatment and disease pro gression (Riley et al.,
manuscript in preparation). This report provides the
opportunitytomakeavailablethisverylargehuman
plasma LC-MS proteomic profiles dataset that has been
deposited with Tranche, a data repository of Proteome-
Commons [55,56].
Conclusions
A robust liquid (nano)chromatography mass spectro-
meter (LCMS) platform enables reproducible proteomi c
profiling from human plasma samples. Consistency of
the platform enabled profiling of over 800 discrete
Riley et al. Journal of Translational Medicine 2011, 9:80
/>Page 9 of 11
human plasma samples comprising the largest human
proteomic profile dataset to date. Comparison of plasma
samples at t he proteome scale (hundreds to thousa nds
of proteins) will allow detection of candidate biomarkers
(i.e., differentially expressed proteins). Associated
LCMS/MS data from many of the same samples enables
protein identifi cation. The accuracy of LCMS proteomic
profiling protein quantification and subsequent LCMS/
MS identification was demonstrated with MRM using
peptide transitions predicted from the platform. All of
these data are available publicly for independent analysis
and provide a resource for plasma protein biomarker
discovery and verification.
Additional material
Additional file 1: Table S1 - All protein identifications from LC-MS/
MS analyses of human plasma samples. Proteins identified with
confidence using the Spectrum Mill
©
search engine are provided as
listed in the International Protein Index (IPI) database. Parameters for
confidence evaluation are provided in the Methods section.
Acknowledgements
We gratefully acknowledge the sample contribution of hundreds of breast
cancer patients and healthy volunteers. Samples were collected by health
care professionals in the Hoosier Oncology Group network, the dedicated
effort of these colleagues is also acknowledged. Particular effort and
oversight for sample collection was provided HOG-affiliated oncologist by
Dr. Robin Zon (Michiana Hematology Oncology, PC) and by Kristina
Kirkpatrick from HOG. Vicki Hedrick of the Purdue Proteomics Facility at the
Bindley Bioscience Center provided technical support for mass spectrometry
analyses. We thank Dr. Maria Tsiper for comments on and suggestions for
this manuscript. This research was supported the National Cancer Institute
Clinical Proteomics Technology for Cancer program, grant numbers U24
CA126480 and U24CA126480-04S4, F.E. Regnier, PI.
Author details
1
Bindley Bioscience Center, Purdue University, West Lafayette, IN, USA.
2
Department of Chemistry, University of Louisville, Louisville, KY, USA.
3
Department of Surgery, Indiana University School of Medicine, Indianapolis,
IN, USA.
4
Department of Medicine, Indiana University School of Medicine,
Indianapolis, IN, USA.
Authors’ contributions
CPR carried out the experiments, performed the data analysis and
contributed to writing the manuscript. XZ participated in experimental
design and contributed to data analysis and preparation of the manuscript.
HN and BS provided oversight for sample collection and analyses and
provided clinical and cancer biology input for the manuscript. FER and JA
provided technical expertise for proteomics studies. CB provided supervision
for the research, performed data analysis, and wrote the manuscript. All
authors read and approved the final manuscript.
Competing interests
The authors declare that they have no competing interests.
Received: 3 December 2010 Accepted: 27 May 2011
Published: 27 May 2011
References
1. Bantscheff M, Schirle M, Sweetman G, Rick J, Kuster B: Quantitative mass
spectrometry in proteomics: a critical review. Analytical and Bioanalytical
Chemistry 2007, 389:1017-1031.
2. Nesvizhskii AI, Vitek O, Aebersold R: Analysis and validation of proteomic
data generated by tandem mass spectrometry. Nature Methods 2007,
4:787-797.
3. Tuli L, Ressom HW: LC-MS Based Detection of Differential Protein
Expression. Journal of Proteomics and Bioinformatics 2009, 2:416-438.
4. Hudler P, Gorsic M, Komel R: Proteomic strategies and challenges in
tumor metastasis research. Clin Exp Metastasis 2010, 27:441-451.
5. Hanash SM, Pitteri SJ, Faca VM: Mining the plasma proteome for cancer
biomarkers. Nature 2008, 452:571-579.
6. Maurya P, Meleady P, Dowling P, Clynes M: Proteomic approaches for
serum biomarker discovery in cancer. Anticancer Res 2007, 27:1247-1255.
7. Zhang X, Fang A, Riley CP, Wang M, Regnier FE, Buck C: Multi-dimensional
liquid chromatography in proteomics–a review. Anal Chim Acta 2010,
664:101-113.
8. Rajcevic U, Niclou SP, Jimenez CR: Proteomics strategies for target
identification and biomarker discovery in cancer. Frontiers in Bioscience
2009, 14:3292-3303.
9. Riley CP, Adamec J: Discovery of new biomarkers of cancer using
proteomics technology. Current Cancer Therapy Reviews 2010, 6.
10. Eng JK, McCormack AL, Yates JR: An approach to correlate tandem mass-
spectral data of peptides with amino-acid-sequences in a protein
database. Journal of the American Society for Mass Spectrometry 1994,
5:976-989.
11. Craig R, Beavis RC: A method for reducing the time required to match
protein sequences with tandem mass spectra. Rapid Communications in
Mass Spectrometry 2003, 17:2310-2316.
12. Perkins DN, Pappin DJC, Creasy DM, Cottrell JS: Probability-based protein
identification by searching sequence databases using mass
spectrometry data. Electrophoresis 1999, 20:3551-3567.
13. Fitzpatrick DPG, You JS, Bemis KG, Wery JP, Ludwig JR, Wang M: Searching
for potential biomarkers of cisplatin resistance in human ovarian cancer
using a label-free LC/MS-based protein quantification method.
Proteomics Clinical Applications 2007, 1:246-263.
14. Diamandis EP: Cancer Biomarkers: Can We Turn Recent Failures into
Success? J Natl Cancer Inst 2010, 102:1462-1467.
15. Addona TA, Abbatiello SE, Schilling B, Skates SJ, Mani DR, Bunk DM,
Spiegelman
CH, Zimmerman LJ, Ham AJ, Keshishian H, et al: Multi-site
assessment of the precision and reproducibility of multiple reaction
monitoring-based measurements of proteins in plasma. Nat Biotechnol
2009, 27:633-641.
16. Bell AW, Deutsch EW, Au CE, Kearney RE, Beavis R, Sechi S, Nilsson T,
Bergeron JJM: A HUPO test sample study reveals common problems in
mass spectrometry-based proteomics. Nat Meth 2009, 6:423-430.
17. Rodriguez H, Rivers R, Kinsinger C, Mesri M, Hiltke T, Rahbar A, Boja E:
Reconstructing the pipeline by introducing multiplexed multiple
reaction monitoring mass spectrometry for cancer biomarker
verification: An NCI-CPTC initiative perspective. PROTEOMICS - Clinical
Applications 2010, 4:904-914.
18. Hartwell L, Mankoff D, Paulovich A, Ramsey S, Swisher E: Cancer
biomarkers: a systems approach. Nat Biotech 2006, 24:905-908.
19. Bandow JE: Comparison of protein enrichment strategies for proteome
analysis of plasma. Proteomics 2010, 10:1416-1425.
20. Tu CJ, Rudnick PA, Martinez MY, Cheek KL, Stein SE, Slebos RJC, Liebler DC:
Depletion of Abundant Plasma Proteins and Limitations of Plasma
Proteomics. Journal of Proteome Research 2010, 9:4982-4991.
21. Ichibangase T, Moriya K, Koike K, Imai K: Limitation of immunoaffinity
column for the removal of abundant proteins from plasma in
quantitative plasma proteomics. Biomedical Chromatography 2009,
23:480-487.
22. Zhang WM, Leinonen J, Kalkkinen N, Stenman UH: Prostate-specific
antigen forms a complex with and cleaves alpha 1-protease inhibitor in
vitro. Prostate 1997, 33:87-96.
23. Kim JH, Sedlak M, Gao Q, Riley CP, Regnier FE, Adamec J: Oxidative stress
studies in yeast with a frataxin mutant: a proteomics perspective. J
Proteome Res 2010, 9:730-736.
24. Kim JH, Sedlak M, Gao Q, Riley CP, Regnier FE, Adamec J: Dynamics of
Protein Damage in Yeast Frataxin Mutant Exposed to Oxidative Stress.
OMICS 2010, 14:689-699.
25. Hardouin J, Duchateau M, Joubert-Caron R, Caron M: Usefulness of an
integrated microfluidic device (HPLC-Chip-MS) to enhance confidence in
Riley et al. Journal of Translational Medicine 2011, 9:80
/>Page 10 of 11
protein identification by proteomics. Rapid Commun Mass Spectrom 2006,
20:3236-3244.
26. Lukas TJ, Luo WW, Mao H, Cole N, Siddique T: Informatics-assisted protein
profiling in a transgenic mouse model of amyotrophic lateral sclerosis.
Mol Cell Proteomics 2006, 5:1233-1244.
27. Schenk S, Schoenhals GJ, de Souza G, Mann M: A high confidence,
manually validated human blood plasma protein reference set. BMC Med
Genomics 2008, 1:41.
28. Hale JE, Butler JP, Gelfanova V, You JS, Knierman MD: A simplified
procedure for the reduction and alkylation of cysteine residues in
proteins prior to proteolytic digestion and mass spectral analysis. Anal
Biochem 2004, 333:174-181.
29. Kapp EA, Schutz F, Connolly LM, Chakel JA, Meza JE, Miller CA, Fenyo D,
Eng JK, Adkins JN, Omenn GS, Simpson RJ: An evaluation, comparison,
and accurate benchmarking of several publicly available MS/MS search
algorithms: sensitivity and specificity analysis. Proteomics 2005,
5:3475-3490.
30. Riley CP, Gough ES, He J, Jandhyala SS, Kennedy B, Orcun S, Ouzzani M,
Buck C, Roumani AM, Zhang X: The Proteome Discovery Pipeline - A Data
Analysis Pipeline for Mass Spectrometry-Based Differential Proteomics
Discovery. The Open Proteomics Journal 2010, 3:8-19.
31. Zhang X, Asara JM, Adamec J, Ouzzani M, Elmagarmid AK: Data pre-
processing in liquid chromatography-mass spectrometry-based
proteomics. Bioinformatics 2005, 21:4054-4059.
32. Zhang X, Hines W, Adamec J, Asara JM, Naylor S, Regnier FE: An
automated method for the analysis of stable isotope labeling data in
proteomics. J Am Soc Mass Spectrom 2005, 16:1181-1191.
33. Hartemink AJ, Gifford DK, Jaakkola TS, Young RA: Maximum-likelihood
estimation of optimal scaling factors for expression array normalization.
Microarrays: Optical Technologies and Informatics; San Jose, CA, USA. SPIE
2001, 132-140.
34. Newman JRS, Ghaemmaghami S, Ihmels J, Breslow DK, Noble M, DeRisi JL,
Weissman JS: Single-cell proteomic analysis of S. cerevisiae reveals the
architecture of biological noise. Nature 2006, 441:840-846.
35. Yocum AK, Chinnaiyan AM: Current affairs in quantitative targeted
proteomics: multiple reaction monitoring-mass spectrometry. Brief Funct
Genomic Proteomic 2009, 8:145-157.
36. Fang Y, Robinson DP, Foster LJ: Quantitative Analysis of Proteome
Coverage and Recovery Rates for Upstream Fractionation Methods in
Proteomics. Journal of Proteome Research 2010, 9:1902-1912.
37. Delanghe JR, Langlois MR: Hemopexin: a review of biological aspects and
the role in laboratory medicine. Clinica Chimica Acta 2001, 312:13-23.
38. Ferrario CM, Varagic J, Habibi J, Nagata S, Kato J, Chappell MC, Trask AJ,
Kitamura K, Whaley-Connell A, Sowers JR: Differential regulation of
angiotensin-(1-12) in plasma and cardiac tissue in response to bilateral
nephrectomy. American Journal of Physiology-Heart and Circulatory
Physiology 2009, 296:H1184-H1192.
39. Zhao JC, Xiao LJ, Zhu H, Shu Y, Cheng NS:
Changes of lipid metabolism in
plasma, liver and bile during cholesterol gallstone formation in rabbit
model. World Journal of Gastroenterology 1998, 4:337-339.
40. Geng M, Ji J, Regnier FE: Signature-peptide approach to detecting
proteins in complex mixtures. J Chromatogr A 2000, 870:295-313.
41. Gygi SP, Rist B, Gerber SA, Turecek F, Gelb MH, Aebersold R: Quantitative
analysis of complex protein mixtures using isotope-coded affinity tags.
Nat Biotechnol 1999, 17:994-999.
42. Collier TS, Sarkar P, Franck WL, Rao BM, Dean RA, Muddiman DC: Direct
Comparison of Stable Isotope Labeling by Amino Acids in Cell Culture
and Spectral Counting for Quantitative Proteomics. Anal Chem 2010,
82:8696-8702.
43. Regnier FE, Riggs L, Zhang RJ, Xiong L, Liu PR, Chakraborty A, Seeley E,
Sioma C, Thompson RA: Comparative proteomics based on stable isotope
labeling and affinity selection. Journal of Mass Spectrometry 2002,
37:133-145.
44. Smith RD, Anderson GA, Lipton MS, Pasa-Tolic L, Shen Y, Conrads TP,
Veenstra TD, Udseth HR: An accurate mass tag strategy for quantitative
and high-throughput proteome measurements. Proteomics 2002,
2:513-523.
45. Nakshatri H, Qi GH, You J, Kerry B, Schneider B, Zon R, Buck C, Regnier F,
Wang M: Intrinsic subtype-associated changes in the plasma proteome
in breast cancer. Proteomics Clinical Applications 2009, 3:1305-1313.
46. Aebersold R, Cravatt BF: Proteomics - advances, applications and the
challenges that remain. Trends in Biotechnology 2002, 20:S1-S2.
47. America AH, Cordewener JH: Comparative LC-MS: a landscape of peaks
and valleys. Proteomics 2008, 8:731-749.
48. Horvatovich P, Hoekman B, Govorukhina N, Bischoff R: Multidimensional
chromatography coupled to mass spectrometry in analysing complex
proteomics samples. J Sep Sci 2010, 33:1421-1437.
49. Ono M, Shitashige M, Honda K, Isobe T, Kuwabara H, Matsuzuki H,
Hirohashi S, Yamada T: Label-free quantitative proteomics using large
peptide data sets generated by nanoflow liquid chromatography and
mass spectrometry. Mol Cell Proteomics 2006, 5:1338-1347.
50. Liu H, Sadygov RG, Yates JR: A model for random sampling and
estimation of relative protein abundance in shotgun proteomics. Anal
Chem 2004, 76:4193-4201.
51. Fortier MH, Bonneil E, Goodley P, Thibault P: Integrated microfluidic device
for mass spectrometry-based proteomics and its application to
biomarker discovery programs. Analytical Chemistry 2005, 77:1631-1640.
52. Vollmer M, Horth P, Rozing G, Coute Y, Grimm R, Hochstrasser D,
Sanchez JC: Multi-dimensional HPLC/MS of the nucleolar proteome using
HPLC-chip/MS. J Sep Sci
2006, 29:499-509.
53. Yin H, Killeen K, Brennen R, Sobek D, Werlich M, van de Goor T:
Microfluidic chip for peptide analysis with an integrated HPLC column,
sample enrichment column, and nanoelectrospray tip. Anal Chem 2005,
77:527-533.
54. MacLean B, Tomazela DM, Shulman N, Chambers M, Finney GL, Frewen B,
Kern R, Tabb DL, Liebler DC, MacCoss MJ: Skyline: an open source
document editor for creating and analyzing targeted proteomics
experiments. Bioinformatics 2010, 26:966-968.
55. Falkner JA, Ulintz PJ, Andrews PC: A code and data archival and
dissemination tool for the proteomics community. American
Biotechnology Laboratory 2006, 24, 28, 30.
56. Riffle M, Eng JK: Proteomics data repositories. Proteomics 2009,
9:4653-4663.
doi:10.1186/1479-5876-9-80
Cite this article as: Riley et al.: A large, consistent plasma proteomics
data set from prospectively collected breast cancer patient and healthy
volunteer samples. Journal of Translational Medicine 2011 9:80.
Submit your next manuscript to BioMed Central
and take full advantage of:
• Convenient online submission
• Thorough peer review
• No space constraints or color figure charges
• Immediate publication on acceptance
• Inclusion in PubMed, CAS, Scopus and Google Scholar
• Research which is freely available for redistribution
Submit your manuscript at
www.biomedcentral.com/submit
Riley et al. Journal of Translational Medicine 2011, 9:80
/>Page 11 of 11